Effects of intermediate stress on deep rock strainbursts under true triaxial stresses
Lihu Hu, Liyun Yu, Minghe Ju, Xiozho Li, Chun’n Tng
a State Key Laboratory for Geomechanics and Deep Underground Engineering, China University of Mining and Technology, Xuzhou, 221116, China b Sate Key Laboratory of Coastal and Offshore Engineering, Dalian University of Technology, Dalian,116024, China c Key Laboratory of Disaster Prevention and Structural Safety of Ministry of Education, School of Civil and Architecture Engineering,Guangxi University, Nanning,530004, China
Keywords:Strainbursts Intermediate stress Distinct element method (DEM)Structural failure True triaxial Strength criterion
ABSTRACT The effect of intermediate stress (in situ tunnel axial) on a strainburst is studied with a threedimensional (3D) bonded block distinct element method (DEM).A series of simulations of strainbursts under true triaxial in situ stress conditions(i.e.high tangential stress, moderate intermediate stress and low radial stress)of near-boundary rock masses are performed.Compared with the experimental results,the DEM model is able to capture the stress-strain response, failure pattern and energy balance of strainbursts.The fracturing processes of strainbursts are also numerically reproduced.Numerical results show that, as the intermediate stress increases: (1) The peak strain of strainbursts increases, the yield stress increases, the rock strength increases linearly, and the ratio of yield stress to rock strength decreases, indicating that the precursory information on strainbursts is enhanced; (2) Tensile and shear cracks increase significantly, and slabbing and bending of rock plates are more pronounced; and (3) The stored elastic strain energy and dissipated energy increase linearly, whereas the kinetic energy of the ejected rock fragments increases approximately exponentially, implying an increase in strainburst intensity.By comparing the experimental and numerical results, the effect of intermediate stress on the rock strength of strainbursts is discussed in order to address three key issues.Then,the Mogi criterion is applied to construct new strength criteria for strainbursts by converting the one-face free true triaxial stress state of a strainburst to its equivalent true triaxial stress state.In summary, the effect of intermediate stress on strainbursts is a double-edged sword that can enhance the rock strength and the precursory information of a strainburst, but also increase its intensity.
1.Introduction
Strainbursts, violent engineering geological hazards that occur frequently during excavation of the tunnels and mining in deep hard rocks, can cause serious casualties and significant economic losses (Zhang et al., 2012; Cai and Kaiser, 2018; Feng et al., 2018;Zhou et al., 2018; Zhai et al., 2020).Strainbursts have been a challenge in rock mechanics and rock engineering(Cai and Kaiser,2018;Feng et al., 2018, 2022; Vazaios et al., 2019; Yu et al., 2022).The complexity of strainbursts stems not only from the complexity of the rock material itself (e.g.heterogeneity and nonlinearity) but also from site-specific conditions of rock mass near the excavation boundary(i.e.the burst volume)(Zhao et al.,2014;Hu et al.,2021).In general, for deep underground rock engineering, the nearboundary rock mass is actually under a specific true triaxial stress state, that is, the maximum (tangential) stress σ1is very high, the intermediate(tunnel axial)stress σ2is moderate,and the minimum(radial) stress σ3ranges from zero to low (Kaiser et al., 2000;Diederichs, 2003; Cai and Kaiser, 2014; Gao et al., 2018, 2020; Hu et al., 2021).
Under true triaxial compression(σ1>σ2>σ3),the intermediate stress σ2is well known to have a significant effect on rock behaviour (Mogi, 1967, 1971, 2007; Chang and Haimson, 2000, 2012;Haimson and Chang, 2000, 2002).Numerous studies have been conducted analytically, experimentally and numerically to understand the influence of σ2on rock behaviour.Wiebols and Cook(1968) proposed an energy criterion for rock and theoreticallyinvestigated the effect of σ2on rock strength.In their model, the effect of σ2was dependent on the coefficient of sliding friction, a parameter that could not be determined experimentally.Zheng and Deng (2015) developed a failure probability model to study the effect of σ2on rock strength.Compared with the theoretical approach, laboratory test is a more direct and effective way to investigate the effect of σ2on rock behaviour.With the development of various types of true triaxial testing equipment and precise measurement methods, many true triaxial experimental studies have been focused on different types of rocks (Murrell, 1963;Handin et al., 1967; Mogi, 1967, 1971, 2007; Vernik and Zoback,1992; Chang and Haimson, 2000, 2012; Haimson and Chang,2000, 2002; You, 2009; Haimson et al., 2010; Feng et al., 2016,2020;Gao et al.,2018,2020;Li et al.,2018).Based on the test data,researchers have studied the effect of σ2on the strength and deformability of rocks and proposed various true triaxial strength criteria (Mogi,1967,1971; Al-Ajmi and Zimmerman, 2005; Chang and Haimson, 2012; Feng et al., 2020).Meanwhile, numerical simulations have been powerful tools for studying rock behaviour under complex conditions (Wang et al., 2021a).To reveal the mechanisms of the effect of σ2on rock behaviour, true triaxial numerical tests using various methods or models, including the finite differences method(FDM)(Qiu et al.,2015;Feng et al.,2019),extended finite element method (XFEM) (Wang et al., 2018), elastoplastic cellular automation (EPCA3D) (Pan et al., 2012), discrete element method (DEM) (Fjær and Ruistuen, 2002; Zhang et al.,2014; Liu et al., 2017; Faizi et al., 2020), and finite/discrete element method (FDEM) (Cai, 2008), have been performed by researchers.Among these numerical studies, DEM is a promising method.The DEM analyses of the effect of σ2adopt mainly particlebased models (e.g.the particle flow code (PFC)).However, DEM simulations on the effect of σ2with the bonded block DEM(e.g.the universal distinct element code (UDEC) and three-dimensional distinct element code (3DEC)) that are currently widely used for modelling the fracture of intact hard rocks are rarely reported(Kazerani and Zhao, 2010; Wang et al., 2021a).
According to previous studies, a consensus is that as σ2increases, rock strength first increases and then decreases when σ2exceeds a threshold.However,in previous true triaxial experiments(Haimson and Chang,2000;Al-Ajmi and Zimmerman,2005;Mogi,2007),σ2varies from σ3to σ1and can be hundreds of MPa,which is not consistent with the stress conditions of the rocks undergoing strainbursts near the excavation boundary.In fact, the analysis of the stress field of the near-boundary rock mass under the in situ stress conditions of several typical deep projects shows that(Vernik and Zoback, 1992; Martin, 1997; Haimson and Chang, 2002; Cai,2008; Haimson et al., 2010; Cai and Kaiser, 2014; Gao et al.,2018), in terms of strainbursts, σ2is not very high and the intermediate stress ratio b=(σ2-σ3)/(σ1-σ3)is usually lower than 30%(Su et al., 2017a, b, c; Hu et al., 2020, 2021).Then, a contradiction appears.That is, in conventional rock mechanics, to fully understand the effect of σ2on rock behaviour,σ2varies over a wide range,and its magnitude can be appreciable because σ2is indeed very likely to be very high when studying rock behaviour and earthquake mechanisms at very deep crust levels (Mogi, 1967, 1971,2007;Chang and Haimson,2000,2012;Haimson and Chang,2000,2002;Haimson et al.,2010).However,for a rock engineering issue such as strainbursts, the intermediate stress corresponds to the initial tunnel axial stress, which is moderate according to typical deep rock engineering.If we ignore the tunnel axial stress being moderate and blindly investigate the effect of very high intermediate stress on strainbursts, the conclusions drawn may be misleading in evaluating the effect of the intermediate stress on strainbursts in practice.In addition, the strainbursts are also attributed to the stress path in which the near-boundary rock mass changes from the initial true triaxial state to a ‘one-face free true triaxial’ state after excavation and unloading (Zhao et al., 2014,2021; Su et al., 2017a, b, c; Hu et al., 2020, 2021).Therefore, conventional true triaxial tests are not suitable for simulating strainbursts.For this,He et al.(2007,2010,2012a,b,c)performed a series of true triaxial experimental studies on strainbursts by abruptly unloading one single face of the rock sample.Recently, Su et al.(2017a, b, c) adopted a loading path of ‘one-face free true triaxial’to simulate the strainburst process.Therefore, to understand the effect of intermediate stress on strainbursts, the mechanical environments(i.e.the stress path and the moderate intermediate stress conditions of the near-boundary rock mass) should be fully considered.
Based on the testing method developed by Su et al.(2017b, c),researchers have conducted some experimental studies on the effect of intermediate stress on strainbursts (Su et al., 2017b; Zhao et al., 2021).These experimental studies focused mainly on macro-scale observations, while the underlying micro-scale fracturing mechanism of the intermediate stress on strainbursts was not verified.Wang et al.(2021b) conducted a micromechanical study on the effect of the intermediate stress on strainbursts with a particle-based DEM based on the experiment performed by Su et al.(2017b).However,several strainburst features,such as the process from static to dynamic, the yield platform of the stress-strain curves, and the energy release, were not captured by their models.A scenario that restricts our understanding of the effect mechanism of intermediate stress on strainbursts is that we unconsciously regard strainbursts as a rock mechanics issue rather than a rock engineering issue.That is,the strainburst is a structural damage of a large volume of rock mass near the excavation boundary rather than failure of a rock element.This is caused by rock fracturing under specific stress conditions and the interaction imposed by the far-field elastic surrounding rocks and abrupt release of elastic energy stored in the surrounding rocks, once the stress exceeds the strength of the burst volume.The above view that the strainburst is a structural damage of rock mass near the excavation boundary has been recognized(e.g.Deng and Gu,2018;Hu et al., 2020, 2021).For example, Hu et al.(2020, 2021) established a structural model and a bonded block DEM-based numerical model to investigate strainbursts and numerically analysed the influence of radial stress on strainbursts.The effect of intermediate stress on strainbursts also resembles the effect of intermediate stress on the bearing capacity of strip and circular footings (Ma et al., 2014).
In the present study, we are devoted to investigating the effect of intermediate stress on strainbursts using DEM and structural analysis.The stress path,the specific true triaxial stress conditions and the structural features of strainbursts are considered.True triaxial numerical simulations of strainbursts under various intermediate stress conditions are performed with a bonded block DEMbased two-stage structural model (Hu et al., 2020, 2021).Next, by comparing the experimental and numerical results, the effect of intermediate stress on the rock strength of strainbursts is discussed.Then, the Mogi strength criterion is applied to construct strength criteria for strainbursts by converting the one-face free true triaxial stress state of a strainburst to its equivalent true triaxial stress state,and the potential applications of these strength criteria in estimation of the tendency and intensity of strainbursts in practice are also discussed.
2.DEM model for simulating strainbursts
2.1.Problem statement
For a deep tunnel, the rock mass is in a state of initial true triaxial stress, i.e.σ1> σ2>σ3.Stress concentration and redistribution occur after excavation, resulting in release of radial stress and concentration of tangential stress in the near-boundary rock mass.A representative rock element(RRE)within the burst volume is chosen to analyse the boundary conditions of strainbursts(Fig.1),and the stress is actually the load exerted on its boundary by the connecting surrounding rocks (Su et al., 2017b, c; Hu et al., 2020,2021).To distinguish from conventional rock mechanics, we used the stress in the Cartesian coordinate system (not in the principal stress space)to express the stress(loading)state of strainbursts.In Fig.1, σx,σyand σzare the compressive stresses acting on the surfaces in the three directions of the RRE, and τxy,τyzand τzxare the shear stresses acting on the surfaces.σzis the maximum (tangential) stress (i.e.rock strength) when strainbursts occur, σxis the intermediate stress that is approximately equal to the initial tunnel axial stress σ2, and σyis the minimum stress that is less than the initial tunnel radial stress σ3.Previous studies have shown that under strainburst conditions (Diederichs,2003; Su et al., 2017b, c;Gao et al., 2018; Hu et al., 2020, 2021), it usually yields σz(very high)> σx(moderate)» σy(very low).In the present study, we investigated the effect of the intermediate stress σxon strainbursts with DEM model.
2.2.Modelling methods
Considering the structural features, stress path and stress conditions of strainbursts,3DEC is used to construct a numerical model for simulating strainbursts(Hu et al.,2020,2021).Recently,UDEC/3DEC has become a promising numerical tool for investigating strainbursts and complex rock engineering issues(Zhou et al.,2018;Gao et al., 2019; Hu et al., 2020, 2021; Wang et al., 2021a).Considering that a strainburst is resulted from the interaction between the surrounding rocks and burst volume, the numerical model consists of the loading platens representing the surrounding rocks and the rock sample representing the burst volume(Fig.2a).The loading platens exert loads on the rock sample and simultaneously serve as energy storage elements to provide a kinetic energy source to the ejected rock fragments.According to the energy theory of rockbursts (Cook, 1965; Tarasov and Stacey, 2017), a strainburst occurs in a relatively soft loading environment, that is,the loading system stiffness (LSS) is less than the post-peak stiffness of the burst volume.In the proposed numerical model,the LSS can be calculated according to the elastic properties and geometric dimensions of the loading platens with formula kL=ELAL/lL,where kL,EL,ALand lLare respectively the stiffness,elastic modulus,crosssection area and length of a loading platen.Because the z-direction load drives rock failure,we considered only the effect of z-direction LSS(Fig.2).The parameters of the loading platens are presented in Section 2.3.In addition, the contacts between the loading platens and the rock sample are fictitious discontinuity contacts used to transfer the interaction between the loading platens (surrounding rocks) and rock sample (the burst volume) (see Section 2.3).The loading path used in the strainburst numerical model is as follows(Fig.2b):
(1) Loading in true triaxial state.Apply the predetermined stresses σy,σxand σzsequentially to the outer boundaries of the platens and calculate balance of the model.
(2) Unloading one single face of the model abruptly.Remove a ydirection loading platen and its stress boundary condition,then calculate the model to balance.
(3) One-face-free true triaxial loading process.Maintain the unloaded face free, apply vertical (z-direction) stress to the upper loading platen by changing its stress boundary to a downwards constant small velocity boundary, and continuously load the model to the peak stress.
(4) Calculation of the dynamic post-peak response.Re-active the calculation results of Step (3), turn on the dynamic calculation module, and set dynamic boundary conditions and appropriate damping for calculating the ejection process in the post-peak stage of strainbursts (Section 2.3).
Based on the stress combinations of the rock mass near the excavation boundary of many typical deep rock engineering projects(Martin,1997;Diederichs,2003;Cai and Kaiser,2014;Su et al.,2017a,b,c;Gao et al.,2018;Hu et al.,2020,2021),a numerical test plan is designed for simulating strainbursts.The minimum stress σyis set to 0 MPa,1 MPa, 5 MPa and 10 MPa.Although the intermediate stress is moderate, for comparison with the experimental results(Su et al.,2017b;Zhao et al.,2021),we set the intermediate stress σxto vary from σyto 120 MPa.
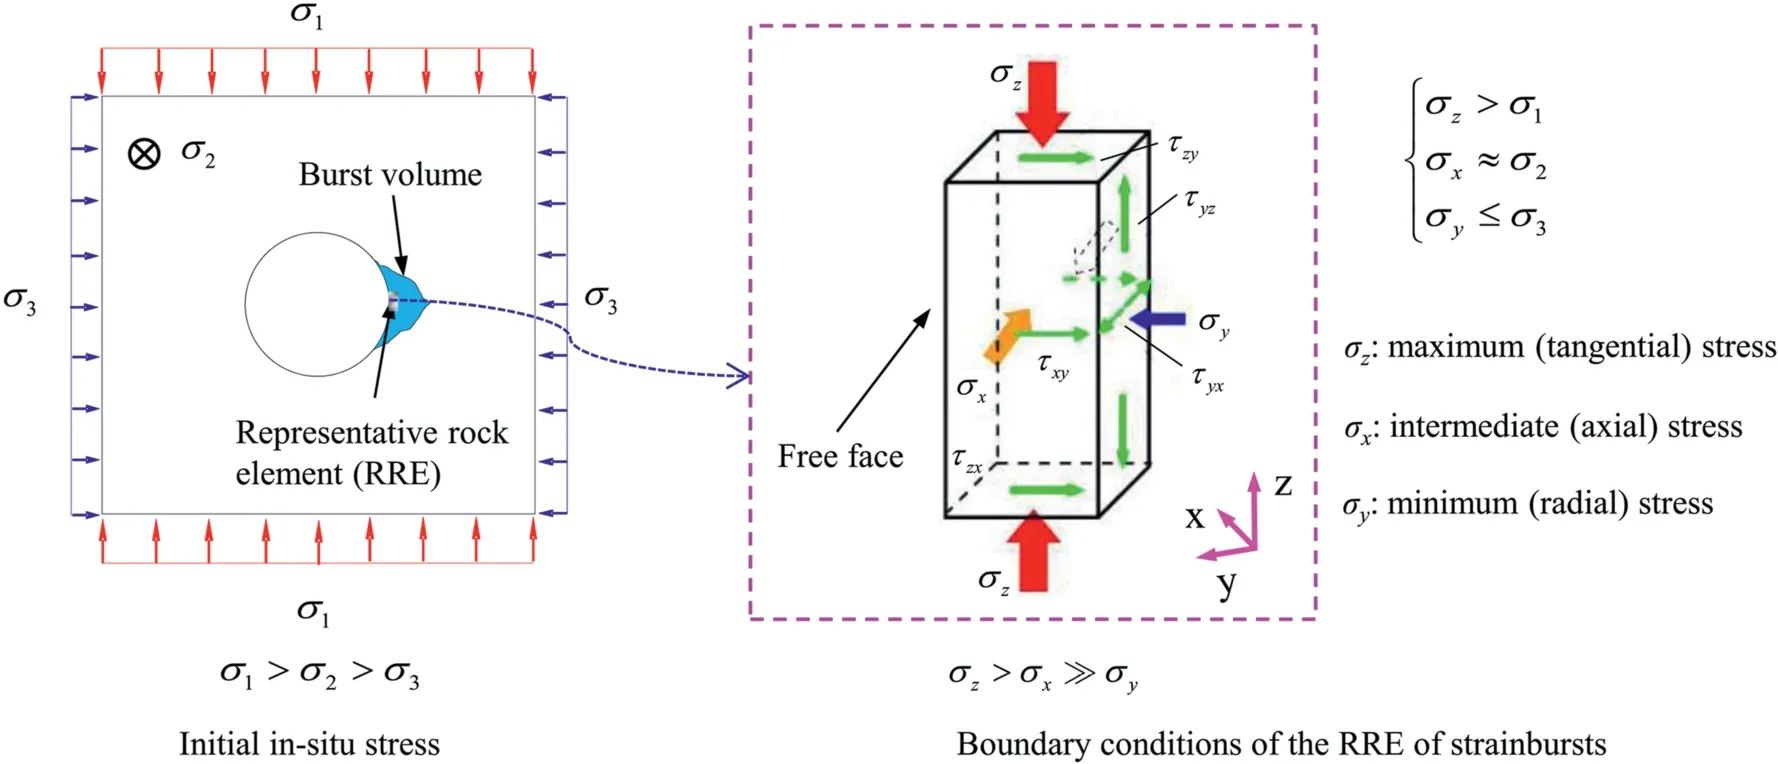
Fig.1.Illustration of the boundary conditions of the RRE of strainbursts and terminology for the stresses (after Su et al.(2018) and Hu et al.(2020)).

Fig.2.Modelling strainbursts using DEM (after Su et al.(2017b)and Hu et al.(2020)),where σy and σy1 (σy = σy1) are the radial stresses acting on the two lateral loading platens in y-direction:(a)Numerical model and boundary conditions;and(b)Loading path.
2.3.Micro-parameters of the DEM model
The micro-parameters of the DEM model for strainbursts consist of the parameters of loading platens, rock sample, contacts between rock sample and loading platens, and other parameters/setups for DEM calculation(Hu et al.,2020,2021).A loading platen is a single intact elastic block,and its parameters include geometric parameters (i.e.cross-sectional area ALand length lL) and elastic parameters (i.e.density ρL, elastic modulus ELand Poisson’s ratio νL).The cross-sectional area ALis a constant, identical to the corresponding cross-sectional area of the rock sample.The required stiffness kLof the loading system can be obtained by adjusting ELand lL(i.e.kL= ELAL/lL).The strategy for adjusting ELand lLis to consider the calculation efficiency and accuracy of the modelling simultaneously under the condition of meeting the requirement of the LSS.Therefore, the contrast of the block stiffness in the DEM model cannot be too large (Itasca Consulting Group Inc, 2013),compared with the stiffness of blocks of the rock sample;ELshould be neither too large nor too small, and the length lLcannot be too large (Wang and Cai, 2018; Hu et al., 2020, 2021).Using the trialand-error method, the geometric dimensions of the loading platens are shown in Fig.2.The elastic parameters of the loading platens are as follows:the density and Poisson’s ratio take the steel material parameters, i.e.ρL= 7800 kg/m3, νL= 0.3; the elastic modulus of the upper loading platen(soft)is EL=40 GPa,and the elastic modulus of other loading platens (stiff) is set to the steel material parameter as EL= 206 GPa.
Su et al.(2017b)and Zhao et al.(2021)experimentally studied the effect of intermediate stress on strainbursts with red granite and Beishan granite,respectively.Detailed mechanical properties of these rocks are not available for calibration of the DEM model.In this study, we selected the hard brittle grey-white coarsegrained granodiorite, which was used in experimental and numerical investigations on the effect of the radial stress on strainbursts(Su et al.,2017c;Hu et al.,2020),for DEM simulations.The size of rock sample is 100 mm × 100 mm × 200 mm(length × width × height), and the tested average physicomechanical properties are listed in Table 1.To represent the rock sample,the DEM model is generated by a hybrid Octree/Delaunay method, which consists of 20,913 tetrahedral blocks.The blocks are further divided into finite difference zones to make them deformable for DEM calculation.To obtain the parameters of the numerical rock sample,we carried out a series of numerical tests including uniaxial compression tests, triaxial compression tests,and direct tension tests, to calibrate each parameter as per the standard calibration procedure of DEM modelling (Kazerani and Zhao, 2010; Gao and Stead, 2014; Wang and Cai, 2018; Hu et al.,2020).The final calibrated parameters of the numerical rock sample are presented in Table 2.

Table 1Physical and mechanical properties of the rock sample (Hu et al., 2020).

Table 2Calibrated micro-parameters of the DEM model for the rock sample (after Hu et al.(2020)).
The characteristic of the fictitious contacts between the rock sample and the loading platens is that only the peak friction angle of their strength parameters is not 0.The parameters of these special contacts are as follows:the normal stiffness knand the shear stiffness ksare the same as the knand ksof the blocks of the rock sample (Hu et al., 2020), and the strength parameters are set as Cp=Cr=0,μ=tanφp=0.26,φr=0°,and Tp=Tr=0,where μ is the friction coefficient of these contacts, representing the friction coefficient of the granodiorite-steel interface.
Other parameters/setups of the DEM model for calculating the dynamic responses of strainbursts include the loading rate, mechanical damping, and boundary conditions.After unloading one single surface, the tangential load is applied by setting the upper loading platen with a small constant downwards velocity boundary(Fig.2).In 3DEC simulations, it is required that in every time step,the model should be in a quasi-static state.Numerical tests were performed to study the loading rate effect,and the final determined loading rate is 0.1 m/s(Hu et al.,2020).Mechanical damping is used in DEM calculations to consume the excess energy of the system to obtain an equilibrium or steady state.In the present DEM model for strainbursts, the pre-peak calculation is static, and the default damping with a damping coefficient of 0.8 in 3DEC is adopted.Dynamic calculation is turn on for calculating the post-peak ejection process of strainbursts,and zero damping is used to reflect the large displacement and kinetic energy release characteristics involved (Gao et al., 2019; Hu et al., 2020).Meanwhile, a viscous boundary is applied to the outside boundary of the loading platens to avoid stress wave reflection.
2.4.Monitoring methods of the DEM model
Similar to the experiments, to understand the influence of the intermediate stress on strainbursts, the changes in a series of physical quantities are monitored in the numerical tests (Fig.3).The monitored quantities include the stresses and strains in the three directions,the number of tensile and shear cracks,the stored elastic energy, and the released kinetic energy of the ejected fragments.The stresses and strains are recorded through monitoring points arranged in the rock sample.The stress in z-direction σzis recorded by averaging the z-direction stress of all zones of the sample.The strain in z-direction εzis recorded by monitoring the average z-direction displacement δzof 5 monitoring points arranged at the centre of a plane 5 mm away from the upper surface of the sample,i.e.εz=δz/h,where h is the height of the sample.The strains in the two horizontal directions are calculated by monitoring the average horizontal displacements of corresponding monitoring points arranged in planes 5 mm away from the corresponding lateral surfaces of the sample, i.e.εy= δy/l, εx= δx/w,where δyand δxare the y- and x-direction displacements, respectively;l and w are length and width of the sample,respectively.The volumetric strain(εv)can be calculated with the strains in the three directions:
With the built-in FISH programming language, user-defined functions are coded to determine the failure state (tensile or shear)of the contacts(or subcontacts)to represent tensile or shear cracks.That is, if the tensile stress on a contact exceeds its tensile strength,the contact is treated as a tensile crack;if the shear stress exceeds its shear strength, the contact is treated as a shear crack.The number of tensile and shear cracks are recorded to study the cracking process of strainbursts.The stored elastic energy and the released kinetic energy of the ejected fragments are also recorded:
where Ueand Ueiare the total elastic energy and the elastic energy of the ith zone, respectively;σ1i,σ2iand σ3iare the three principal stresses of the ith zone, respectively; Eiand νiare the elastic modulus and Poisson’s ratio of the ith zone, respectively; and n is the number of zones.
where Ukand Ukiare the total kinetic energy and the kinetic energy of the ith block, respectively; miand viare the mass and average(effective) velocity of the ith block, respectively (Fig.3); and p denotes the number of ejected rock fragments.The ejected blocks refer to blocks that are more than 1 mm away from the sample during the simulation.
2.5.Model verification
The DEM model for simulating the strainburst in this study is based on a two-stage structural model,which has been successfully used to numerically reproduce the overall development process of strainbursts from static to dynamic state, and to investigate the influencing mechanism of radial stress on strainbursts (Hu et al.,2020, 2021).The DEM simulations successfully capture various features of strainbursts under different intermediate stresses,such as stress-strain response (especially the yield platform), fracturing process (i.e.crack development, spatial fracturing process and failure pattern), and energy balance(i.e.the elastic energy storage and kinetic energy release).The consistency compared with reported experimental results (Su et al., 2017b; Zhao et al., 2021)demonstrates the correctness of the DEM model.
3.Numerical results and analysis
3.1.Effect of intermediate stress on the stress-strain response of strainbursts
Since a strainburst is the structural damage of rock mass, its stress-strain response is actually nominated from its forcedisplacement response (Hu et al., 2020, 2021).Fig.4 shows the relationship curves between the x-direction strain εx, y-direction strain εy, z-direction strain εz, volumetric strain εvand the z-direction stress σzwhen the minimum stress is σy= 1 MPa and the intermediate stress σxvaries from 1 MPa to 120 MPa.As σxincreases,the characteristics of each curve change remarkably.In particular,the characteristic of a relatively flat εz-σzsegment before the peak stress, which the authors refer to as the yield platform (Su et al.,2017a; Hu et al., 2020, 2021), is captured by the DEM simulations.This yield platform is characterized by the scenario that stress basically remains unchanged and the strain increases significantly.The yield platform is a manifestation of the structural feature of strainbursts, which is the result of the nucleation, propagation,coalescence,interaction and persistent fractures in the sample(Hu et al.,2020,2021).Therefore,according to the characteristics of the yield platform, the εz-σzcurve of strainbursts under different intermediate stresses can be divided into three types (see Fig.4):Type I, σx= 1-30 MPa, the yield platform is very short and notobvious; Type II,σx= 40 MPa,the yield platform is approximately flat;and Type III,σx=60-120 MPa,the yield platform rises slightly.

Fig.3.Illustration of the monitoring methods of the DEM model.

Fig.4.Simulated true triaxial stress-strain responses of strainbursts under various intermediate stresses σx(with σy=1 MPa),where characteristic points are denoted with yellow balls: (a)-(m) Stress-strain curves under each σx, and (n) Summary of three types of z-direction stress-strain curves.
The failure process of rock includes several stages,and there are several characteristic stresses (strains), such as the crack initiation stress σi, crack damage stress σd, and peak stress σp(Martin,1997;Cai and Kaiser, 2014; Gao et al., 2018; Jiang et al., 2021).In this study, considering the characteristics of the yield platform, variations in the characteristic stresses and strains of strainbursts arestudied to quantify the effect of the intermediate stress σxon strainbursts.In Fig.4, the characteristic stresses and strains are identified by the yellow balls: the maximum volumetric stain(compressive)εvm,the strain at the start of the yield platform εyield(corresponding to εvm), and the strain at the end of the yield platform εpeak,the stress at the start of the yield platform σyield,and the stress at the end of the yield platform σpeak(i.e.rock strength).

Fig.4.(continued).
3.1.1.Effect on characteristic strains
Fig.5 shows the effect of σxon the characteristic strains of strainbursts.In Fig.5a, as σxincreases, εyieldincreases slightly and εpeakincreases significantly,resulting in a significant increase in the strain difference,i.e.the length of the platform,εΔ=εpeak-εyield.At the transition of the stress-strain curve from Type I to Type II (i.e.σx= 30 MPa), the characteristic strains change significantly.Toσyieldand the ratio of yield stress to rock strength (i.e.σyield/σpeak).As σxincreases, σyieldincreases approximately with a power law,but σyield/σpeakdecreases approximately linearly, indicating that due to the strengthening effect of the intermediate stress on rock,the yield stress of strainbursts increases.However,the decrease in the ratio of yield stress to strength indicates that although the value of yield stress is increased,a strainburst still enters the yield stage earlier compared to its rock strength.Therefore, with increase of the intermediate stress increases, from the point of view of yield stress, the precursor information of strainbursts is more obvious,which matches the analysis results of the characteristic strains(see Section 3.1.1).

Fig.5.Effect of the intermediate stress σx on characteristic strains of strainbursts,(a)ε and(b)εvm where εpeak is the peak z-direction strain,εyield is the strain in z-direction at the start of the yield platform,εΔ=εpeak-εyield is the strain difference,and εvm is the maximum compressive volumetric strain.
(2) Peak stress(rock strength)
In this study, the term ‘rock strength of strainbursts’ actually denotes the bearing capacity of the burst volume (represented by the rock sample)under its realistic conditions(Hu et al.,2021).The necessary condition for inducing strainbursts is that the stress reaches the strength of the burst volume.Therefore,we needed to understand the‘rock strength of strainbursts’to assess strainbursts.Table 3 lists the DEM simulation results of strainbursts, and Fig.7 shows the effect of the intermediate stress σxon the rock strength of strainbursts.Fig.7 shows that under the strainburst conditions where the minimum stress σyis very low and the intermediate stress σxis moderate,as σxincreases,the rock strength of strainbursts exhibits a remarkable linear growth.evaluate rock deformability, Mogi (2007) used the permanent strain before rock fracture as a measure of ductility.Using this definition,the strain difference εΔ=εpeak-εyieldof strainbursts can be taken approximately as its ductility(see Fig.4).With increase of σx,the ductility of strainbursts increases,and then σx=30 MPa can be used as a transition point,i.e.when σx<30 MPa,the ductility is relatively small; when σx> 30 MPa,the ductility increases significantly.Since the yield platform is an important stage prior to burst(Hu et al., 2020, 2021), the increase of ductility indicates that the precursor information of strainbursts is more obvious as σxincreases, which is helpful for predicting strainbursts.Fig.5b shows that as σxincreases, the maximum compressive volumetric strain εvmincreases first and then decreases when σxis small.When σxincreases, the compressive deformation in x- and z-direction increases; as σxincreases to a certain extent, the expansion and bending of rock near the free face along the y-direction increase,resulting in a decrease in the compressive volumetric strain.
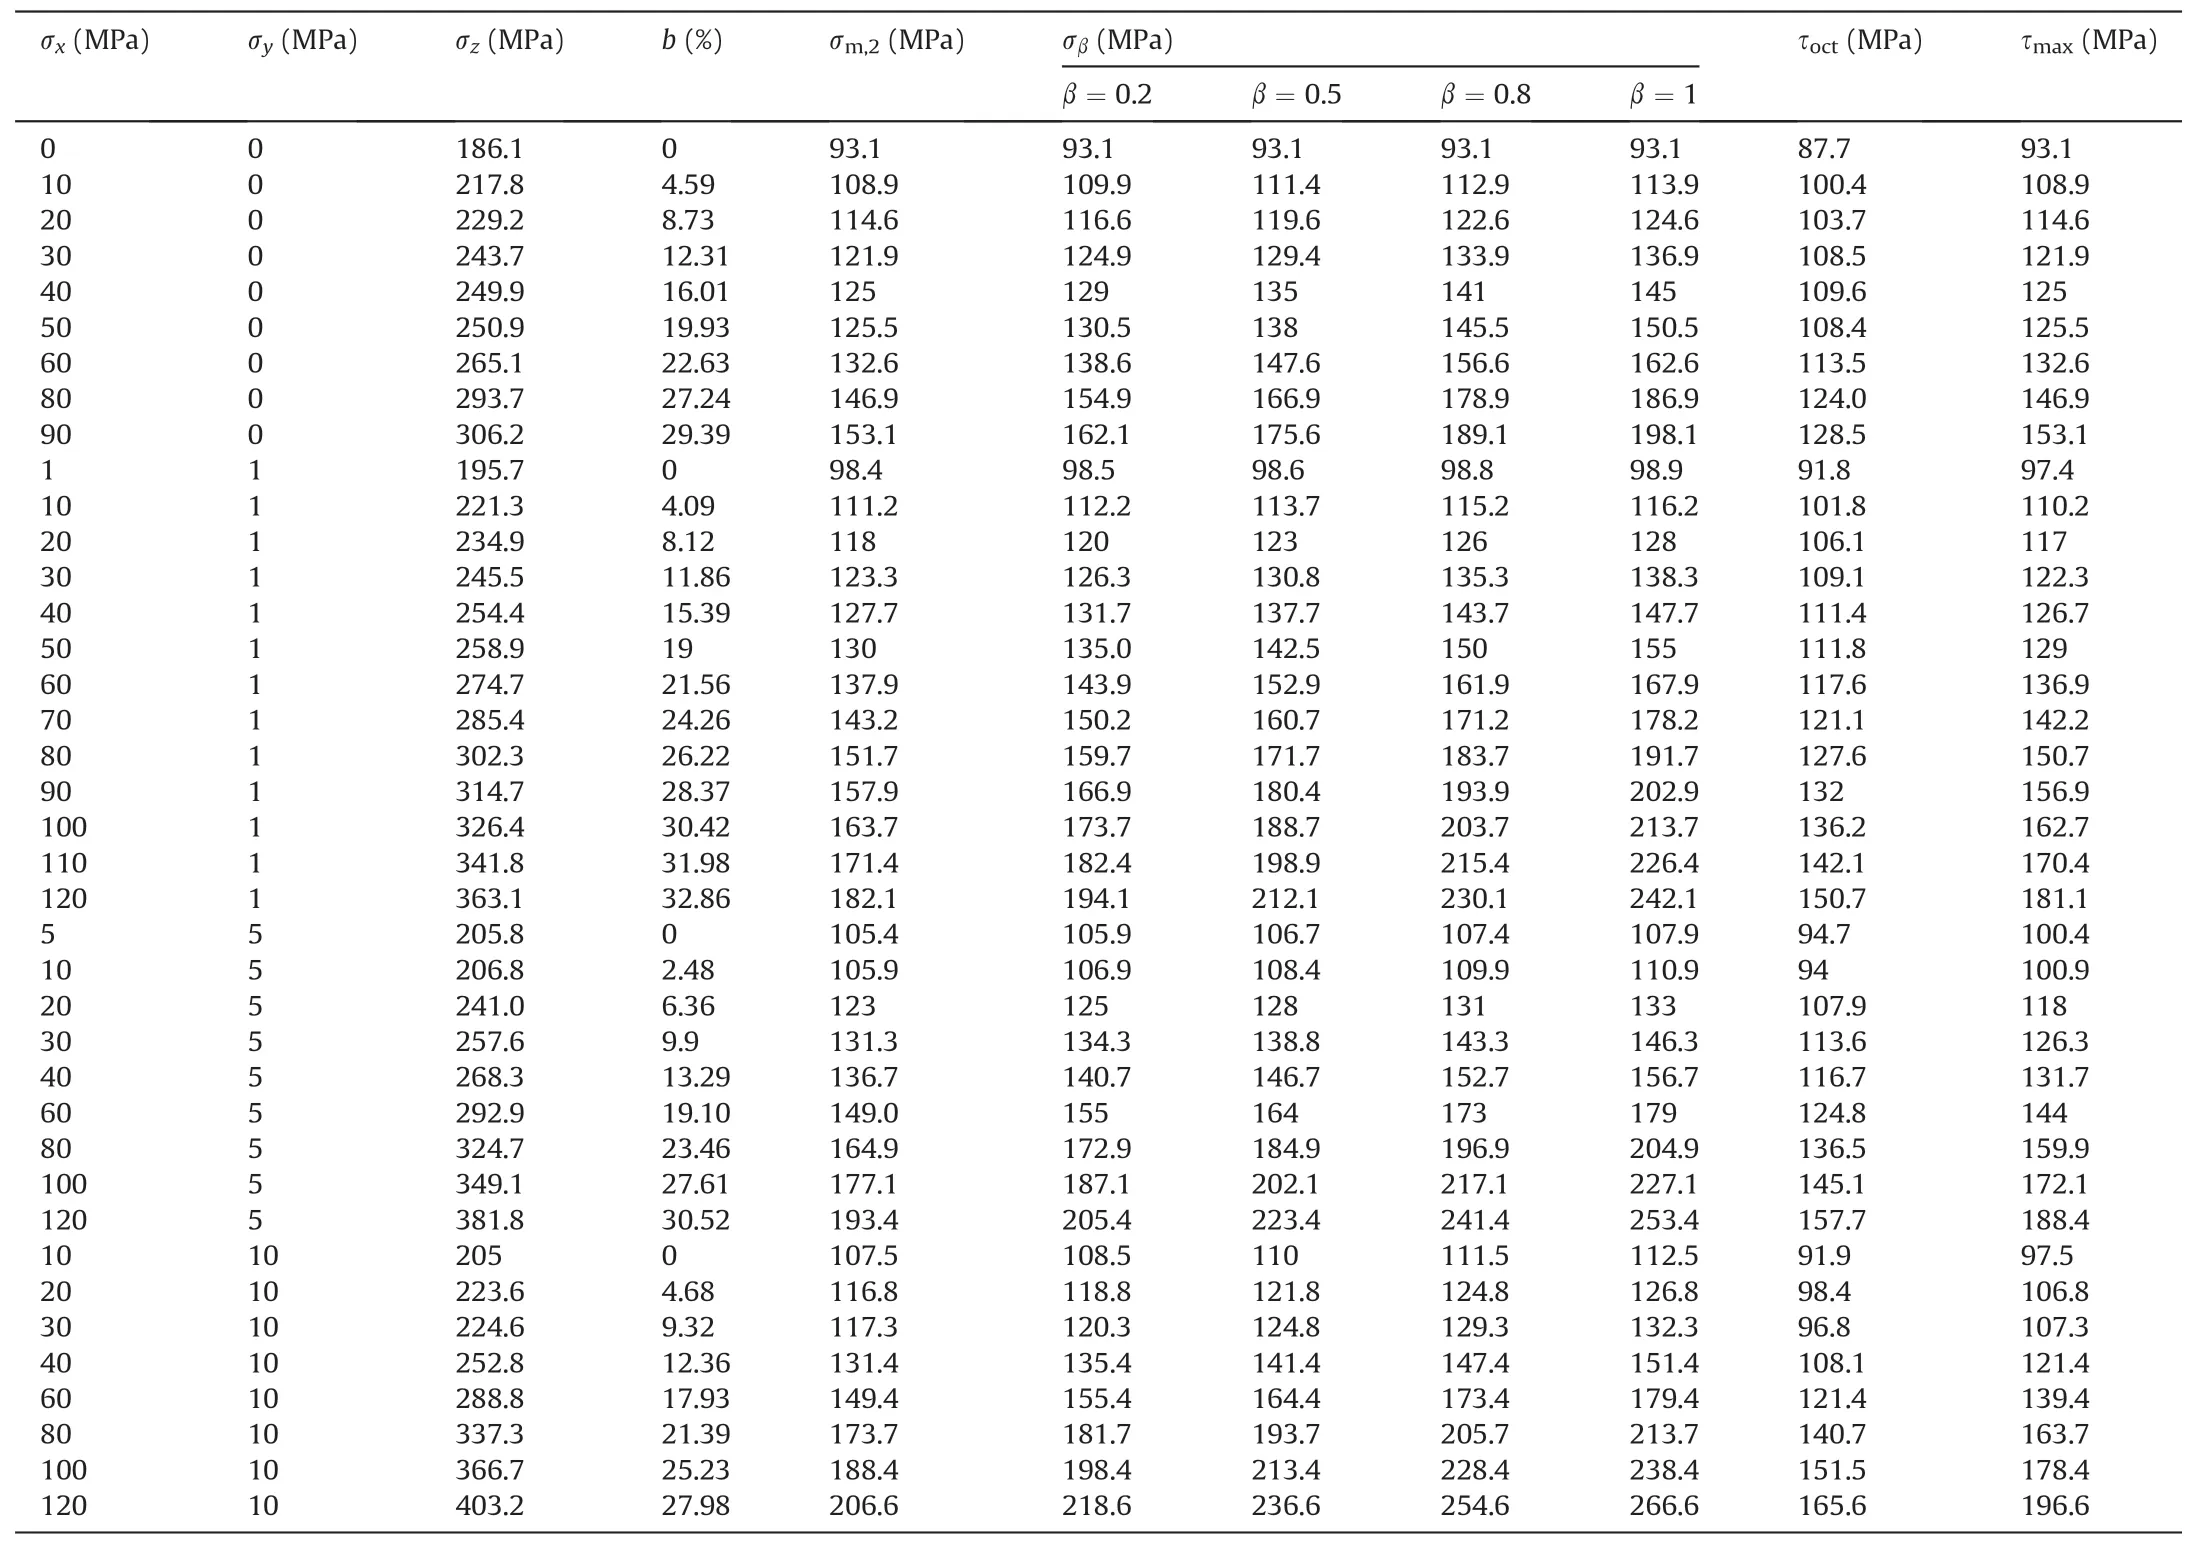
Table 3DEM simulation results of true triaxial strainburst tests.

Fig.6.Effect of intermediate stress σx on (a) Yield stress σyield and (b) Ratio of yield stress to strength (σyield/σz) of strainbursts.
3.1.2.Effect on characteristic stresses
(1) Yield stress
In this study, the yield stress σyieldof strainbursts is defined as the stress at the start of the yield platform, which corresponds to the crack damage stress σdof rock under true triaxial compression(Gao et al.,2018;Jiang et al.,2021).Fig.6 shows the effect of σxon
The strength criteria of rocks under a true triaxial stress state are of great significance for establishing rock constitutive models,evaluating in situ ground stress and rock engineering stability(Mogi, 1967, 1971, 2007; Vernik and Zoback, 1992; Haimson and Chang, 2000; Al-Ajmi and Zimmerman, 2005; You, 2009; Chang and Haimson, 2012).Among these criteria, the empirical strength criteria proposed by Mogi (1967, 1971, 2007) and Haimson and Chang (2000, 2002), which are derived from a large amount of true triaxial test data of different rocks, are widely used.Their strength criteria are based on the von Mises theory and consider the pressure dependence of hard brittle rock strength.That is, the critical distortional strain energy is assumed to increase with the effective mean normal stress on the failure plane:
where f is a monotonically increasing function.In Eq.(4), the effective mean normal stress does not take the octahedral normal stress σoct= (σ1+σ2+σ3)/3 because under true triaxial compression, shear faulting dominates brittle rock failure and the shear fault plane is nearly flat and are basically parallel to the direction of intermediate stress(Mogi,2007).The criterion expressed by Eq.(4)was first proposed by Mogi (1971), which is also called the Mogi(1971)criterion in the literature.There are two versions when this criterion is used to fit and analyse the true triaxial test data:
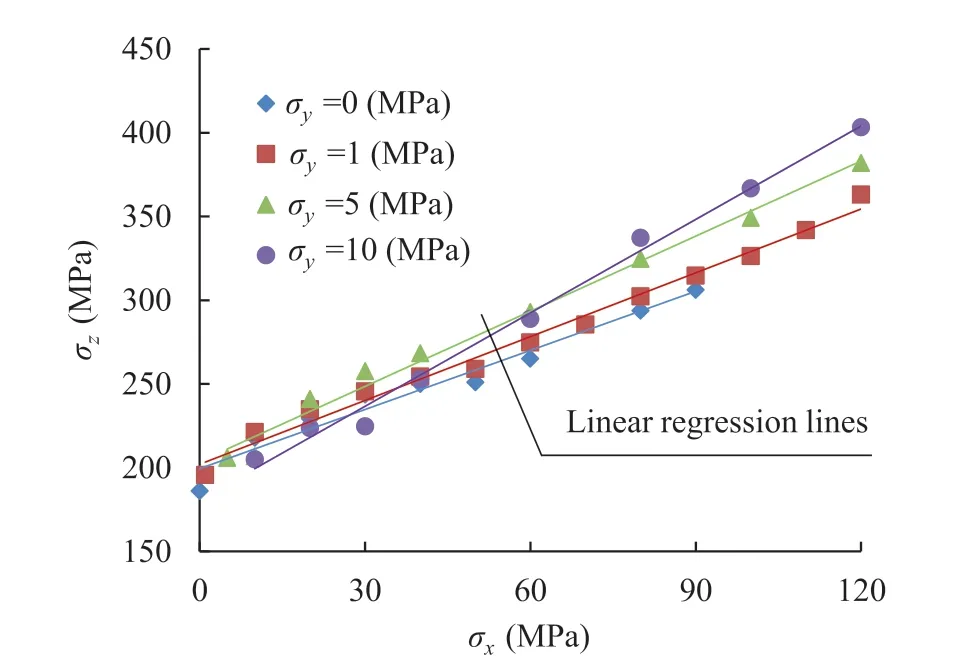
Fig.7.Linear relationships between intermediate stress σx and rock strength σz of the strainburst samples.
where the linear version is also known as the Mogi-Coulomb criterion (Al-Ajmi and Zimmerman, 2005).Moreover, Mogi (1967)proposed a criterion similar to Eq.(5),i.e.the Mogi(1967)criterion:
where βσ2is the component of the intermediate stress on the failure plane, which is related to the angle between the intermediate stress direction and the failure plane (Mogi, 1967).The experimental results demonstrated that the intermediate stress σ2affects rock strength, but its effect is less than the effect of the minimum stress σ3.Therefore,we have 0 ≤β ≤1.Similarly,there are also two versions when the Mogi (1967)criterion is used to fit the experimental data:
A comparison of the above two criteria yields a generalized form:
The physical meaning of Eq.(8)is that when brittle rock fails,as the normal stress on the failure fault plane increases, the shear stress increases, which is consistent with the nature of rock as a friction material(Al-Ajmi and Zimmerman,2005;Mogi,2007;You,2009).In the generalized form (Eq.(8)), the influence of the intermediate stress can be included either in τ or in σn;thus,there are the Mogi (1971) criterion (Eq.(4)) and the Mogi (1967) criterion(Eq.(6)).
For strainbursts,the rock(burst volume)is in a specific one-face free true triaxial state.The experimental results(Su et al.,2017a,b,c) indicate that the rock sample finally fails in a ternary failure pattern different from conventional true triaxial test results.The real cause of rock sample failure is still the formation of the macroshear fault plane, similar to the macro-shear fault plane in conventional true triaxial tests (Mogi, 2007).Therefore, it can be inferred that the strength criterion for strainburst samples should have a form similar to the Mogi criteria (Section 4.2).
Referring to the Mogi criteria and substituting σ1,σ2and σ3with σz, σxand σy, the corresponding parameters in Table 3 can be calculated.Fig.8 shows the fitting results of the strainburst data obtained by DEM simulations using the Mogi criteria.Both the linear and power-law versions of the Mogi(1971)and 1967 criteria fit the DEM simulation results well with high correlation.As the first step, we presented the DEM simulation results only to preliminarily verify the applicability of the Mogi criteria for strainbursts.The accuracy of the DEM simulation results needs to be verified by experiments, and further discussions on strainburst strength criteria are necessary.
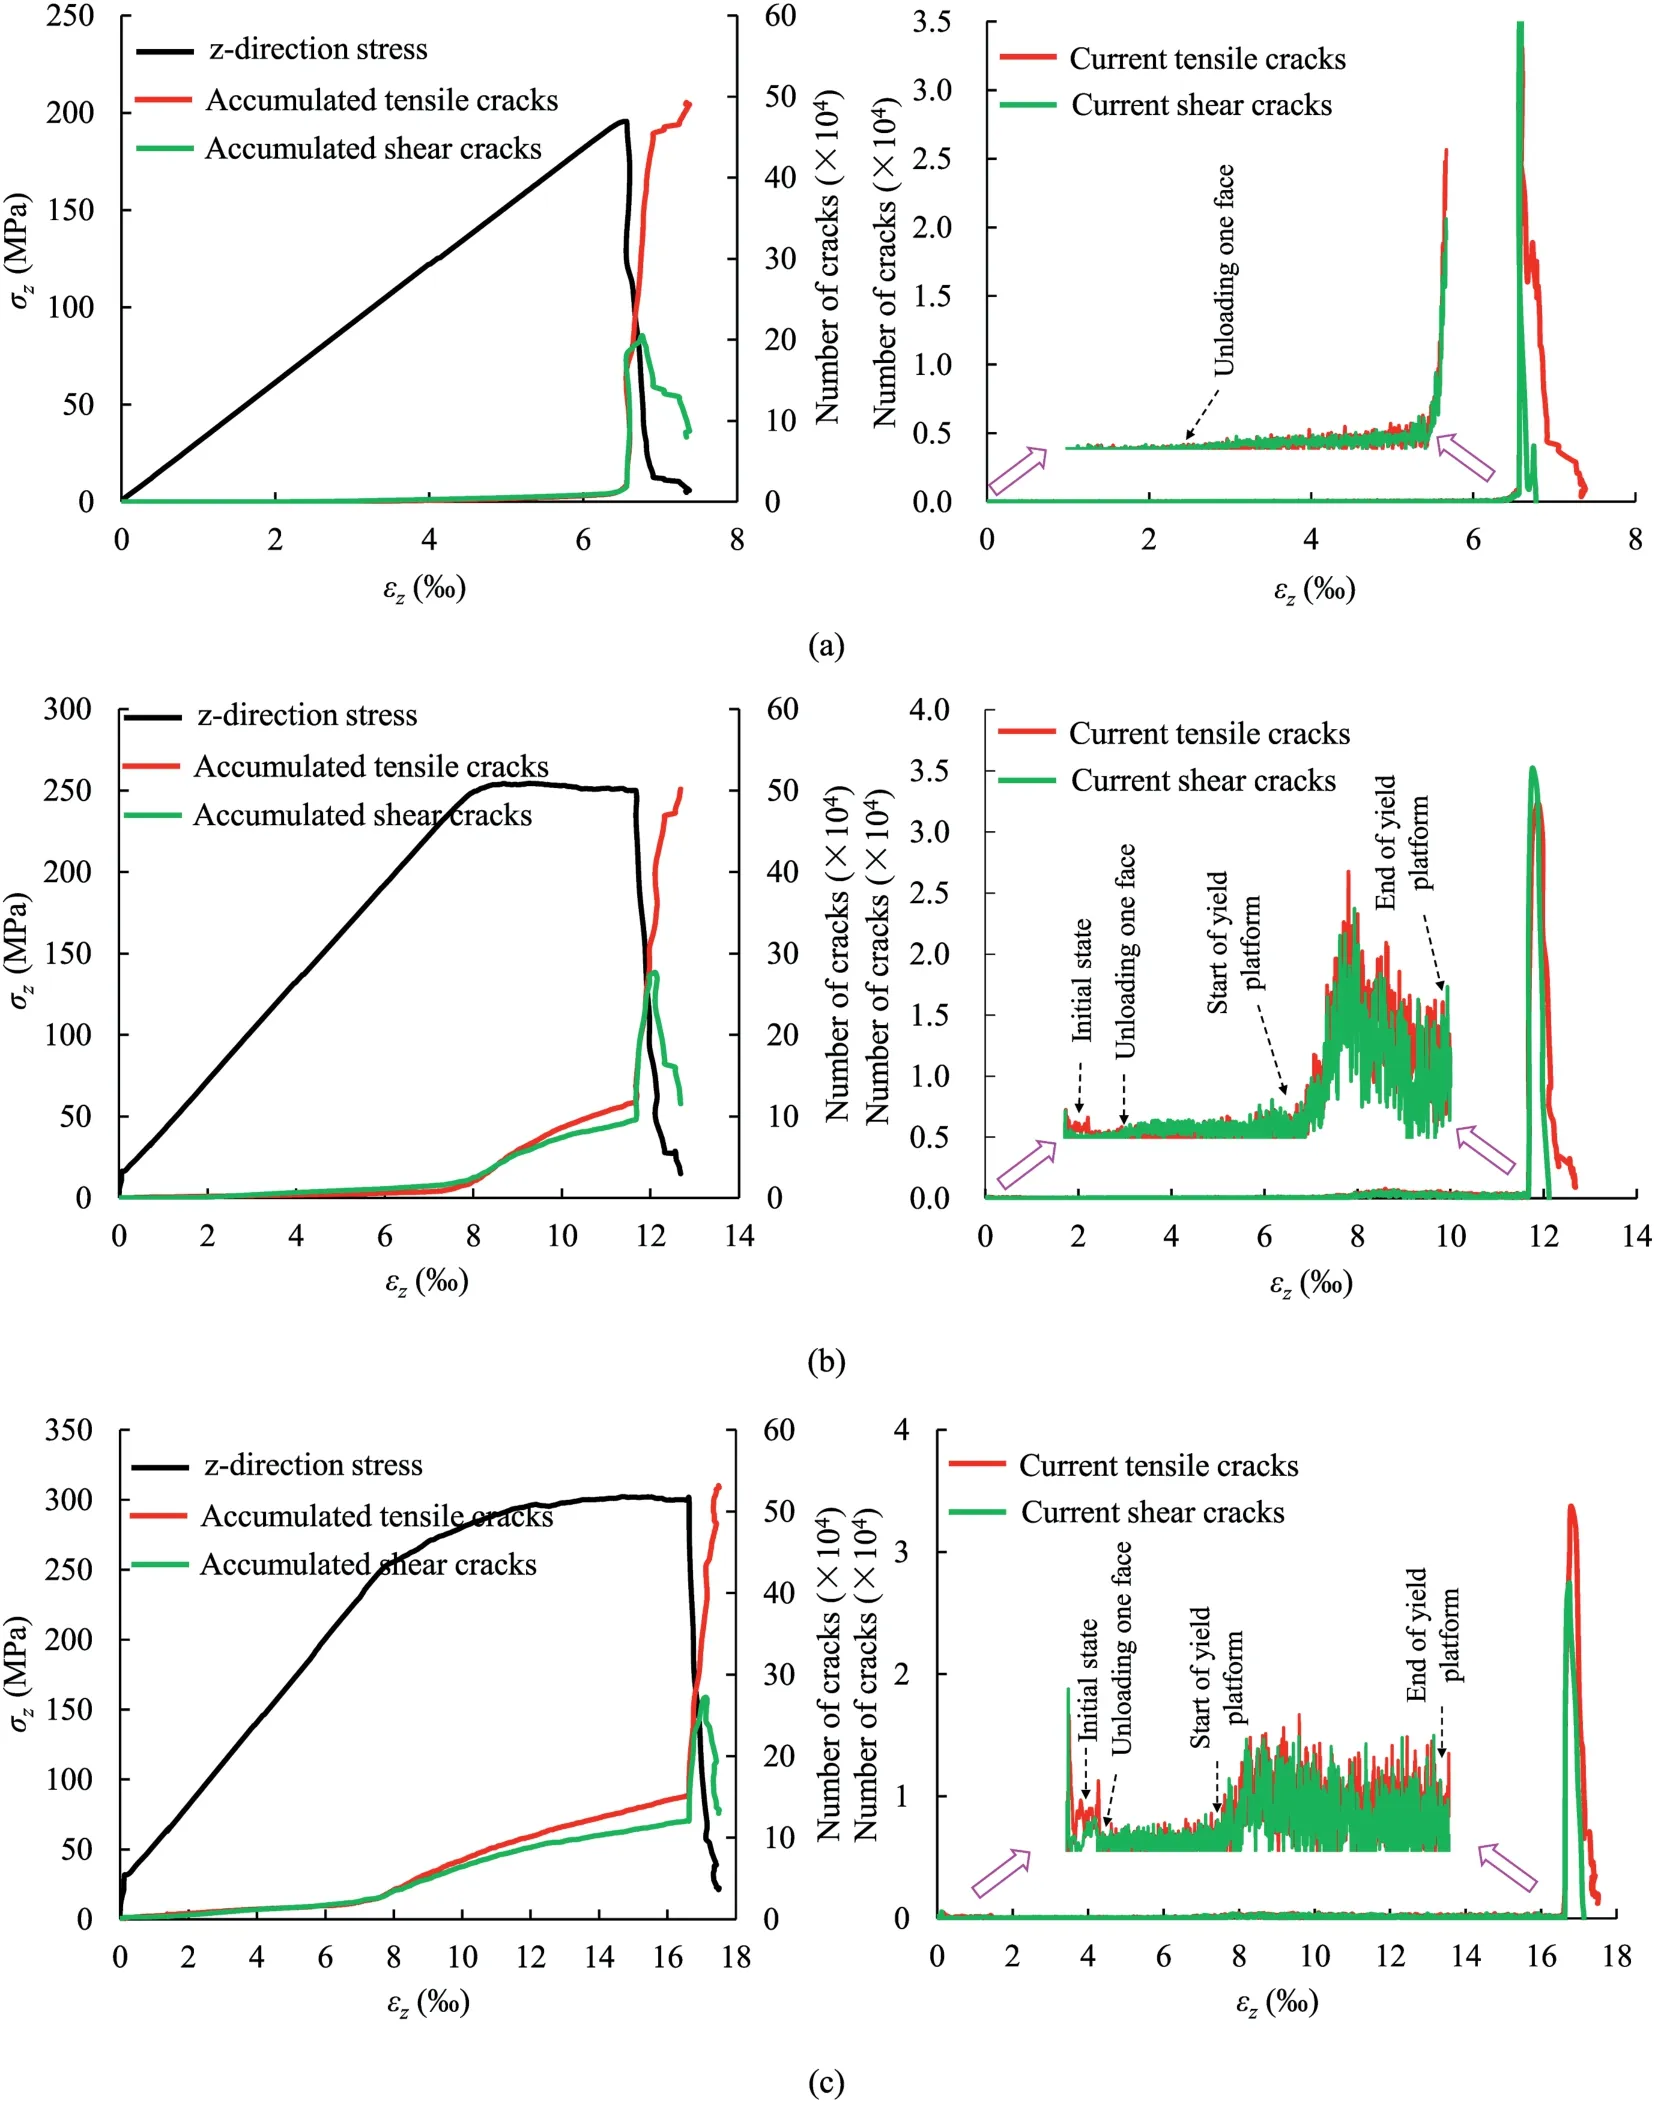
Fig.9.Evolutions of tensile and shear cracks during strainburst process under various intermediate stresses(illustrated along with three types of εz-σz curves):(a)σx=1 MPa;(b)σx = 40 MPa; and (c) σx = 80 MPa.
3.2.Effect of intermediate stress on the fracturing process and failure patterns of strainbursts
3.2.1.Effect on the fracturing process
3.2.1.1.Crack development.Studying crack development under different intermediate stresses is helpful for understanding the micro-mechanism of the effect of intermediate stress on strainbursts.Fig.9 depicts the tensile and shear crack development curves corresponding to the three types of εz-σzcurves.From the perspective of the cumulative crack development(the left graphs in Fig.9),tensile cracks generally develop earlier than shear cracks.In the situation of the Type I curve(Fig.9a),the number of cumulative tensile and shear cracks is very low until a sudden increase approaches the peak stress.In the situations of the type II(Fig.9b)and type III(Fig.9c)curves,the tensile and shear cracks develop slowly at a low rate prior to the yield platform; the development rate of tensile and shear cracks increases remarkably for the first time at the start of the yield platform.Then, during the yield platform stage,both tensile and shear cracks develop approximately linearly with high growth rates until approaching the peak stress, when their growth rates increase remarkably for a second time and the numbers of tensile and shear cracks increase substantially.In thepost-peak stage, the number of tensile cracks further increases while the number of shear cracks decreases.
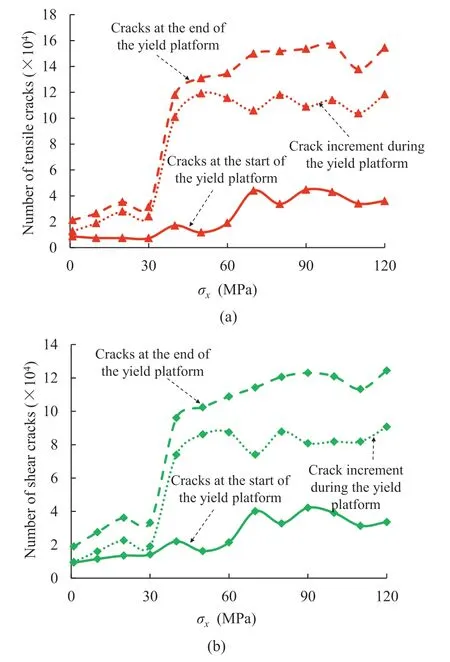
Fig.10.Effect of intermediate stress σx on crack development of strainbursts during the yield platform stage: (a) Development of tensile cracks, and (b) Development of shear cracks.
In view of crack development at the current calculation step(the right graphs in Fig.9),in the Type I curve(Fig.9a),the increment of tensile and shear crack numbers at per strain increment is very low until reaching the peak stress.In the Type II(Fig.9b)and III(Fig.9c)curves,tensile and shear cracks continue to develop from the initial true triaxial loading to the peak stress.The higher the initial true triaxial stress is, the more tensile and shear cracks are mobilised.From unloading of one single surface of the sample to the start of the yield platform,the number of newly initiated tensile and shear cracks is nearly the same, resulting in a relatively flat segment of the crack development curves.Then, during the yield platform stage,more tensile and shear cracks occur at each calculation step,and the number of tensile cracks is higher than the number of shear cracks, which results in an oscillating segment of the crack development curves.The above laws about the crack development of strainbursts are basically consistent with the previous acoustic emission (AE) monitoring results (He et al., 2010).
Fig.10 shows the effect of intermediate stress on the development of the tensile and shear cracks during the yield platform stage.When the intermediate stress is relatively low(σx≤30 MPa),as the intermediate stress increases, the tensile fracture number decreases slightly while the shear fracture number increases slightly at the start of the yield platform, and both the tensile and shear crack numbers increase slightly at the end of the yield platform.When the intermediate stress is high (σx>30 MPa), as the intermediate stress increases,both the tensile and shear crack numbers increase slightly at the start of the yield platform, and both the tensile and shear crack numbers increase significantly at the end of the yield platform.
It is likely that the intermediate stress can significantly affect the crack development of strainbursts, that is, facilitate the development of tensile and shear cracks.This scenario is also observed in the strainburst experiments (Su et al., 2017b; Zhao et al., 2021).In particular,as the intermediate stress increases,the characteristic of rapid growth of tensile and shear cracks on the eve (i.e.the yield platform stage) of strainbursts is more obvious; that is, the precursor information of strainbursts is enhanced.The reasons that the intermediate stress contributes to the crack development of strainbursts are as follows: the relatively high intermediate stress prevents the wing wrapping and self-arrest of 3D cracks that exist in uniaxial compression,thus allowing the cracks to develop to an extent sufficient to split the rock sample(Wang et al.,2018,2020).
3.2.1.2.Spatial fracturing process.In strainburst experiments,highspeed cameras are usually used to capture the spatial fracturing process of strainbursts.Similarly, in the DEM simulations, we also reproduced the spatial fracturing process of strainbursts (Fig.11),consistent with the spatial fracturing process captured by highspeed cameras (Su et al., 2017a, b, c).As illustrated in Fig.11, the effect of the intermediate stress on the spatial fracturing process of strainbursts is as follows: the higher the intermediate stress, the greater the number and the longer the length of the vertical cracks that are near the free face and parallel to the maximum stress direction,and the more these cracks will propagate,resulting in more and larger rock slabs that are prone to buckling.Therefore, as the intermediate stress increases, the slabbing and buckling phenomena of strainbursts are more obvious.
3.2.2.Effect on failure patterns
Experiments(Su et al.,2017a,b,c;Zhao et al.,2021)have shown that the rock sample after strainbursts is in a complex ternary failure pattern, i.e.slabbing near the free face, V-shaped rockburst pit,and macro-shear faulting far away from the free face.Slabbing is caused by the full propagation of cracks near the free face under the condition of low confinement(Hu et al.,2021).These split rock slabs will buckle and break off as the load increases.Then,once the burst occurs, abundant elastic energy is released abruptly, which carries the broken rock slabs and rock fragments towards the free face, forming a V-shaped rockburst pit.Therefore, slabbing occurs prior to burst and the rockburst pit is formed after the burst, and both are local damage but not the real cause of a strainburst.The ultimate cause of a strainburst is the formation of the macro-shear fault plane away from the free face (Hu et al., 2020, 2021).This assumption can actually be supported by the Mogi criteria being suitable to fit the strength data of strainbursts (Sections 3.1.2 and 4.2).
To study the effect of the intermediate stress on the failure pattern of strainbursts, we compared the pre-peak failure pattern of the samples at the end of the yield platform under different intermediate stresses (Fig.12).As the intermediate stress increases,the expansion of the sample along the minimum stress (y-direction) increases significantly.In case of low intermediate stress(Fig.12a),there is no obvious damage in the pre-peak stage.As the intermediate stress increases, the cracks on both sides of the sample in y-direction are fully mobilised along z-direction,forming persistent vertical cracks and splitting the sample into rock slabs.These slabs become longer and are more prone to buckling.Therefore, with increase of the intermediate stress, the pre-peak failure pattern of the sample changes from no obvious failure to slabbing and then to buckling, showing increasing precursor information of strainbursts.

Fig.11.Simulated spatial fracturing processes of strainbursts under various intermediate stresses, where red denotes the ejected blocks (illustrated with three typical types): (a)σx = 1 MPa; (b) σx = 40 MPa; and (c) σx = 80 MPa.
3.3.Effect of intermediate stress on the energy balance of strainbursts
A strainburst is a process of energy balance and conversion of the burst volume-surrounding rock system(Wang et al.,2020).An important feature that distinguishes strainbursts from conventional rock failures is the violent and abrupt energy release.Therefore, it is helpful to understand the intermediate stress influencing mechanism on strainbursts and to evaluate the intensity of strainbursts by examining the energy balance of strainbursts under different intermediate stresses.The energy balance of strainbursts includes two situations, i.e.the pre-peak and postpeak energy balances.At a moment T0prior to burst, the energy balance can be expressed as
where Utotalis the total energy absorbed by the sample, Ueis the stored elastic energy (Eq.(2)), Udis the dissipated energy in the pre-peak, and V is the volume of the rock sample.At this stage,most of the energy absorbed by the sample is stored in a form of elastic energy.
Once a strainburst occurs, the elastic energy stored in the loading system(surrounding rock)will be released and exerted on the sample.At the moment TBthat a strainburst is finished,the rock sample reaches its residual strength, and the energy balance is
where ULS=is the energy released by the loading system;Ap, lpand Epare the cross-sectional area, length and elastic modulus of the upper loading platen,respectively;Uer=V is theresidual strain energy, andσzris the residual stress; and Ukis the kinetic energy of the ejected fragments (Eq.(3)).

Fig.11.(continued).
According to Eq.(10), Fig.13 shows the evolution of the stored elastic energy and the released kinetic energy of the ejected fragments under different intermediate stresses.Under different intermediate stresses,the evolution laws of the stored elastic energy and the released kinetic energy are similar.That is,as the strain in z-direction (i.e.load) increases, the stored elastic energy increases gradually until the burst occurs,and then the stored elastic energy decreases sharply to a very low value at burst.The released kinetic energy increases abruptly to a high value at the moment of a sharp decrease in the elastic energy.
Fig.14 presents the effect of the intermediate stress on the total elastic energy (Ue+ ULS), dissipated energy (Ud), and released kinetic energy (Uk) of strainbursts.As the intermediate stress increases, both the total elastic energy and the dissipated energy increase approximately linearly (Fig.14a), but the released kinetic energy increases approximately exponentially(Fig.14b),similar to the experimental results reported by Zhao et al.(2021).Therefore,according to Fig.14, as the intermediate stress increases, the strainburst process satisfies the linear energy storage law (Gong et al., 2019).Meanwhile, the strainburst intensity increases significantly.
4.Discussion
4.1.Effect of intermediate stress on rock strength of strainbursts
Previous studies(Su et al.,2017b;Wang et al.,2021b;Zhao et al.,2021) as well as the DEM simulation results show that the intermediate stress has an important effect on the stress-strain response, fracturing process and energy balance of strainbursts.Although the limited reported experimental results (Su et al.,2017b; Zhao et al., 2021) show that, as the intermediate stress increases, the rock strength of strainbursts first increases and then decreases,the DEM simulation results presented in this study show that the rock strength of strainbursts increases approximately linearly with increasing intermediate stress (Fig.7).It seems to be contradictory.However,according to the analysis by the authors,to fully understand the effect of intermediate stress on the rock strength of strainbursts, there are three key issues that need to be addressed:(i)What is the rock strength of strainbursts?(ii)In what range does the intermediate stress of the rock mass near the excavation boundary (i.e.the burst volume) vary? (iii) How accurate is the measurement of rock strength in the above strainburst experiments?
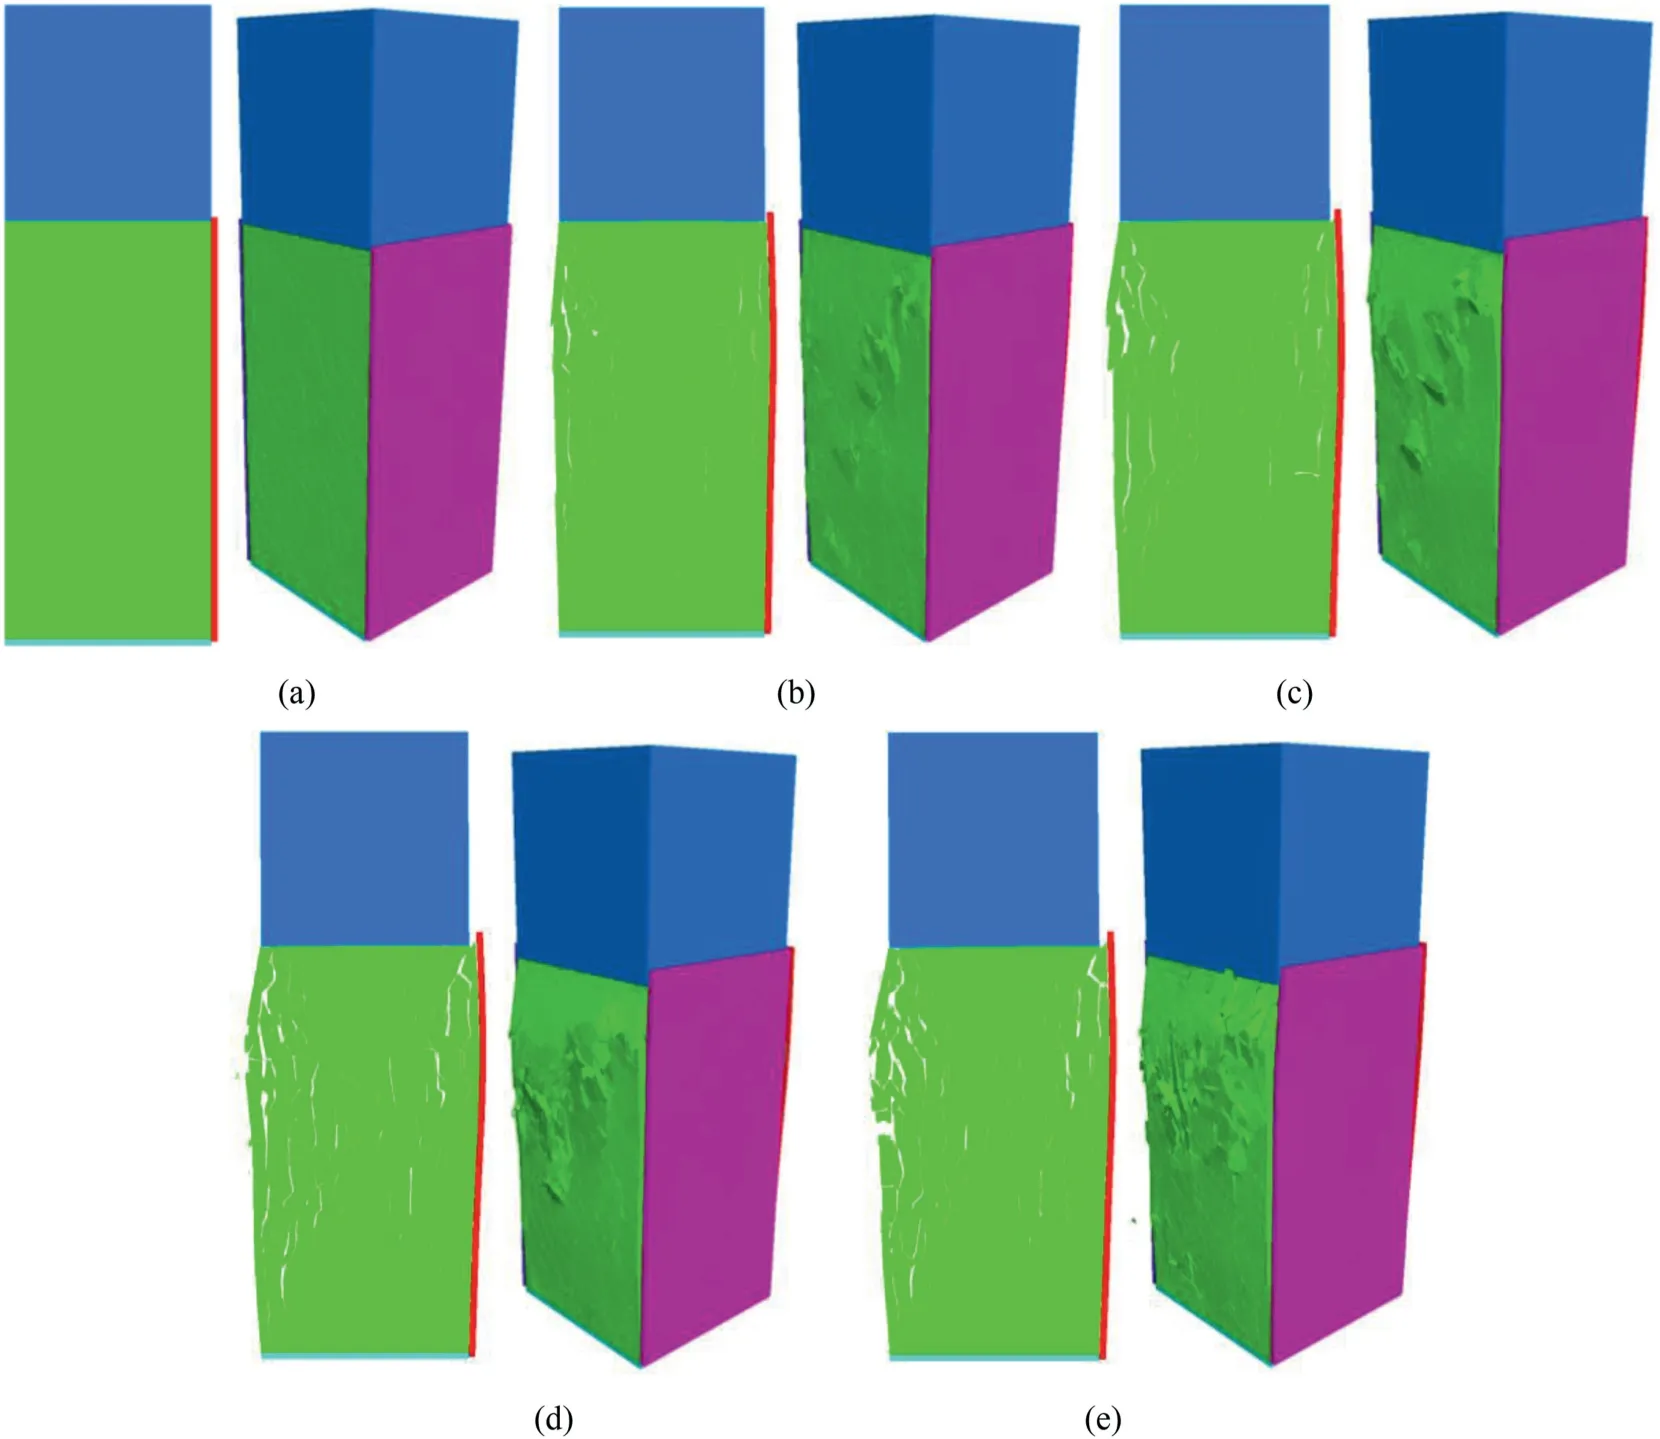
Fig.12.Effect of intermediate stress on pre-peak (at the end point of the yield platform) failure patterns of strainbursts: (a) σx = 1 MPa; (b) σx = 40 MPa; (c) σx = 60 MPa; (d)σx = 80 MPa; and (e) σx = 120 MPa.
(1) The rock strength of a strainburst should actually be the bearing capacity of the burst volume (Section 3.1.2).In the above strainburst experiments (Su et al., 2017b; Zhao et al.,2021), the maximum stress on the stress-strain curve is taken as the rock strength of strainbursts.However, in a previous work,the authors pointed out that it is not suitable to use the term ‘stress-strain’ for a strainburst considering the structural feature of strainbursts(Hu et al.,2021)because the stress field of a rock sample in strainburst experiments is extremely nonuniform.To this end, the authors defined the rock strength of strainbursts as the nominated stress converted from the bearing capacity of the rock sample (Hu et al., 2021).Then, the effect of the radial stress on the rock strength of strainbursts is analysed by considering the end friction effect,radial stress strengthening effect,and buckling weakening effect.Similarly, Su et al.(2017b) qualitatively discussed the effect of intermediate stress on the rock strength of strainbursts from the perspective of the Poisson effect and the end friction induced constraint effect.However, in the strainburst experiments conducted by Su et al.(2017b) and Zhao et al.(2021), the intermediate stress can be up to 120 MPa, which brings about the following issue.
(2) A strainburst is caused by the unfavourable mechanical environment of the rock mass near the excavation boundary.After excavation, due to redistribution of stresses, the rock mass near the excavation boundary will be in a specific polyaxial stress state of high maximum (tangential) stress,moderate intermediate (tunnel axial) stress, and very low minimum (radial) stress (Kaiser et al., 2000; Diederichs,2003; Cai and Kaiser, 2014; Gao et al., 2018 2020; Hu et al.,2021).Statistical analysis of the initial in situ stress of many typical deep rock engineering projects shows that the intermediate stress usually ranges from 10 MPa to 60 MPa(Vernik and Zoback,1992;Martin,1997;Haimson and Chang,2000;Cai,2008;Haimson et al.,2010;Zhang et al.,2012;Cai and Kaiser, 2014; Wang et al., 2021a).For example, the intermediate stress of the Canadian Underground Research Laboratory (URL) Mine-by test tunnel is 45 MPa.How does the intermediate stress affect rock strength when it varies in this range? The theoretical analysis of Wiebols and Cook(1968) (Fig.15a) and the numerical calculation results of Cai(2008)(Fig.15b)have shown that when the intermediate stress is not very high, the intermediate stress does have a linear enhancing effect on rock strength.There are also many true triaxial test data available in the literature (Michelis,1985; Chang and Haimson, 2000; Haimson and Chang,2000, 2002; Al-Ajmi and Zimmerman, 2005; Mogi, 2007;You, 2009; Gao and Stead, 2014; Wang and Cai, 2018).We selected the true triaxial test data under the condition that the intermediate stress is not very high and the minimum stress is very low (i.e.the stress condition of the nearboundary rock mass undergoing strainbursts) and plot them in the σ2-σ1domain(Fig.15c-f).For hard brittle rocks,the intermediate stress basically has a linear enhancing effecton rock strength.Specifically, for strainbursts, we selected the data with moderate intermediate stress from these above strainburst experiments (Su et al., 2017b; Zhao et al., 2021)and plotted them in the σx-σzdomain(Fig.15g).The results also demonstrate that the intermediate stress has an approximately linear enhancing effect on the rock strength of strainbursts.Surely, existing research results have shown that when the intermediate stress exceeds an appreciable value, the rock strength will indeed reach a peak value and then decrease(Haimson and Chang,2000;Mogi,2007;You,2009;Pan et al.,2012;Faizi et al.,2020;Feng et al.,2020).We calculated the ratio of the intermediate stress to the rock strength at which the rock strength reached its peak value from the literature and depicted them in Fig.16.For most tested hard rocks,this ratio is roughly between 35%and 60%,whereas this ratio for strainbursts is 30.2% and 31.7% according to the experimental results of Su et al.(2017b) and Zhao et al.(2021), respectively.Moreover, although the mechanical properties of the rocks used in the strainburst experiments performed by Su et al.(2017b) and Zhao et al.(2021) are different (e.g.the UCS is 114 MPa and 172 MPa,respectively), the rock strength of strainbursts reaches its peak value when the intermediate stress is approximately 80-90 MPa for both experiments.
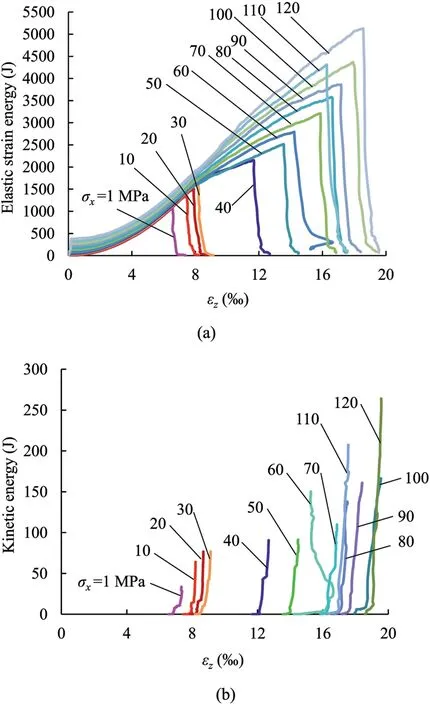
Fig.13.Evolutions of the stored elastic energy and released kinetic energy of the ejected rock fragments of strainbursts under various intermediate stresses σx: (a)Elastic strain energy and (b) Kinetic energy.

Fig.14.Effect of intermediate stress σx on energy balance of strainbursts: (a) Total elastic energy and dissipated energy; and (b) Released kinetic energy of the ejected rock fragments.
(3) Even if the intermediate stress can be up to 120 MPa as adopted in these above experiments, the rock strength they measured may not be accurate because when the intermediate stress is high, the cracks in the sample have fully developed prior to burst,the slabbing and buckling scenarios near the free face are obvious, and there are even rock fragments (Su et al., 2017b; Zhao et al., 2021) (Fig.17).However, the researchers adopted a loading method for the maximum(z-direction)stress,as illustrated in Fig.17;that is,the lower end of the sample is pushed by an oil cylinder,the upper end is in contact with a fixed frame, and the experiments are performed with a load-controlled manner.Then,when the intermediate stress is high, the upper loading platen rotates slightly before bursting, and the contact area between the loading platen and the rock sample is reduced,resulting in the measured strength being actually the strength of the part of the rock sample in contact with the loading platen,but not the true strength of the rock sample.That is, when the intermediate stress is high, the measured rock strength in these strainburst experiments is an underestimated apparent rock strength of strainbursts.This experimental error may be properly improved by adopting a displacement/velocity controlled loading method (as in our DEM simulations), and further experimental verification is needed.
It seems that the mechanism of the effect of intermediate stress on the rock strength of strainbursts is very complicated.When the above three key issues are addressed, the effect of intermediate stress on rock strength of strainburst can be fully understood: (i)the rock strength of strainbursts is regarded as the bearing capacityof the burst volume, (ii) the intermediate stress varies in a moderate range,(iii)the experimental measurement is accurate.Based on the above analyses,it can be conclusive that as the intermediate stress increases, the rock strength of strainbursts increases approximately linearly.

Fig.15.Research results showing the approximate linear law of the effect of intermediate stress on rock fracture and strainbursts when the intermediate stress is moderate,where σc is the uniaxial compressive strength(UCS),and μ is the frictional coefficient:(a)analytical analysis performed by Wiebols and Cook(1968),(b)numerical results obtained by Cai(2008),(c)and(d)true triaxial experimental results obtained by Mogi(2007),(e)true triaxial experimental results obtained by Michelis(1985,1987),(f)true triaxial experimental results obtained by Takahashi and Koide (1989), and (g) true triaxial experimental results of strainbursts (Su et al., 2017b; Zhao et al., 2021).
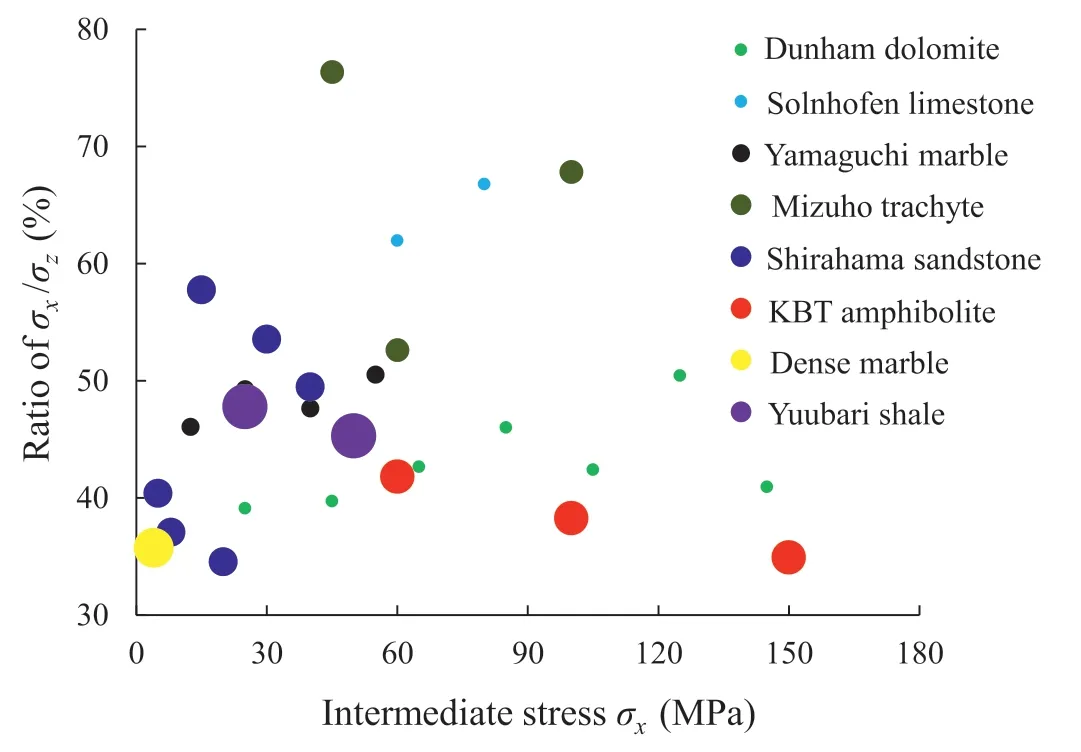
Fig.16.The ratio of intermediate stress to strength (i.e.σx/σz) when the strength reaches its peak value, where circles with different size and colour denote different types of rocks (Al-Ajmi and Zimmerman, 2005; Mogi, 2007).
4.2.True triaxial strength criteria for strainbursts
The purpose of studying the strainburst mechanism is to reasonably evaluate the tendency of strainbursts and accurately predict the intensity of strainbursts.Then, reasonable strainburst criteria are necessary.In terms of strength, a strainburst occurs when the stress of the burst volume reaches its bearing capacity(strength).Thereby,we can establish strainburst criteria in terms of stress and strength,which is also the basic idea of the widely used empirical strainburst criteria(Wang et al.,2021a;Zhou et al.,2018).For example,the ratio of the maximum tangential stress to the UCS of the rock is widely used as an indicator for estimating strainburst intensity.However, the UCS used in the empirical strainburst criteria cannot truly reflect the strength feature of the burst volume.Therefore, it is of great significance to construct criteria that can realistically reflect the strength feature of the burst volume,which is named as the strength criteria of strainbursts.Existing research results have shown that there are many similarities between strainbursts and failure of rock subjected to true triaxial compression(He et al.,2007,2010,2012a,b,c,2020,2021;Su et al.,2017b,c;Wang et al.,2021b;Zhao et al.,2021).Then,are there any strength criteria of strainbursts similar to the strength criteria of rock under true triaxial compression? As the empirical strength criteria proposed by Mogi, Haimson and Chang, etc., are widely used, we will discuss the method of constructing strength criteria for strainbursts based on the Mogi criteria.
Based on observations of numerous true triaxial experiments,Mogi(1967,1971,2007)found that the fracture of hard rocks under true triaxial compression occurs by shear faulting.By analysing the compositions of the normal stress and shear stress on the fault plane, Mogi established mathematical forms for the strength criteria.Under the conditions of strainbursts, although the rock samples exhibit a so-called ternary zoning failure mode, as shown in Fig.21(Su et al.,2017b,c;Hu et al.,2020,2021),the formation of the macro-shear faulting dictates the occurrence of strainbursts(Hu et al.,2020,2021).Therefore,the rock strength of strainbursts and rock strength under true triaxial compression should follow a similar law.
Different from the relatively homogeneous stress state of rock under conventional true triaxial compression, the burst volume is in a one-face free true triaxial stress state (Su et al., 2017b, c; Hu et al., 2021).In particular, the radial (minimum) stress σyacts asymmetrically on a boundary surface of the rock sample(Hu et al.,2021).The stress field of the rock sample(Su et al.,2017c;Hu et al.,2021) reveals that the radial stress σyis approximately linearly distributed.Since the radial stress is very low, it is assumed to be distributed uniformly with a value of σ*y= 1/2σyin the rock sample.Then, we have an equivalent true triaxial stress state of strainbursts with σx,σ*y= 1/2σyand σz.The equivalent true triaxial stress data for strainbursts corresponding to the numerical results presented in this study and the experimental results obtained by Su et al.(2017b) are listed in Tables 4 and 5, respectively.
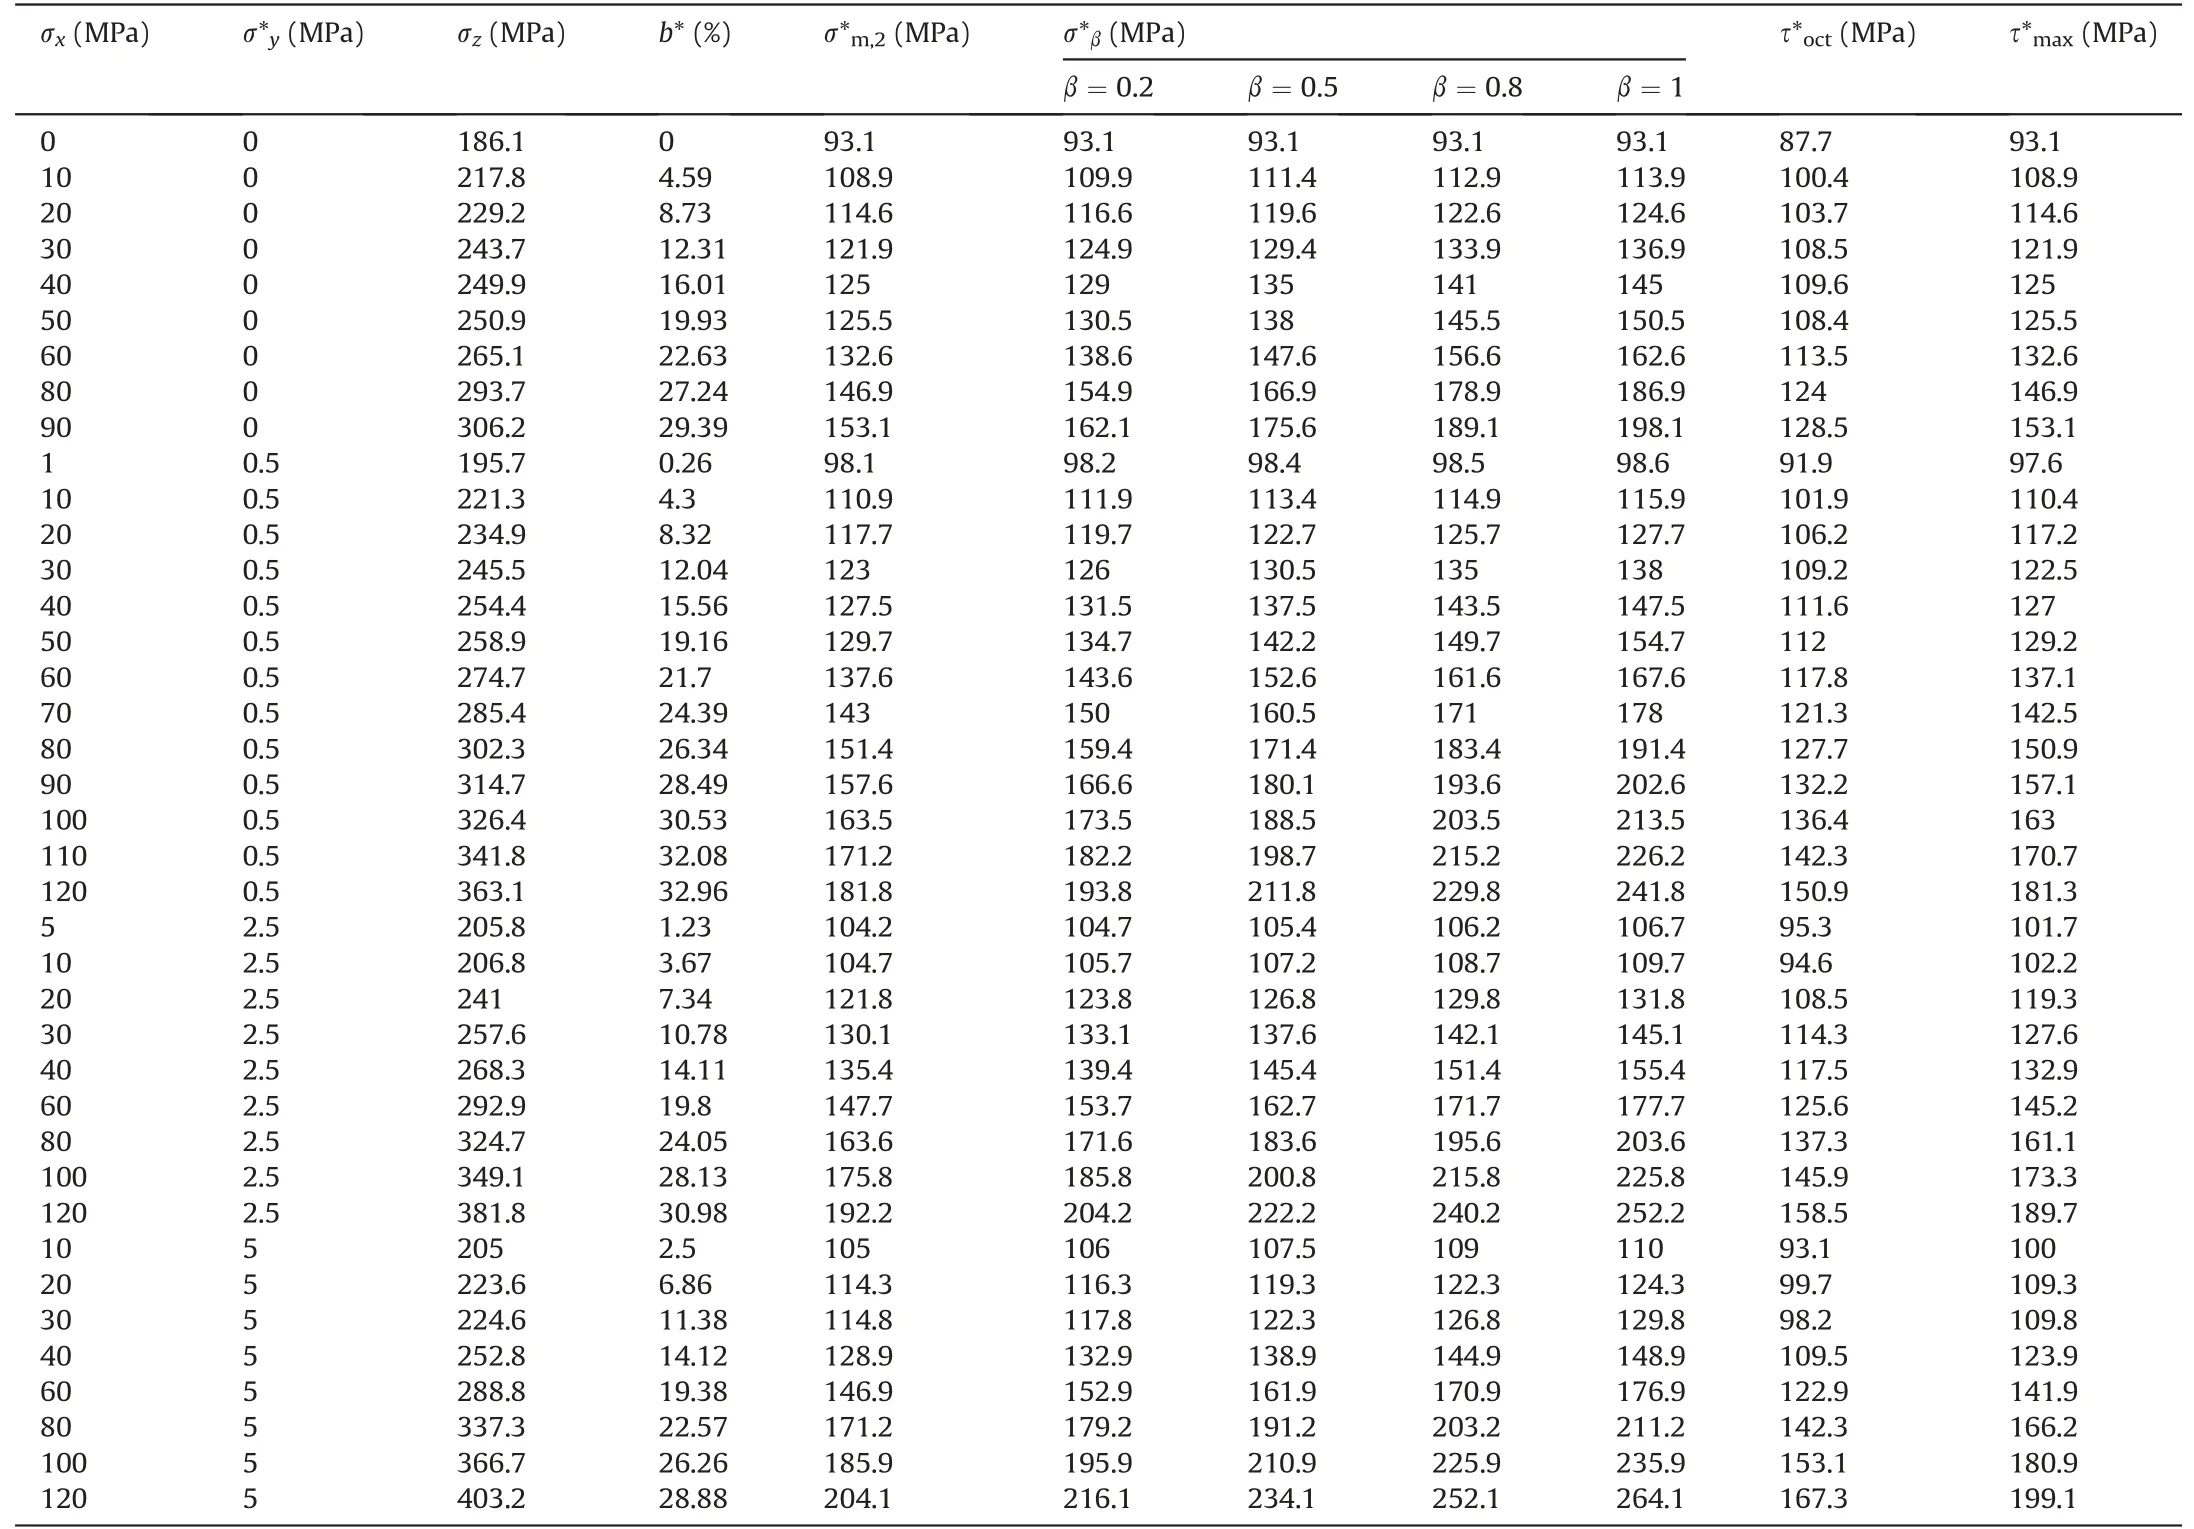
Table 4Equivalent true triaxial stress state of strainbursts with σ*y = 1/2σy obtained by DEM simulations.

Table 5Equivalent true triaxial stress state of strainbursts with σ*y = 1/2σy calculated from the experiments performed by Su et al., (2017b).

Fig.17.Analysis of the true triaxial strainburst experiments under high intermediate stress:loading apparatus and method(Su et al.,2017b),(b)failure pattern of red granite sample with intermediate stress of 110 MPa(Su et al., 2017b), (c) failure pattern of Beishan granite sample with intermediate stress of 120 MPa(Zhao et al., 2021), and (d) loading platen rotation and reduction of effective loading face.
Once the equivalent true triaxial stress state of a strainburst is obtained, the Mogi criteria are used to fit both the numerical and the experimental results (Figs.18 and 19).The Mogi criteria can indeed fit these equivalent true triaxial stress data well, and the imitative effect is better (i.e.with higher R2) than the imitative effect presented in Section 3.1.2, where the specific one-face free true triaxial stress state of strainbursts is ignored.
Therefore,the Mogi criteria can be used as the strength criteria for strainbursts provided that the specific one-face free true triaxial stress state of a strainburst is converted into its equivalent true triaxial stress state.For practical applications, the empirical strength criteria should be related to the specific rock types.The granodiorite used in our simulations(Hu et al.,2020,2021)and the granite used in the experiments performed by Su et al.(2017b)are hard brittle rocks with similar mechanical properties.Then, we determined the parameters of the strength criteria for strainbursts of these hard rocks by incorporating both the numerical and experimental results(Fig.20).According to Fig.20,when the Mogi(1971) criterion is applied to strainbursts, we have
When the Mogi (1967) criterion is applied to strainbursts, the best result is obtained with β = 0.2:
The parameter β in the Mogi (1967) criterion can be calculated according to the angle θxbetween the failure fault plane and the intermediate stress(x) direction(Mogi,1967):
Fig.21 illustrates the estimation of θxfor the strainburst samples.The results show that θxranges from 5°to 15°, and β ranges from 0.10 to 0.26.Therefore,it is reasonable that β takes an average value of 0.2 for strainbursts in the strength criterion (see Eq.(12))for the studied hard rocks.
4.3.Potential applications of the true triaxial strength criteria of strainbursts
Current strainburst criteria usually assess tendency of strainbursts and predict intensity of strainbursts based on the stress andstrength of rock elements.Despite the simple and convenient operation, the empirical strainburst criteria cannot reasonably consider the stress conditions, strength characteristics and energy source of the burst volume, resulting in experience dependence and poor accuracy (Zhou et al., 2018).Based on the true triaxial strength criteria of strainbursts(see Section 4.2),we discussed the methods of assessing tendency of strainbursts and estimating intensity of strainbursts in practical engineering.However, we have established the strength criteria for strainbursts based on the Mogi criteria considering the equivalent true triaxial stress state of strainbursts(i.e.Eqs.(11)and(12)).There are still some limitations.On one hand, the operation of converting into the equivalent true triaxial stress state ignores the influence of the inhomogeneity of the stress field in the rock sample caused by the friction between the sample and the loading platens (i.e.the end effect) (Su et al.,2017c; Zhao et al., 2021).On the other hand, whether in the numerical simulations or the experiments, rock samples with relatively small scales are used to represent the burst volume,and the geometric effect (e.g.the aspect ratio and the size effect) of the samples should be considered.Therefore, the end effect and the rock sample geometric effect should be considered to further improve the strength criteria of strainbursts:
where g(·) and f(·) are the functions, and f(·) denotes theσz~f(σx,σ*y) relation derived from the initial strength criteriapresented in this study (i.e.Eqs.(11) and (12)); S is a parameter related to the geometric effect; and ημ, ηGand ηLSSare the correction coefficients for the initial strength criteria considering the end effect, geometric effect and the LSS effect, respectively.

Fig.18.Fitting the numerically calculated strength data of strainbursts with equivalent minimum stress σ*y = 1/2σy, using Mogi’s true triaxial strength criteria: (a) Linear and power-law versions of Mogi (1971) criterion; (b) Linear version of Mogi (1967) criterion; and (c) Power-law version of Mogi (1967) criterion.
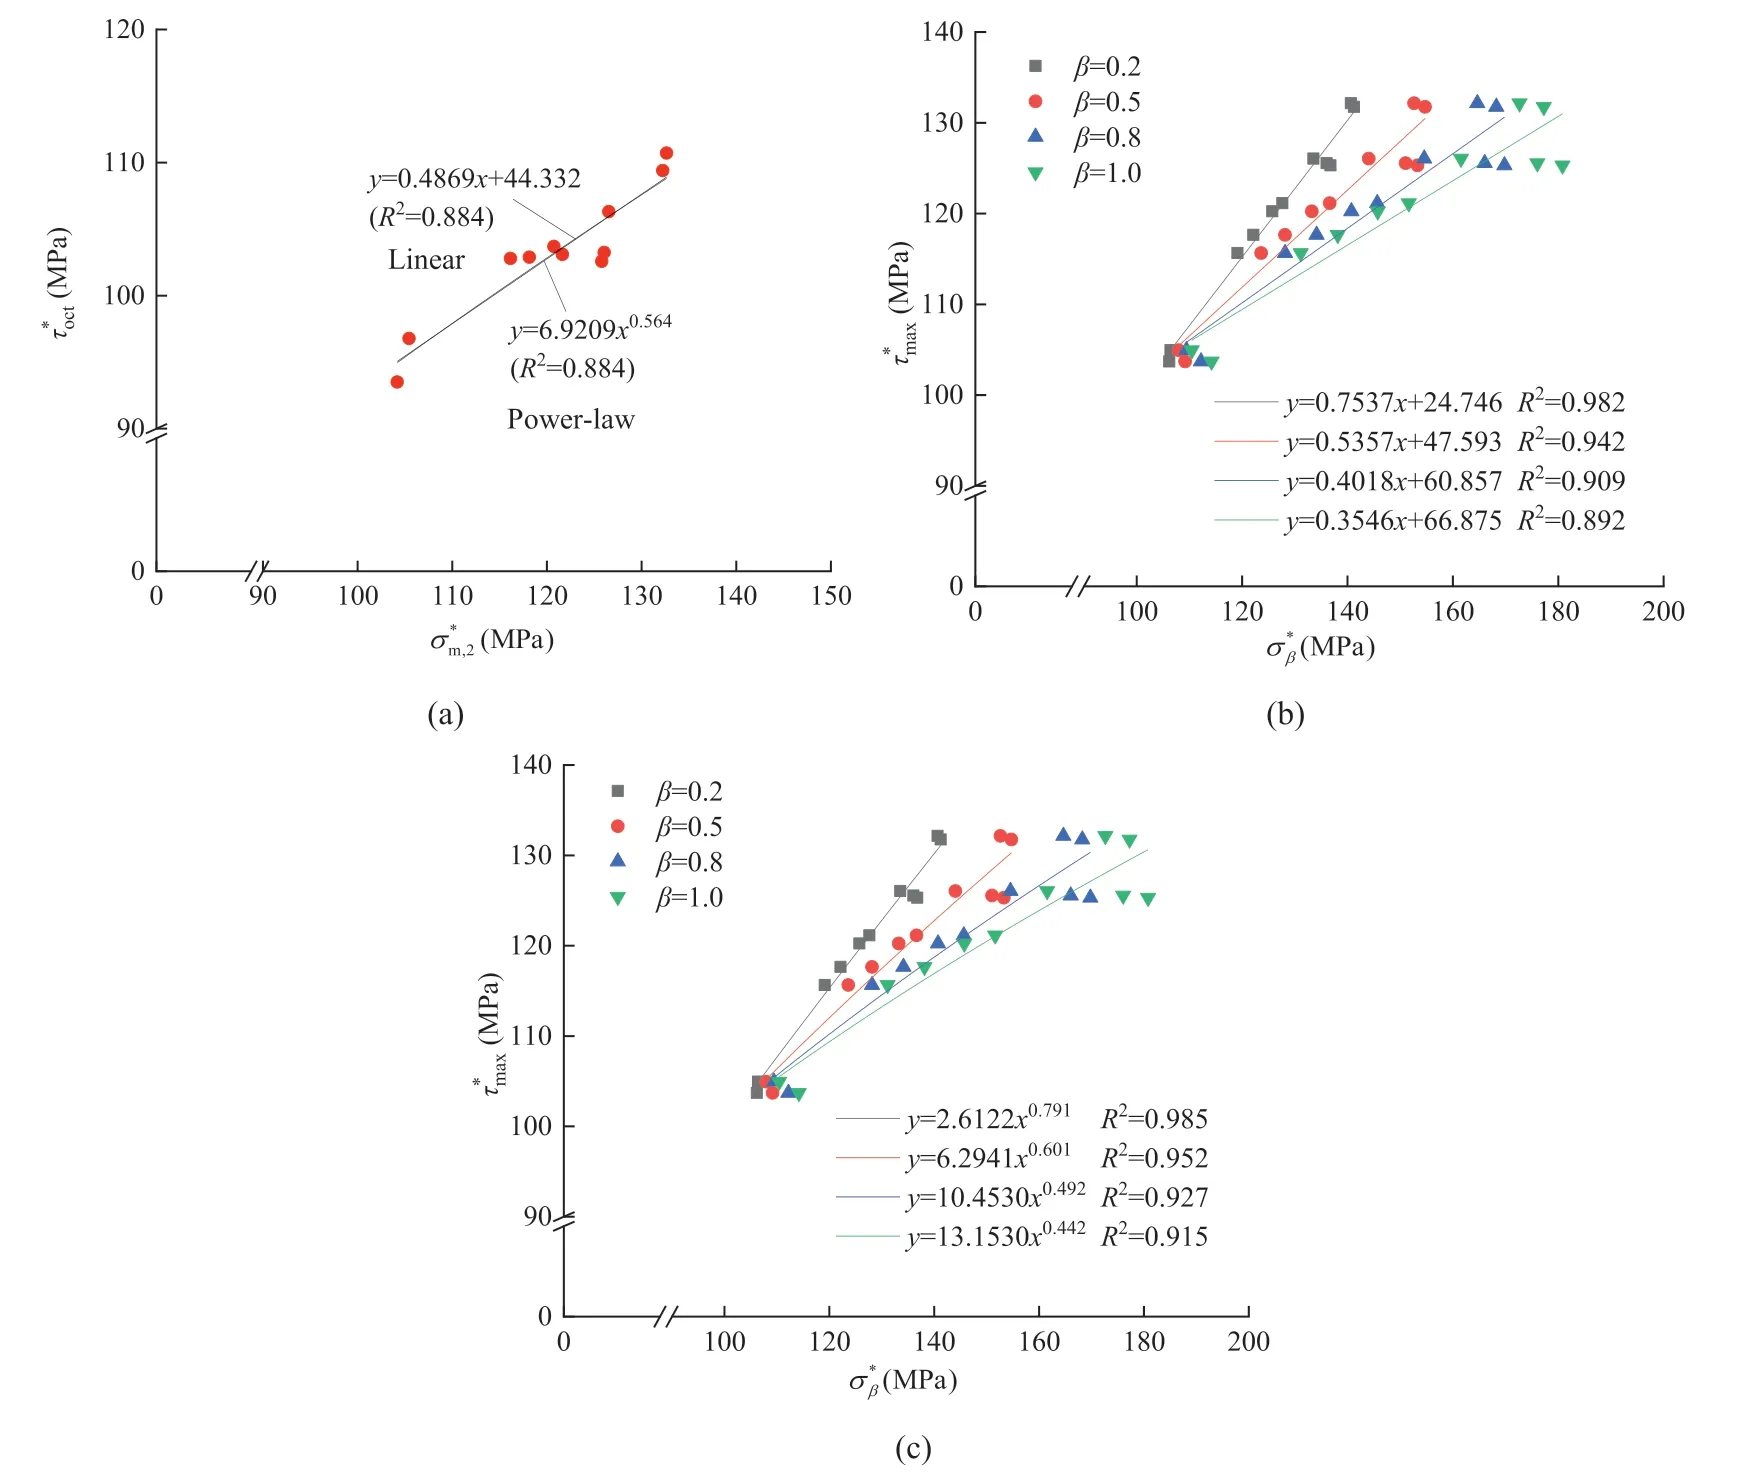
Fig.19.Fitting the true triaxial experimental results of strainbursts obtained by Su et al.(2017b) using Mogi’s true triaxial strength criteria: (a) Linear and power-law versions of Mogi (1971) criterion; (b) Linear version of Mogi (1967) criterion; and (c) Power-law version of Mogi (1967) criterion.
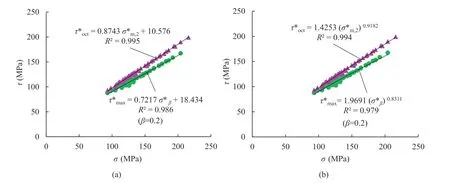
Fig.20.True triaxial strength criteria for strainbursts modified from Mogi’s criteria incorporating the numerical and experimental results: (a) Linear strength criteria, and (b)Power-law strength criteria.
During the excavation of deep engineering, the parameters required by Eq.(14)can be obtained through analysis of the initial in situ stress field, in situ monitoring and laboratory rock mechanics tests.Then,with the measured in situ maximum tangential stress σθof a deep tunnel, the strainburst tendency can be estimated with the commonly used stress-to-strength ratio method (Zhou et al., 2018):
where PBis the probability of a strainburst and γ is an empirical parameter considering the in situ complexity that can bedetermined with strainburst case histories.Eq.(15) gives the probability of strainbursts when the measured in situ maximum tangential stress approaches the strength of the burst volume estimated from the strength criterion (i.e.Eq.(14)), which is a necessary condition for strainbursts.Whether a strainburst would occur or not and how strong it could be are related to the energy released by the surrounding rocks (i.e.the loading system).In a strainburst, the energy released by surrounding rocks is related to the LSS (Hu et al., 2020, 2021; Wang et al., 2020).Therefore, the strainburst intensity IBcan be estimated according to the strainburst probability (Eq.(15)) and the LSS:

Fig.21.Estimation of the angle between the direction of the intermediate stress σx and the main fault plane according to the experimental results of strainbursts obtained by Su et al.(2017b).
How to calculate the LSS reasonably in practical engineering applications and how to determine the threshold values for each level of strainburst intensity based on strainburst case histories are still challenges that need much effort.
5.Conclusions
In this study, the effect of the intermediate stress σxon strainbursts under true triaxial in situ stress conditions of deep tunnels is studied using a 3D bonded block DEM.The DEM simulation results are consistent with the experimental results in the stress-strain response, fracturing process and energy balance.The effect of intermediate stress on the rock strength of strainbursts is discussed by addressing three associated key issues.New true triaxial strength criteria for strainbursts based on the Mogi strength criteria are established, and their potential applications in assessing tendency of strainbursts and evaluating intensity of strainbursts are discussed.The main conclusions are as follows:
(1) The intermediate stress σxaffects the stress-strain response of strainbursts,and there are three types of εz-σzcurves as σxincreases.
(2) As σxincreases, the tensile and shear cracks increase remarkably during the yield platform stage of strainbursts,and the phenomena of slabbing and bending of rock plates are more pronounced.Therefore,σxfacilitates fractures subparallel to the maximum stress direction to grow sufficiently to split the rock sample.
(3) As σxincreases, the stored elastic strain energy and dissipated energy increase linearly,whereas the kinetic energy of the ejected rock fragments increases approximately exponentially, indicating an increase in strainburst intensity.
(4) Only when the three associated key issues are addressed simultaneously can we correctly understand the effect of the intermediate stress on the rock strength of strainbursts.That is,(i)the rock strength of strainbursts should be regarded as the bearing capacity of the burst volume, (ii) the intermediate stress should vary in a moderate range, and (iii) the accuracy of experimental measurement should be ensured.
(5) Strainbursts and rock fractures under true triaxial compression share the basic similarity that the formation of macroscopic shear faulting dictates the ultimate failure.Both the Mogi (1967) and 1971 criteria are applicable to construct strength criteria for strainbursts,provided that the structural feature of strainbursts is considered.That is, the ‘one-face free true triaxial’stress state of a strainburst is converted into its equivalent true triaxial stress state.
(6) In general,the effect of intermediate stress on strainbursts is a double-edged sword that can enhance the rock strength and the precursory information of a strainburst, but also increase its intensity.
Declaration of competing interest
The authors declare that they have no known competing financial interests or personal relationships that could have appeared to influence the work reported in this paper.
Acknowledgments
We acknowledge the funding support from the National Natural Science Foundation of China (Grant Nos.52009016 and 52179118)and the Fundamental Research Funds for the Central Universities(Grant No.2022QN1032).
List of symbols
σ1,σ2,σ3, b The maximum in situ principal stress, intermediate in situ principal stress,minimum in situ principal stress,and intermediate stress ratio of a deep tunnel,respectively
σx,σy,σzAxial (intermediate)stress, radial (minimum) stress and tangential (maximum) stress of the RRE,respectively
τxy,τyz,τzxThe three shear stresses acting on surfaces of the RRE,respectively
KL,EL,AL,lL,ρL,vLThe stiffness,elastic modulus,cross-section area,length, density, and Poisson’s ratio of a loading platen,respectively
kn, ksThe normal stiffness and the shear stiffness of a contact in the DEM model
Cp, CrThe peak and residual cohesion of a contact in the DEM model
Φp,ΦrThe peak and residual friction angle of a contact in the DEM model
Tp, TrThe peak and residual tensile strength of a contact in the DEM model.
μ The friction coefficient between the loading system and the rock sample
εx, εy, εz, εvThe axial, radial, tangential and volumetric strains,respectively
δzThe z-direction displacement of the monitoring points
Ue, UeiThe total elastic energy and the elastic energy of the ith zone
Ei, Vi, viThe elastic modulus,volume,and Poisson’s ratio of the ith zone
Uk, UkiThe total kinetic energy and the kinetic energy of the ith block
vpThe P-wave velocity
V The volume of the rock sample
mi, viThe mass and average(effective)velocity of the ith block
εvm, εyield, εpeak, εΔ The maximum volumetric stain (compressive),the strain at beginning the yield platform, the strain at ending of the yield platform,and the strain increment of the platform, respectively
σyield,σpeakThe stress at beginning of the yield platform and the stress at ending of the yield platform(i.e.rock strength)
τoct,τm,2The octahedral shear stress and the effective mean normal stress acting on the failure plane
τmax,σβThe maximum shear stress and the effective normal stress
τ,σnThe shear stress and the normal stress acting on the failure plane
Utotal,Ue,Ud,ULS,UerThe total energy absorbed by the sample,the elastic energy stored in the sample, the dissipated energy,the energy released by the loading system, and the residual strain energy, respectively
σzr, E The residual stress and the elastic modulus of the rock sample
Ep, Ap, lpThe elastic modulus,cross-section area,and length of the upper loading platen,respectively
τy*,τoct*,τmax* The equivalent radial stress, equivalent octahedral shear stress,and the equivalent maximum shear stress of a strainburst
θxThe angle between the failure fault plane and the intermediate stress
s A parameter related to the geometric effect
ημ,ηG,ηLSSThe correction coefficients for the initial strength criteria of strainbursts considering the end effect,geometric effect,and the loading system stiffness effect,respectively
σθThe measured in-situ maximum tangential stress of a deep tunnel
γ An empirical parameter considering the in situ complexity that can be determined with case histories of strainbursts
PB, IBThe probability and the intensity of a strainburst
 Journal of Rock Mechanics and Geotechnical Engineering2023年3期
- Journal of Rock Mechanics and Geotechnical Engineering的其它文章
- Calibration of an elastoplastic model of sand liquefaction using the swarm intelligence with a multi-objective function
- Predicting and validating the load-settlement behavior of large-scale geosynthetic-reinforced soil abutments using hybrid intelligent modeling
- Effects of biochar-amended alkali-activated slag on the stabilization of coral sand in coastal areas
- Development of mathematically motivated hybrid soft computing models for improved predictions of ultimate bearing capacity of shallow foundations
- Long-term decay of the water pressure in the osmotic tensiometer
- Combined load bearing capacity of rigid piles embedded in a crossanisotropic clay deposit using 3D finite element lower bound
