A generalized nonlinear three-dimensional failure criterion based on fracture mechanics
Zhaofng Wang, Pngzhi Pan, Jianping Zuo, Yaohui Gao
a State Key Laboratory of Geomechanics and Geotechnical Engineering,Institute of Rock and Soil Mechanics,Chinese Academy of Sciences, Wuhan,430071,China
b University of Chinese Academy of Sciences, Beijing,100049, China
c School of Mechanics and Civil Engineering, China University of Mining and Technology, Beijing,100083, China
d State Key Laboratory of Coal Resources and Safe Mining, China University of Mining and Technology, Beijing,100083, China
e Power China Huadong Engineering Corporation Limited, Hangzhou, 310014, China
Keywords:Intermediate principal stress effect Rock strength Fracture mechanics True triaxial compression
ABSTRACT Based on fracture mechanics theory and wing crack model, a three-dimensional strength criterion for hard rock was developed in detail in this paper.Although the basic expression is derived from initiation and propagation of a single crack, it can be extended to microcrack cluster so as to reflect the macroscopic failure characteristic.Besides, it can be derived as Hoek-Brown criterion when the intermediate principal stress σ2 is equal to the minimum principal stress σ3(Zuo et al.,2015).In addition,the opening direction of the microcrack cluster decreases with the increase of the intermediate principal stress coefficient, which could be described by an empirical function and verified by 10 kinds of hard rocks.Rock strength is influenced by the coupled effect of stress level and the opening direction of the microcrack clusters related to the stress level.As the effects of these two factors on the strength are opposite, the intermediate principal stress effect is induced.
1.Introduction
Rock fracturing process under multiaxial stresses,especially the effect of stress on the rock brittle fracture, has become an significant subject in rock mechanics (Mogi,1967; Pan et al., 2012).The magnitude and orientation of the principal stresses play important roles in changing the failure mode of rocks.The stiffness of testing machine apparently affects the post-peak stress-strain curves of brittle hard rocks under axial-strain-controlled loading (Cai et al.,2021).Conventional triaxial compression tests are often used to study the influence of confining pressure on rock failure.However,in the compression tests, the rock specimens is subjected to the same radial stress state.With the development of testing technique,a large number of true triaxial compression tests have been conducted to reveal the actual rock failure performance under principal stresses(Mogi,1981,2006;Geng and Xu,1985;Takahashi and Koide,1989;Chang and Haimson,2000;Chen and Feng,2006;Feng et al., 2016).More importantly, the special effect of intermediate principal stress (σ2) on the rock strength has been observed and examined in these laboratory studies.
The intermediate principal stress effect revealed that hard rock strength increases and then decreases with the increase of σ2.Based on the laboratory results,many theories have been proposed to interpret this effect.Earlier studies attributed this effect to the following three factors:uncertain anisotropy of rock(Böker,1915),low accuracy of failure stress measurement (Murrell,1965; Mogi,1967; Chang and Haimson, 2000), and uneven stress distribution at the end of rock specimen (Jaeger and Hoskins,1966).After the effect has been verified in true triaxial compression tests,this effect was considered as the influence of σ2on the effective normal stress over the failure plane(Mogi,1967;Chang and Haimson,2000),the effective shear strain energy stored in rock (Takahashi and Koide,1989), or a kind of failure mode (Mogi, 2006; Feng et al., 2019).With deeper explanation and more profound understanding of this effect, various failure criteria considering the influence of σ2were proposed(Mogi,1967,1971;Aubertin and Simon,1996;Ewy,1999;Zhang and Zhu, 2007; Chang and Haimson, 2012; Ma et al., 2017;Wang et al.,2018,2019;Feng et al.,2019).These interpretations and strength criteria mainly focus on the macroscopic failurecharacteristics of rocks observed and summarized from laboratory results.However, they appear to ignore the physical mechanism induced by micro-fracturing.
On the other hand, based on the micro-fracturing mechanism,rock failure can be also studied from the theoretical perspective by establishing a theoretical model and making several assumptions.Some well-known strength criteria, such as the Griffith criterion(Griffith,1921), modified Griffith criterion (McClintock and Walsh,1962), and Wiebols-Cook criterion (Wiebols and Cook, 1968),were proposed based on pure mathematical derivation.A nonlinear strength criterion(Zuo et al.,2008)was derived for rocks based on fracture mechanics and two-dimensional (2D) crack model, which has a similar expression with the Hoek-Brown criterion(Hoek and Brown, 1980).This work was further extended to a threedimensional (3D) crack model subjected to pseudo triaxial stress,namely σ2=σ3.Based on that, the theoretical Hoek-Brown criterion was derived,and the physical meaning of the parameter m was explained(Zuo et al.,2015).The study of Zuo et al.(2015)is of great value for providing the basis and derivation of the Hoek-Brown criterion for intact rock using a fundamental and mechanically rigorous fracture mechanics approach(Brown,2015).Renctly,Hoek and Brown (2019) and Rafiei Renani and Cai (2022) comprehensively reviewed the Hoek-Brown criterion from the perspectives of geological strength index(GSI)and jointed rock mass,respectively.Hoek and Brown (2019) pointed out that Zuo et al.(2008, 2015)showed a very similar equation which could be derived by analyzing the failure propagation of a penny-shaped crack in the triaxial stress field.Zuo and Shen (2020) investigated the micromeso physical transformation mechanism and a theoretical model for brittle-ductile transition behavior of rocks in detail.Zhou et al.(2014) extended the nonlinear strength criterion to 3D conditions using a similar method.Through these theoretical studies,the gap between the physical mechanism and the macroscopic failure of hard rock can be completely or partially filled.
In this study, a 3D rock failure model containing a single microcrack subjected to true triaxial stresses is derived in detail based on fracture mechanics theory and the wing crack model.Then the model is extended to microcrack cluster to predict hard rock strength at macroscale.Based on several failure characteristics and reasonable assumptions,relations between the most favorable direction of microcrack cluster and intermediate principal stress coefficient are derived and examined based on the results of previous laboratory true triaxial compression tests.Finally, the intermediate principal stress effect on the hard rock strength is discussed and the physical meaning of the effect is revealed according to the above derivations and assumptions.
2.Fundamental hypotheses according to single pennyshaped crack model
The development of microcracks was the main reason of inelastic response of brittle or quasi brittle material(Tapponnier and Brace,1976).Its strength decreased due to the existence of initial flaws or cracks(Jaeger et al.,2007).In this paper,it is assumed that the failure of hard rocks is caused by penny-shaped microcracks,which are widespread in many brittle materials (Paterson and Wong, 2005).Similar to Zuo et al.(2008), this paper makes two fundamental assumptions: (1) abundant penny-shaped microcracks are randomly embedded in the isotropic elastic material,and inelastic response is induced by the crack development; and (2)cracks are sparsely distributed, ignoring the interaction of these cracks.

Fig.1.Diagrammatic sketch of the fracture model, in which a penny-shaped crack is located in the material matrix.The global coordinate system (Ox1x2x3) and the local coordinate system(Ox'1x'2x'3)of the crack are also illustrated.The angle between the x'2 axis and plane Ox2x3 is θ, and the angle between x'3 and x2 is φ.

Fig.2.Development of the penny-shaped microcrack.Secondary wing cracks form at the two tips of the microcrack due to the shear stress σ'21 on the surface of the pennyshaped microcrack.σ'22 is the normal stress on the surface.σ1,σ2 and σ3 are loaded to the material matrix in the far field.
Based on the above assumptions, the fracture model shown in Fig.1 is considered, with a penny-shaped crack of radius a embedded in the isotropic elastic material matrix,loaded in the far field.The global and local coordinate systems of the crack are set as Ox1x2x3and Ox'1x'2x'3, respectively.In the local coordinate system,the x'2axis is parallel to the normal vector of the crack,while both the x'1and x'3axes are parallel to the surface of the penny-shaped crack.Moreover, the x'3axis is coplanar with the x2and x3axes in the global coordinate system.In addition,the angle between the x'2axis and plane Ox2x3is θ,while φ is the angle between the x'3and x2axes.Therefore, the set (θ, φ) can be adopted to describe the inclination of the penny-shaped microcrack in 3D space.The relation between the basic vector of the two coordinate systems is shown below:
The relation between the stress components (positive in compression) of the two systems can be derived as follows:
where
Development of the penny-shaped microcrack is considered by the wing crack model (Horii and Nemat-Nasser, 1986; Wang and Shrive, 1993; Bobet, 2000), as shown in Fig.2.When the pennyshaped crack propagates along x'1, it is subjected to shear stress.However,it is subjected to tensile stress or traction when the crack propagates along the direction parallel to x2.In addition, it is generally subjected to coupled tensile and shear stresses when the crack propagates between x'1and x2.Therefore,the opening of the secondary wing cracks is caused by the shear stress or traction on the surface of the penny-shaped crack.The shear stress σ'21and the normal stress σ'22on the surface of the penny-shaped microcrack can be calculated as
According to the wing crack model (Horii and Nemat-Nasser,1986; Wang and Shrive, 1993; Bobet, 2000), in-plane traction is always considered in the formation of the secondary wing cracks,while the out-plane traction should be ignored here.The stress intensity factor depends on the magnitude of the traction τton the crack plane, which can be calculated below:
where σNand τ are the normal and shear stresses on the shear plane, respectively;μ stands for the frictional coefficient;and τcis the shear strength on the plane, and it equals μσNas the Mohrignored.The stress intensity factor KIIfor this in-plane shear crack can be calculated(Tada et al.,1973) as
where ν is the Poisson’s ratio, and a is the radius of the pennyshaped crack.
The propagation condition of the penny-shaped crack for the mixed fracture mode is defined (Kachanov,1982) as follows:
where KICis the fracture toughness for the mode I opening,which was determined by Zuo et al.(2008)as,in which σtis the uniaxial tensile strength;and κ is the fracture coefficient depending on the mixed fracture criterion, for instance, κ = 1 for the maximum energy release rate criterion (Sih and Macdonald,1974;Nuismer,1975).
Combining Eqs.(4)-(7),the following equation can be obtained:
where β = (1-ν/2)κ,s1= σ1/σt,s2= σ2/σt,and s3= σ3/σt.Eq.(8)includes the possible crack inclination set(θ,φ)under different stress levels (σ1,σ2,σ3).
As θ is the angle between the local x'2axis and the plane Ox2x3,θ represents the inclination angle of the crack surface Ox'1x'3relative to the x1axis or σ1.The wing crack opening direction is coplanar with the x'1and x'2axes where the shear stress σ'21and the normal stress σ'22distribute, inducing the opening of the secondary wing crack.Moreover, the wing crack opening direction is also perpendicular to x1or σ1.Therefore, φ can be considered as the rotation angle between the wing crack opening direction and x3or σ3.For a given φ and far-field load set (σ1, σ2,σ3), as shown in Fig.3, the range of tanθ, tanθ1and tanθ2can be calculated below:
Coulomb criterion is applied on the crack internal surface.Besides, the upper and lower sides of the pre-existing crack are disconnected.Therefore,the cohesion at the crack surface could be
In Fig.3, α = θ2- θ1, which is used to represent the microfailure orientation angle or azimuth under triaxial compression(Zuo et al., 2008).Based on Eq.(9), tanα can be calculated as

Fig.3.The possible crack inclination angle θ in 1/8 of the unit sphere for a given φ and far-field load set (σ1, σ2, σ3).The blue solid line represents the possible range, and penny-shaped cracks with their local coordinate systems are also illustrated.In addition,the upper and lower boundaries of the possible crack inclination angle,θ2 and θ1,are also shown.
The angle α represents the damaged portion of the internal microcrack, while the macroscopic damage occurs in the sector between θ1and θ2(Zuo et al., 2008), as shown in Fig.3.Furthermore, |∂α/∂σ1| can be used to measure the characteristic of damaged microcrack clusters that cause macr-failure considering both the magnitude and rate of change of this ratio.α can be replaced by sinα as the angle between the final failure plane and σ1is relatively small (Zuo et al., 2015; Zuo and Shen, 2020).The following macro-failure measurement M can be obtained:

Fig.4.Diagrammatic sketch of the opening tendency of a single crack.Zones I and II are the directional zones of opening and unopening tendency, respectively.

Fig.5.Measurement of the macro-failure plane rotation angle ψ at different stress levels.It should be noted that ψ is calculated from a side image of the specimen and the spatial rotation is ignored: (a)γ = 0; (b)γ = 0.06; (c)γ = 0.18; and (d)γ = 0.31.
In the uniaxial compression state, s2and s3equal 0, while s1is the ratio between the uniaxial compressive and tensile strengths,i.e.s1= σc/σt, which can be used to calculate the macro-failure measurement Mucunder uniaxial compression.The macro-failure measurement can quantitatively describe the macro-failure tendency for each rock type.When M = Muc, the following relation can be obtained:
When σ2= σ3in the triaxial compression, Eq.(12) can be transformed into the following equation:
Eq.(13) is similar to the nonlinear strength criterion proposed by Zuo et al.(2008),which was strictly derived based on the theory of fracture mechanics and has a similar form with the Hoek-Brown criterion.
3.Extension to the strength of microcrack cluster
It should be noted that φ in Eq.(12) is obtained based on an assumption that there exists only one single crack embedded in the material matrix.In fact,the strength of rocks is determined by the behavior of microcrack cluster.As discussed above,in the conditionthat σ2and σ3are constant,the larger the φ is,the larger the σ1will be based on Eq.(12).The opening tendency of a single crack is shown in Fig.4 when φ stands for the material property.When the actual rotation angle φais smaller than φ,the actual local strength σs1awill be smaller than σs1(calculated with φ from Eq.(12)).Therefore,the directional zone in which φa<φ is considered to be of opening tendency.Oppositely, when φa>φ, the crack could be more stable due to the local strength σs1agreater than σs1,and thus the directional zone in which φa>φ is considered to be of unopening tendency.
In the local area, the stress conditions are approximately the same when ignoring crack interactions.The microcrack cluster in this local area could influence the global bearing capacity.The opening of microcracks whose opening directions are in the directional zone of unopening tendency delays, and the other microcracks which open in the directional zone of opening tendency strengthen.Actually, the strength of microcrack cluster is determined by the maximum strength provided by the microcrack with the most favorable direction in the directional zone of opening tendency, which could be calculated below:
where σs1acan be calculated from Eq.(12), and φmis the most favorable direction.Apparently, φmis the upper limit of φain the directional zone of opening tendency, and it is the assumed material property φ.Eq.(14) indicates that Eq.(12) is also suitable to describe the strength of microcrack cluster.The following strength criterion for microcrack cluster can be obtained by substituting Eq.(12) into Eq.(14):
Actually, the macro-failure is mainly influenced by the microcrack cluster instead of a single microcrack,indicating that φmcan reflect the characteristics of macro-failure.

Fig.6.Statistical relation between the macroscopic failure plane rotation angle ψ and intermediate principal stress coefficient γ.The blue dashed line is the trend line without fitting.
4.Relations between the most favorable direction and intermediate principal stress coefficient
In the previous section,Eq.(15)is derived for constant σ2and σ3.Basically, φmis the most favorable direction angle between the wing crack opening direction and σ3.In Eq.(15), when σ3keeps constant and σ2increases, as (μ/β)(σc/σt) is influenced by the constant material properties,σ1could increase.This contrasts with the test results where intermediate principal stress effects were observed in true triaxial compression test.It reveals that the strength increases at first and then decreases with the increase of σ2under constant σ3.Therefore,φmshould be related to the stress levels.As the stress level set(σ1,σ2,σ3)is in a vector space,which is hard to handle,a simple scalar named as the intermediate principal stress coefficient was proposed by Wang and Lade (2001).It is expressed as below:
where γ is in the range of 0-1.When σ2= σ3, we have γ = 0,which stands for the conventional triaxial compression.When σ1= σ2, γ = 1, indicating the generalized conventional triaxial tension.
As Eq.(15)can stand for the strength of microcrack cluster,it can also reflect the characteristics of macro-failure.Hence, the macrofailure plane rotation angle ψ, which is the angle between the main failure plane and σ2,is measured approximately,as shown in Fig.5.Moreover,ψ is the angle between the opening direction of the main failure plane and σ3,which is consistent with the definition of the rotation angle φ.It should be noted that ψ is calculated from a side view of the specimen and the spatial rotation is ignored.
The relation between ψ and the intermediate principal stress coefficient γ is shown in Fig.6,in which the blue dashed line stands for the trend line.It can be observed from Fig.6 that ψ seems to decrease with the increase of γ at a decreasing rate.ψ and γ have a negative exponential relationship, as reported in previous study(Chang and Haimson, 2005).It was pointed out that most of the microcrack orientations are random when σ2= σ3,and they tend to be parallel to σ2direction as the differential stress σ2-σ3increases.Since φmis derivated from microcrack cluster, which reflects the feature of macro-failure to a certain extent, it can be assumed that φmfollows the relation below:
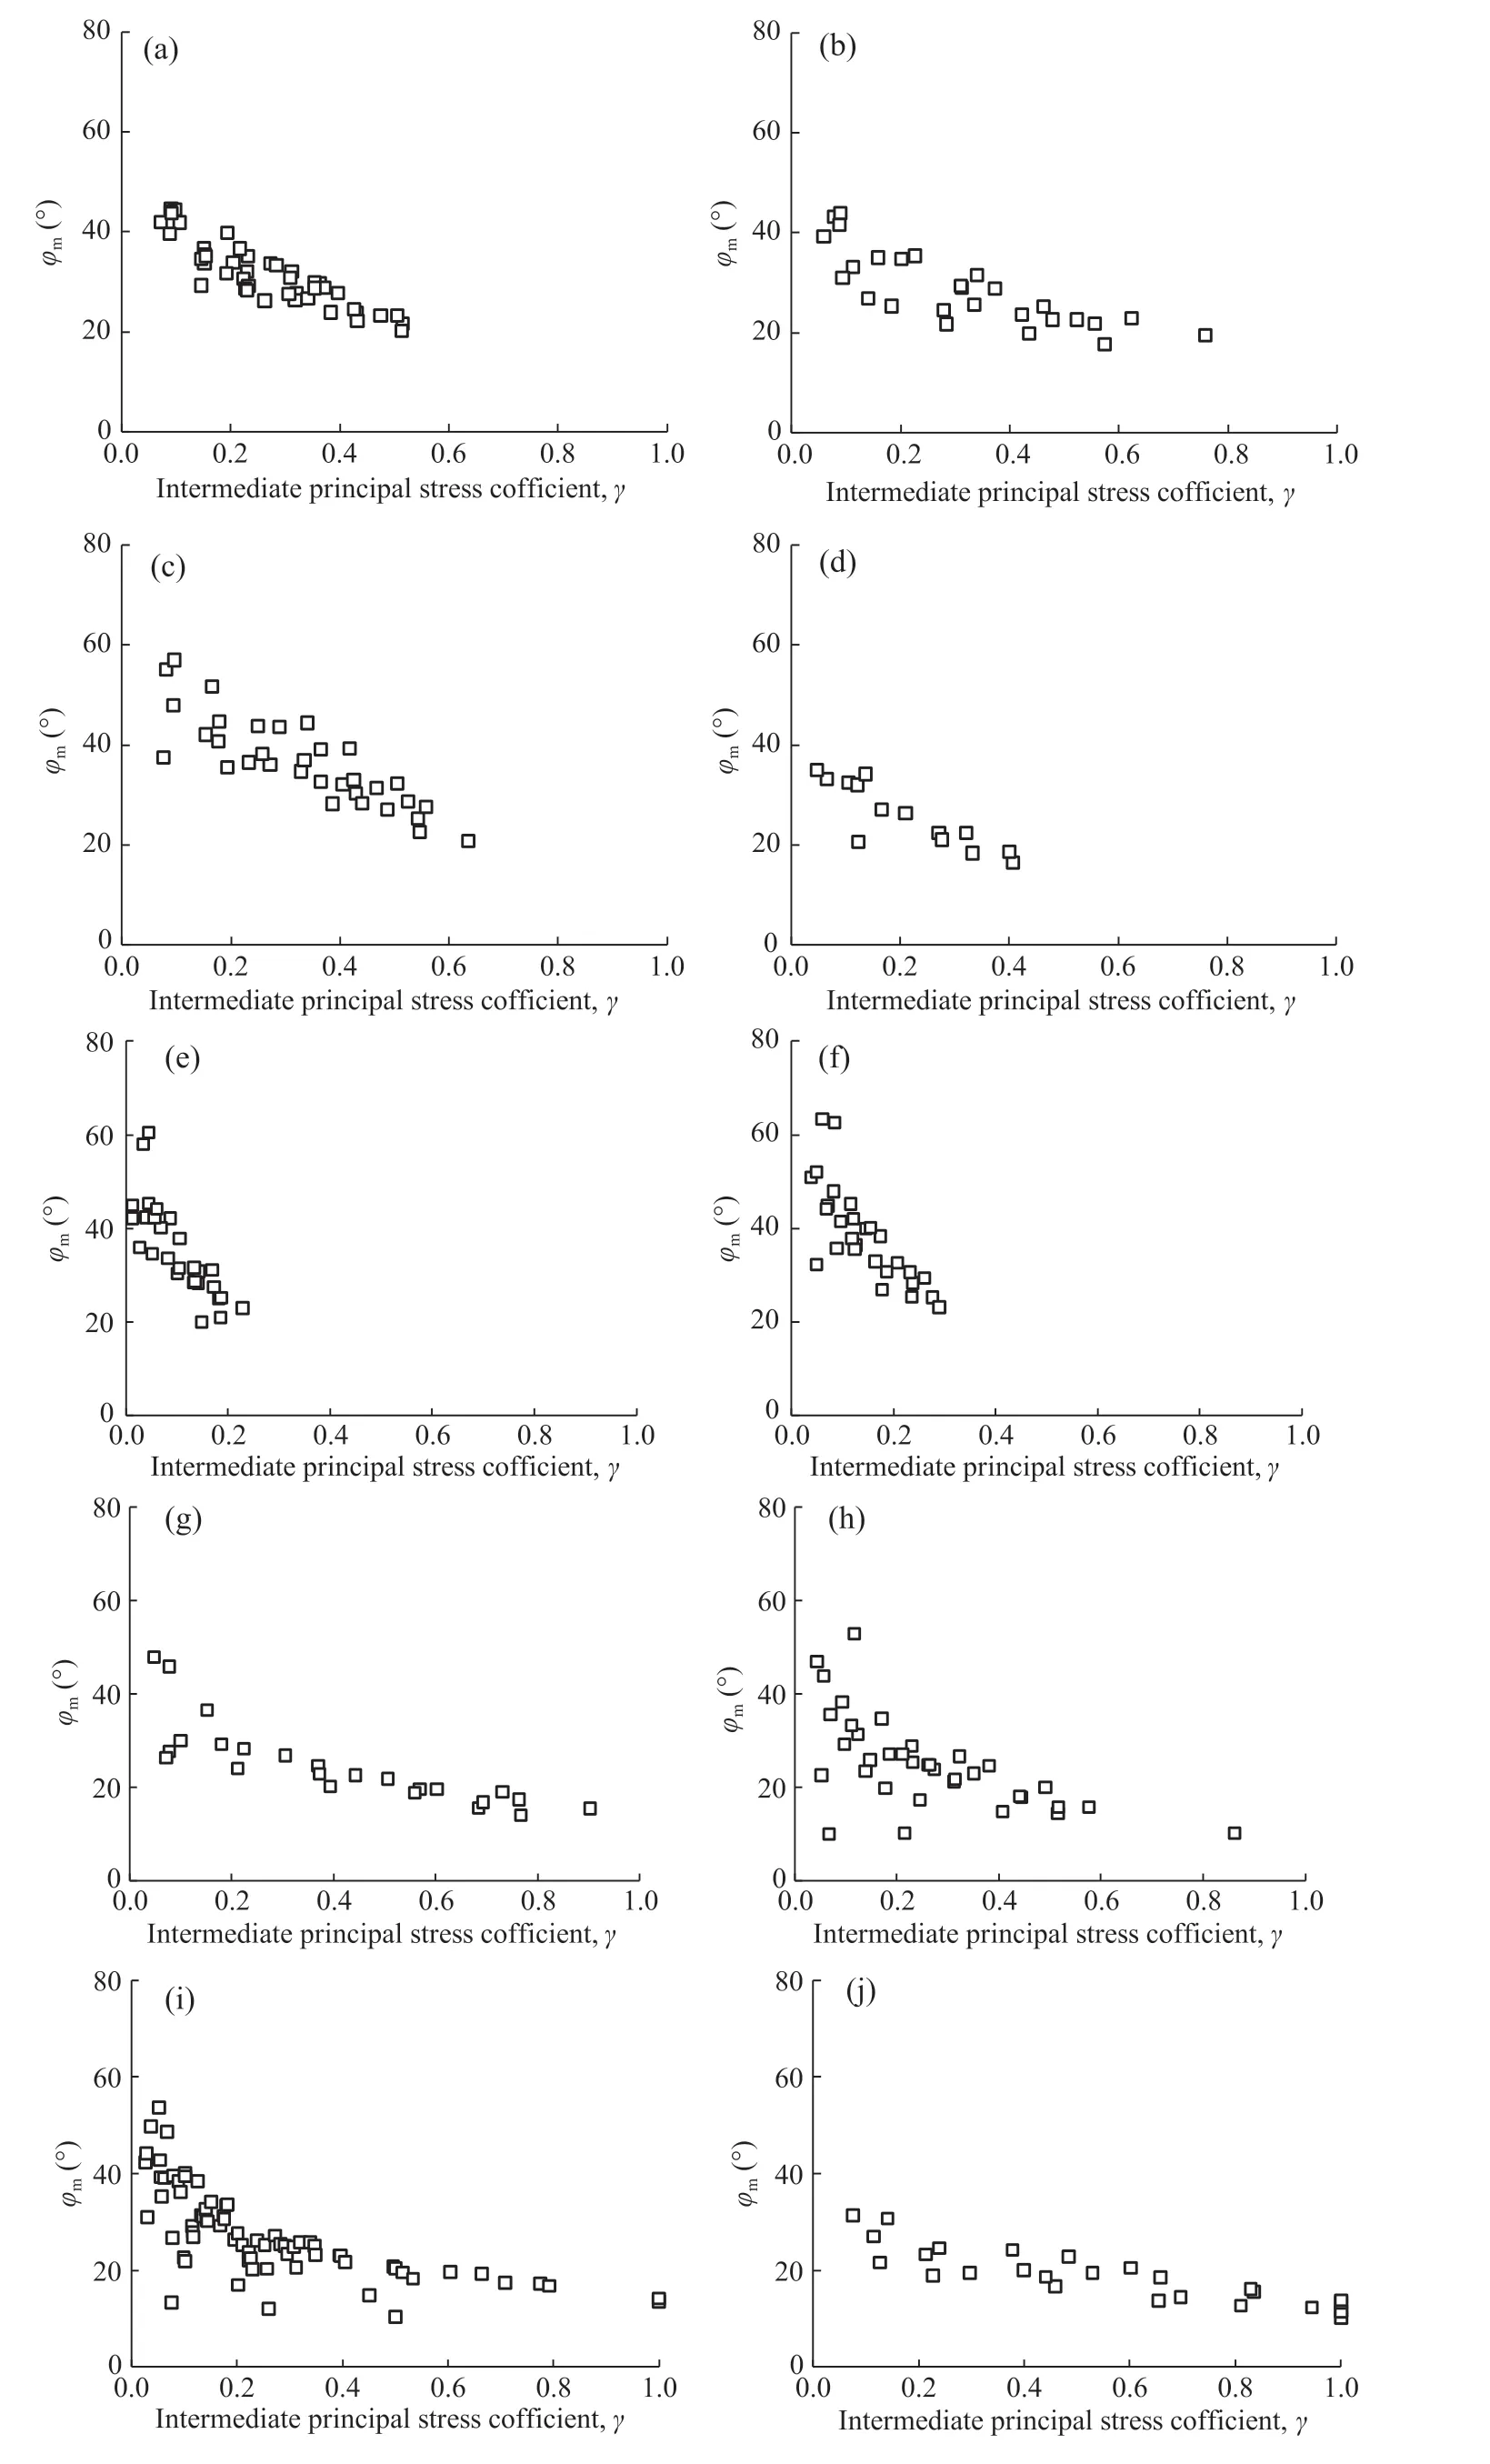
Fig.7.Relations between the most advantageous direction angle φm and the intermediate principal stress coefficient γ for different rock types:(a)Dunham dolomite;(b)Solnhofen limestone; (c) Yamaguchi marble; (d) Manazuru andesite; (e) Inada granite; (f) Orikabe monzonite; (g) Mizuho trachyte; (h) KTB amphibolite; (i) CJPL-II marble; and (j) Yunnan sandstone.
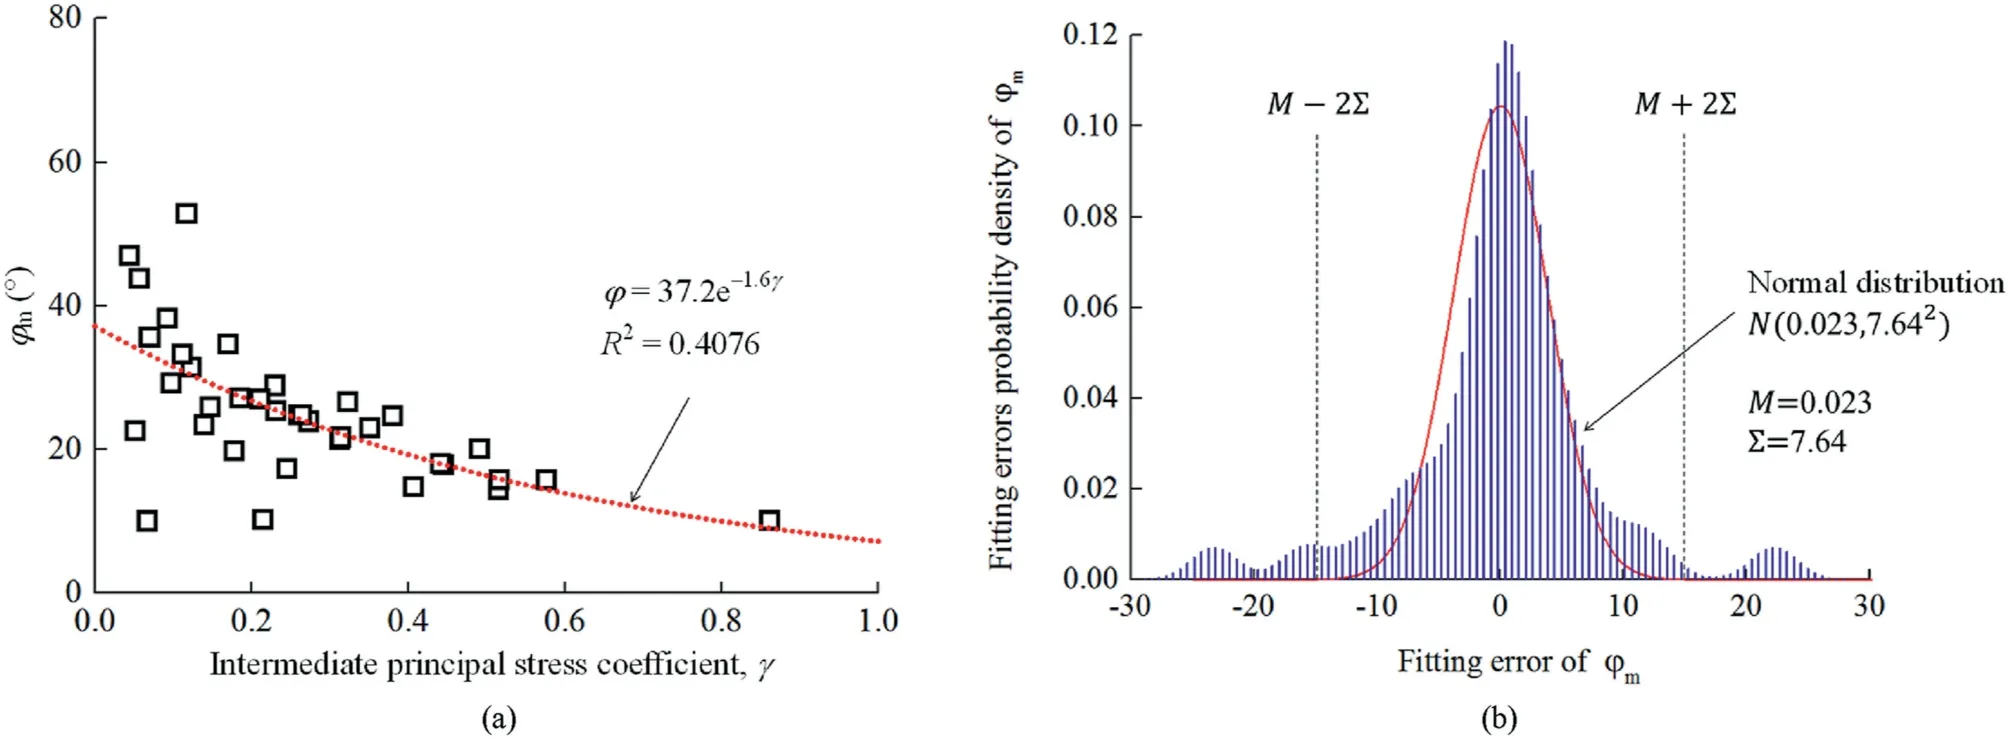
Fig.8.Fitting result and errors of KTB amphibolite:(a)Fitting results of KTB amphibolite with an exponential function;and(b)Probability density histogram of the fitting error on the rotation angle φm.Besides, the best normal distribution is also illustrated.
where φ0is the initial favorable direction angle for γ = 0,and D is the attenuation rate.
The reasonability of Eq.(17) needs to be verified.Ten sets of published true triaxial tests on different types of intact rocks(Chang and Haimson, 2000; Mogi, 2006; Feng et al., 2019) have been taken for examining the accuracy of Eq.(17).Based on the uniaxial compression test results, the average σcis obtained.In addition, (μ/β)(σc/σt) is obtained from the best-fitting results according to the conventional compression data and Eq.(13), as shown in Table 1.

Table 1Values of (μ/β)(σc/σt) and σc for different rock types.
It can be seen that the results fit well in Table 1,indicating that Eq.(13) (derivative from Eq.(12)) can be applied for the uniaxial and conventional triaxial compression.With the reliability of σcand (μ/β)(σc/σt), φmcan be calculated directly by Eq.(15).The relations between φmand the intermediate principal stress coefficient γ of different rocks are shown in Fig.7.
It should be noted that φmwas calculated directly from the experimental data and Eq.(15) without fitting.Eq.(17) was applied to fit the data, and the fitting results and errors of KTB amphibolite are shown in Fig.8.The data are relatively discrete and the R2value is only 0.4076, as shown in Fig.8a.It can be explained that the actual strength cannot be reached for a constant positive γ in real true triaxial compression tests, due to the variable experimental controlling conditions.Besides, there also exist errors during the experimental operation.In Fig.8b,normal distribution is applied to fit the probability density histogram of the fitting errors, and Kolmogorov-Smirnov test condition is obtained.Hence, these experimental errors are random and accidental,which need to be abandoned for acquiring rational results.Thus,a computer program was written to abandon these random errors and determine the best-fitting solutions of the relation between φmand γ.Firstly,the data set was fitted roughly using the least square method and the misfit was calculated as well.The average value M and standard deviation Σ can be acquired.Afterward,the abnormal outlier data points(not in the range of[M -2Σ,M + 2Σ]) were detected and eliminated based on the Pauta criterion.The remaining data were processed with the same method.It is worthy mentioning that iteration could be broken down when there were no outliers.The well fitted relation between φmand γ is shown in Fig.9.
Fig.9 indicates that Eq.(17)is suitable for different rocks after eliminating the accidental errors.The rock strength under any stress levels can be calculated by substituting Eq.(17) into Eq.(15):
When σ2= σ3,Eq.(18)could be converted to Eq.(13),which is similar to the theoretical Hoek-Brown criterion (Zuo et al., 2008,2015).Furthermore, Eq.(18) can be applied for true triaxial compression conditions.
5.Interpretation of the intermediate principal stress effect
The intermediate principal stress effect could be explained by Eq.(18), and its physical meaning is illustrated in this section.
Eq.(18) can be simplified as follows:
where σ*is the equivalent stress, and σ*= σ2sin2φ0e-Dγ+σ3cos2φ0e-Dγ.When σ2= σ3,σ*turns into σ3,and Eq.(18)could be converted to Eq.(13).
In fact, the strength σ1increases monotonously with σ*.The change of σ*for a constant σ3is considered herein.Based on Eq.(17),φmdecreases with the increase of γ, and the opening direction of microcrack cluster tends to be parallel to σ1.Hence,the opening direction tendency of microcrack cluster is determined by the intermediate principal stress coefficient.For a constant σ3, γ increases whileφmdecreaseswiththeincreaseofσ2,asshowninFig.10a.When σ2is larger than σ3and γ is larger than 0,φmand sin2φmare large,causing that σ*could increase with the increase of σ2.When σ2is higher enough than σ3and γ is large,φmand sin2φmcould be relatively small.Hence,σ*could decrease since the decrement of sin2φmis much greater.Meanwhile,the strength will also start to decrease.However, when σ1= σ2, the generalized conventional tensile strength is larger than the compressive strength in the condition that σ2= σ3as σ2sin2φ0e-D+σ3cos2φ0e-Dis larger than σ3.
As shown in Fig.10b, the calculated strength from Eq.(19) and the corresponding σ*fit well with the experimental results.Hence,the intermediate principal stress effect can be revealed by Eq.(12)derived based on the fracture mechanics, Eq.(14) for strength measurement of microcrack cluster,and Eq.(17)for the stress level dependence of opening direction of microcrack cluster.Furthermore, it also indicates that the strength is influenced by the superposed effect of the stress levels and the stress level dependence of the opening direction φmof microcrack cluster in Eq.(17).
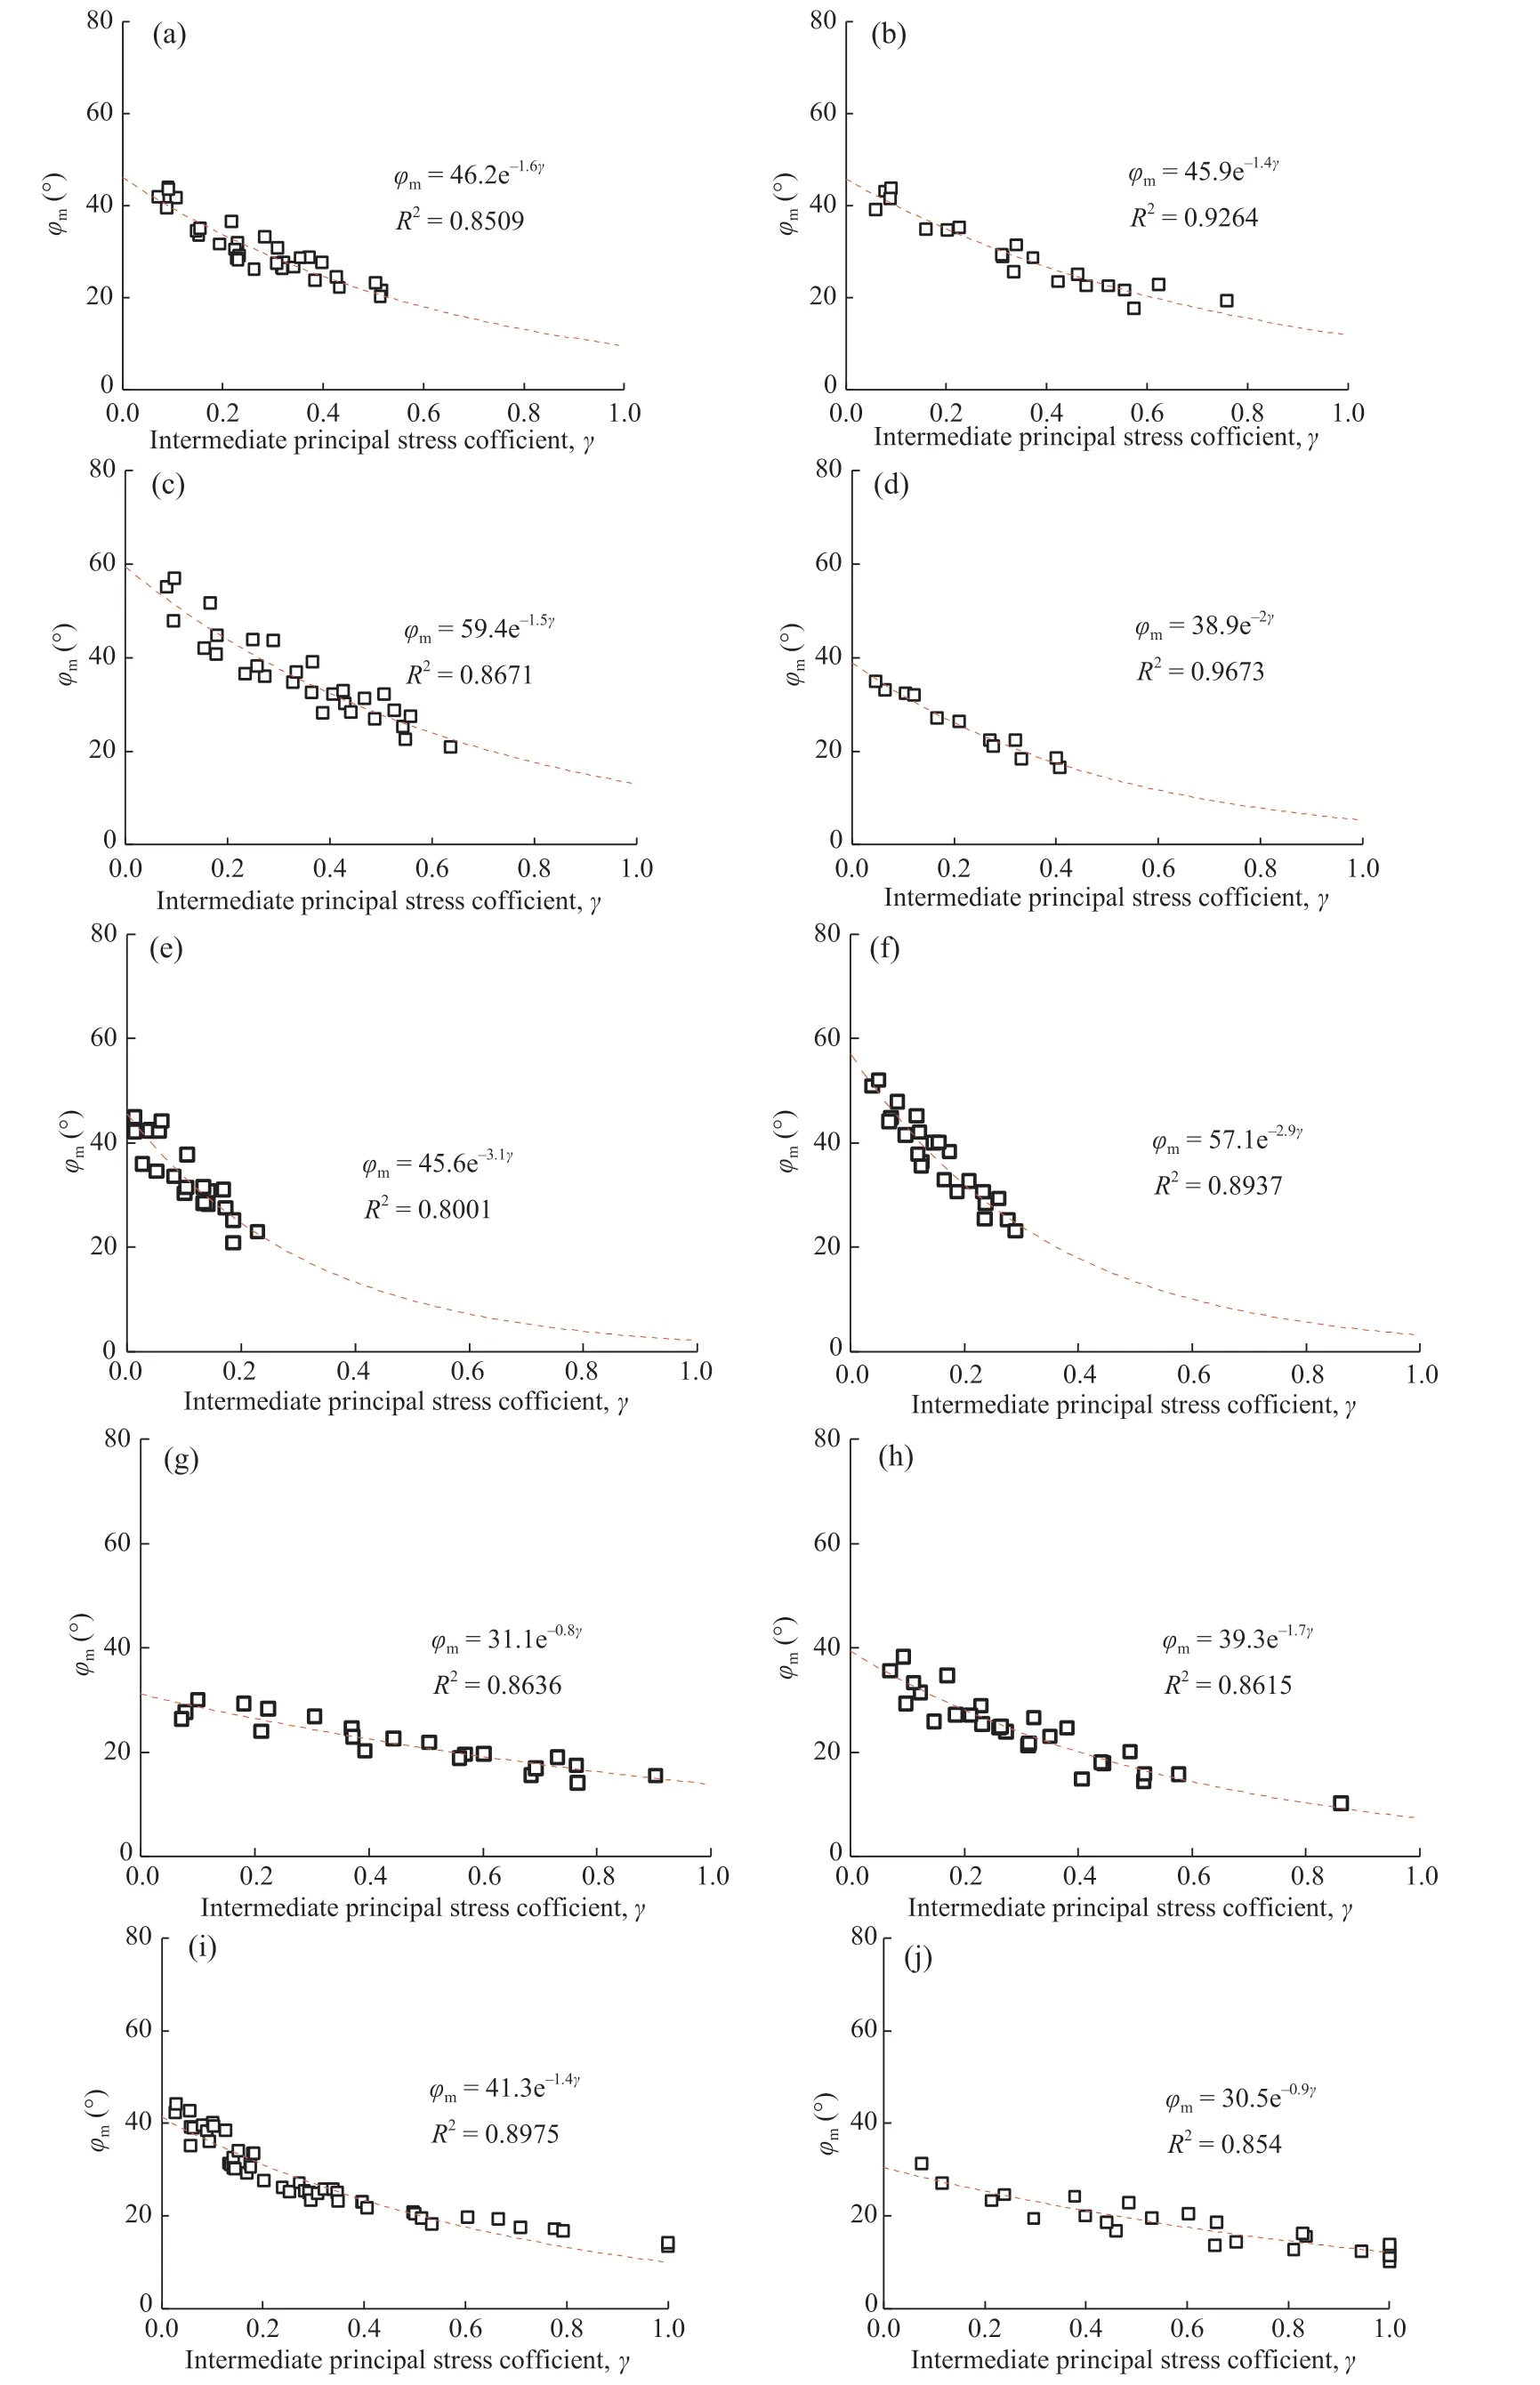
Fig.9.Robust fitting relations between the most favorable direction angle φm and the intermediate principal stress coefficient γ for different rock types:(a)Dunham dolomite;(b)Solnhofen limestone;(c)Yamaguchi marble;(d)Manazuru andesite;(e)Inada granite;(f)Orikabe monzonite;(g)Mizuho trachyte;(h)KTB amphibolite,;(i)CJPL-II marble;and(j)Yunnan sandstone.
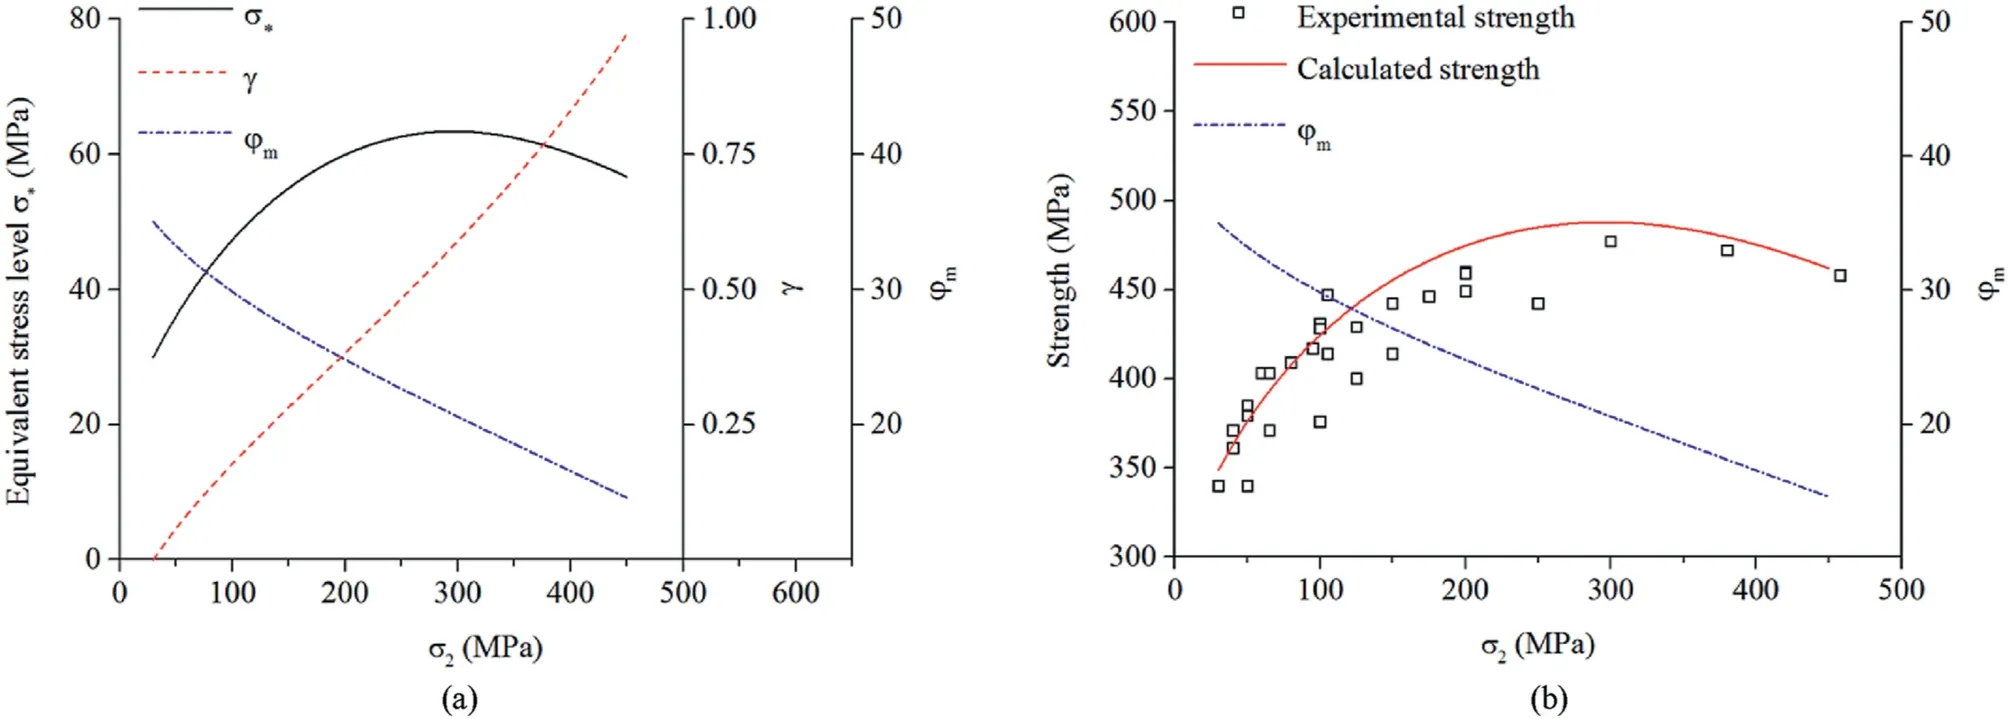
Fig.10.(a) The equivalent stress σ*, γ and φm against σ2; and (b) Experimental and calculated strengths and φm against σ2.The experimental results are acquired from the true triaxial compression tests of CJPL-II marbles for σ3 = 30 MPa.
This interpretation can be linked to another distinct feature of true triaxial compression test results.Previous studies revealed that the final failure plane is approximately parallel to σ2direction(Mogi,1981,2006;Geng and Xu,1985;Takahashi and Koide,1989;Chang and Haimson,2000;Chen and Feng,2006;Feng et al.,2016)in true triaxial compression tests.As shown in Eq.(17), φmdecreases and the opening direction of microcrack cluster tends to be parallel to σ3with the increase of γ.Accordingly, the marcocrack induced by the opening of the microcrack cluster tends to extend along σ3direction.In addition, the direction of final failure plane tends to be parallel to σ2with the increase of γ.The resultillustrated in Fig.6 is consistent with the previous studies for a relatively high γ.
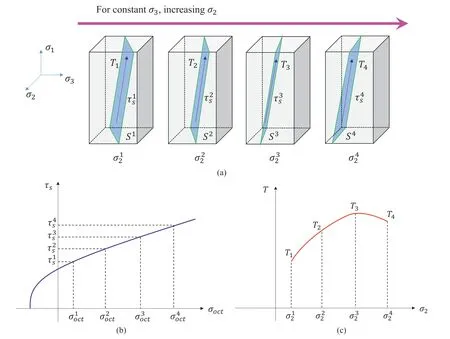
Fig.11.Physical meaning of the strength and intermediate principal stress effect:(a)Different failure planes for different σ2 levels(σ12,σ22,σ32 and σ42),where T1,T2,T3 and T4 are the tractions on the planes, S1, S2, S3 and S4 are the areas of the failure planes, and τ1s, τ2s, τ3s and τ4s are the shear strengths on the planes; (b) Shear strength τs plotted against the octahedral normal stress σoct; and (c) Traction T plotted against σ2.
The physical meaning of the coupling effect is also clear to understand.As shown in Fig.11a, T1, T2, T3and T4are the global traction forces on the final failure plane under different σ2,S1,S2,S3and S4are the effective areas of the final failure plane,and τ1s,τ2s,τ3sand τ4sare the shear strengths of the failure plane.The failure condition of the failure plane can be calculated below:
In Fig.11b,it can be seen that the shear stress τsalways increases with the octahedral normal stress σoct(σoct= (σ1+σ2+σ3)/2).For a constant σ3,σoctincreases with the increase of σ2,resulting in τ1s<τ2s<τ3s<τ4s, which indicates the influence of stress levels on the strength.When σ3is constant,the intermediate principal stress has little influence on the failure angle (the angle between σ1and the final failure plane)(Feng et al.,2019).Hence,the failure angle is set constant in Fig.11a.Keeping σ3constant and increasing σ2,the direction of final failure plane could tend to be parallel to σ2and then S1>S2>S3>S4, which reveals the influence of the stress level dependence of the opening direction φmof microcrack cluster.Therefore, the coupling effect of stress level and the stress level dependence of the opening direction can be presented by Eq.(20),which is equivalent to Eq.(18).Moreover, Eq.(20) reveals the physical meaning of the coupling effect on the rock strength.
Based on Eq.(20),the real traction T required for failure can be calculated as τsS.Due to τ1s<τ2s<τ3s<τ4sand S1>S2>S3>S4,the maximum traction T may not be τ4sS4and could occur in a intermediate state.Fig.11c shows a possible condition that T3is the maximum traction.The greater the real traction T required is, the larger the global strength there will be.Hence, the maximum strength could be reached with a mediate σ2and a constant σ3.The physical meaning of this interpretation is illustrated as well.
Therefore, the rock strength is determined by the stress levels and the stress level dependence of the opening direction of microcrack cluster.The development of microcrack cluster is asymmetric, which could influence the strength.Besides, the development asymmetry is determined by the stress level.On one hand, the stress level can directly influence the strength; on the other hand,the intermediate principal stress can directly influence the asymmetric development of the microcrack cluster, leading to the variation of the strength.
6.Conclusions and discussion
In this paper, it is assumed that the failure of hard rocks is caused by the presence of penny-shaped microcracks.Based on the fracture mechanics and statistical analyses from existing true triaxial compression test results,a nonlinear 3D strength relation is proposed considering the effect of intermediate principal stress.Finally, the strength relation is applied to interpret the intermediate principal stress effect on the strength of hard rocks.The following conclusions are obtained:
(1) Based on the strength of microcrack cluster, a nonlinear 3D strength relation is proposed.Besides, the relation can be converted to the Hoek-Brown criterion when σ2= σ3.
(2) The strength of hard rock is influenced by the coupled effect of stress level and the stress level dependence of the opening direction φmof microcrack cluster.With the increase of the intermediate principal coefficient γ, φmdecreases in an empirical form, which can be verified by 10 kinds of hard rocks.
(3) The rock strength increases firstly and then decreases,which is induced by the direct effect of σ2strengthening coupled with the indirect effect of microcrack asymmetric development.
Furthermore,the physical meaning of the coupling effect can be explained by this nonlinear strength criterion and the interpretation of the intermediate principal stress effect.Actually, this strength relation can be considered as a 3D generalized Hoek-Brown criterion.However, it seems complex to be applied to the actual field conditions and should be simplified for convenience in the future.In addition, the physical meaning and determination method of the two added parameters need to be verified.
Declaration of competing interest
The authors declare that they have no known competing financial interests or personal relationships that could have appeared to influence the work reported in this paper.
Acknowledgments
The authors acknowledge the financial support the National Natural Science Foundation of China (Grant No.52225404) and Beijing Outstanding Young Scientist Program (Grant No.BJJWZYJH01201911413037).We would also like to thank Key Laboratory of Ministry of Education on Safe Mining of Deep Metal Mines, Northeastern University, China for giving us the opportunities to conduct the experimental and simulating tests.
 Journal of Rock Mechanics and Geotechnical Engineering2023年3期
- Journal of Rock Mechanics and Geotechnical Engineering的其它文章
- Calibration of an elastoplastic model of sand liquefaction using the swarm intelligence with a multi-objective function
- Predicting and validating the load-settlement behavior of large-scale geosynthetic-reinforced soil abutments using hybrid intelligent modeling
- Effects of biochar-amended alkali-activated slag on the stabilization of coral sand in coastal areas
- Development of mathematically motivated hybrid soft computing models for improved predictions of ultimate bearing capacity of shallow foundations
- Long-term decay of the water pressure in the osmotic tensiometer
- Combined load bearing capacity of rigid piles embedded in a crossanisotropic clay deposit using 3D finite element lower bound
