Evaluation of underground blast-induced ground motions through nearsurface low-velocity geological layers
Yonggng Gou, Xiuzhi Shi, Zhi Yu,c,*, Xiofeng Huo, Xinyng Qiu
a College of Civil and Transportation Engineering, Hohai University, Nanjing, 210098, China
b School of Resources and Safety Engineering, Central South University, Changsha, 410083, China
c Oulu Mining School, University of Oulu, Oulu, FI-90014, Finland
Keywords:Surface ground motions Underground blasts Geological site condition Amplitude attenuation Site response analysis
ABSTRACT Surface ground motion produced by underground blasts is significantly influenced by near-surface geological conditions.However, near-surface low-propagation velocity layers were always ignored in past analyses of ground motions due to their thin thickness.With the rising concern about surface ground motions produced by the ascendant scale and frequentness of underground excavation and mining, close attention is gradually paid to ground blast vibrations.Therefore, systemic experiments were conducted and took seven months in an underground mine to clarify the variation of motion from underground rock to surface ground.The attenuation of surface ground peak particle velocities(PPVs)is compared to that in underground rock, and horizontal amplitudes are compared to vertical amplitudes.Differences between bedrock and surface ground vibrations are analyzed to illustrate the site effect of near-surface lower-propagation velocity layers.One-dimensional site response analysis is employed to quantify the influence of different geological profiles on surface ground vibrations.The experimental data and site response analysis allowed the following conclusions: (1) geological site effects mainly produce decreasing dominant frequency (DF) of surface ground vibrations; (2) the site amplification effect of blast vibration needs to be characterized by peak particle displacement (PPD); (3) shear waves(S-waves) begin to dominate and surface Rayleigh waves (R-waves) develop as blast-induced ground vibrations travel upward through rock and lower-velocity layers to the surface.The comparison of response relative displacement to a critical value is best to assess the potential for cracking on surface structures.
1.Introduction
Ground motions produced by blast-induced rock fragmentation are undesirable phenomena that harm nearby structures and residents (Jayasinghe et al., 2017; Zhou et al., 2021).Control and analysis of surface ground motions from blasting have been challenges for mining, tunnel excavation, construction industries as well as regulatory agencies responsible for setting safety and environmental standards (Roy et al., 2016).In recent years, rapid increases in urbanization and depletion of shallow resources have led to growing tunnelling, underground construction, and underground mining in rock masses(Broere,2016;Gou et al.,2020;Yin et al., 2021).At the same time, concerns and complaints arise about surface blast vibration effects with the inevitably increasing underground blasting operations(Salum and Murthy,2019).These concerns have led industries and regulatory agencies to greater interest in assessing ground motions induced by underground blasts.
Generally, the intensity of blasting vibrations is quantified by peak particle velocity (PPV) and dominant frequency (DF).In practice,the traditional attenuation equation with either square or cubic root form of scaled distance (SD) is employed for ground motions induced by underground blasts (Wu and Hao, 2005; Roy et al., 2016; Rouse et al., 2019).However, two-dimensional (2D)theoretical analysis in the elastic, homogeneous isotropic halfspace rock medium indicated that surface ground PPVs are influenced by the reflected body primary waves (P-waves) and shear waves (or secondary waves, S-waves) at shorter distances.In
contrast, surface waves become significant at increasing surface distances from the buried charge point(Li et al.,2011).It means that even in the semi-infinite medium, without considering other factors,the cubic root form of scaled distance is reasonable for PPVs at shorter surface distances, while the square root form would be suitable for PPVs at more considerable surface distances.Even then,the simple empirical relationships still have poor performance because ground vibration induced by underground blasts is intricately controlled by many variables, such as charge loading condition,blast design,site geology,and stand-off distance(Lu,2005).Moreover, there is no appropriate relationship or equation to describe the frequency attenuation of ground motions until now.
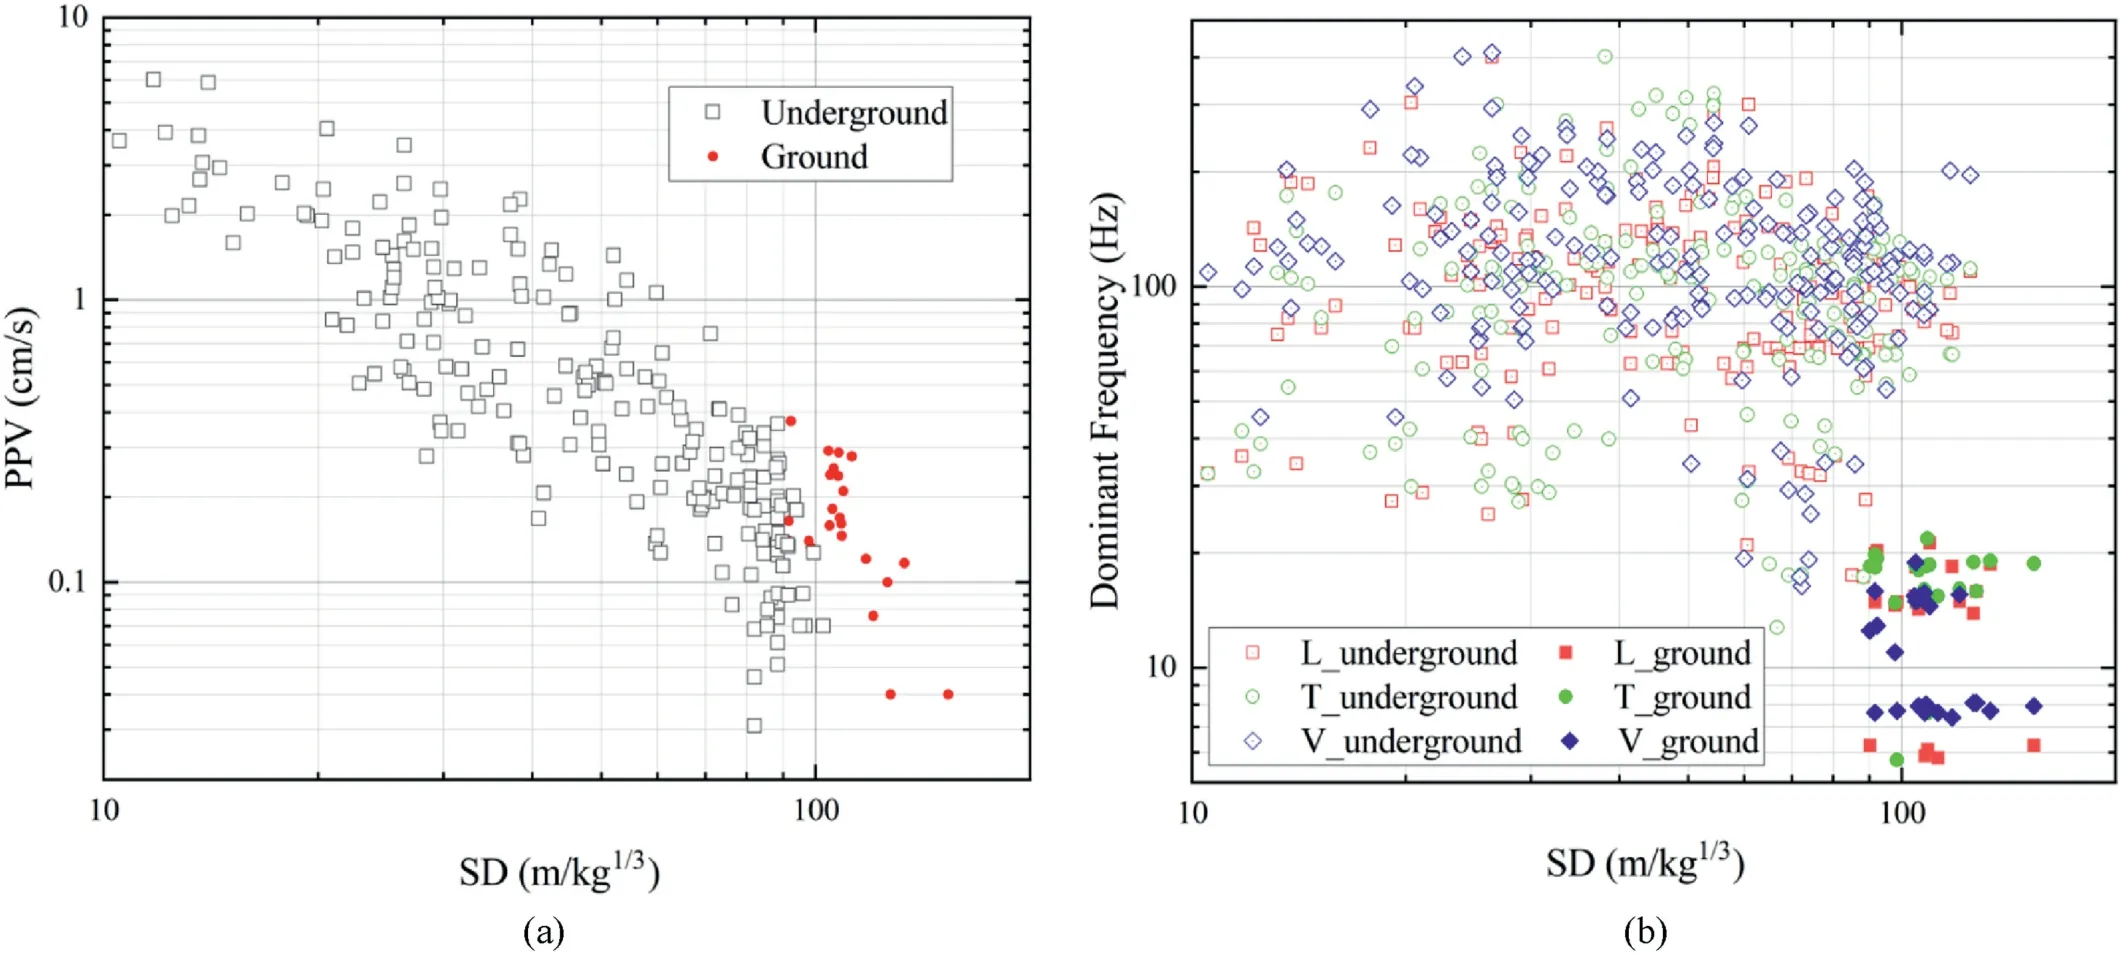
Fig.1.Comparisons of (a) vibration PPV and (b) DF between underground rock mass and ground surface.

Fig.2.Configuration of the experimental site and surface monitoring stations in Shaxi underground mine.The concentric circles are ground projection locations of the experimental stopes;both red lines(including stations O(epicenter),Z1,Z2,Z3,X1,X2,X3)were designed for monitoring blast vibrations at FTS,and four green lines(including stations OT (epicenter), KJ, E1, E2, C1, C2, W1, W2) were designed for monitoring blast vibrations at TQS.
Varying geology is a crucial reason for the preceding challenge of obtaining an appropriate attenuation relationship because ground motions generated by an underground explosive source can travel in a variety of directions and paths and are subject to attenuation,dispersion,reflection and refraction depending on the surrounding geological conditions (Ainalis et al., 2017; Amoroso et al., 2019).Attenuation equations considering some geological indices, such as uniaxial compressive strength (UCS), rock quality designation (RQD), and geological strength index (GSI), have been proposed by researchers to illustrate geological influence(Adhikari et al.,1999; Mesec et al., 2010; Kumar et al., 2016; Somodi et al.,2018; Li et al., 2019).Whether or not these studies are suitable for ground motions induced by underground blasts,there is still no widely accepted equation that illustrates the geological effect on ground motions (Yan et al., 2020).
To a large extent, lack of consensus results from the limited knowledge of the influence of near-surface lower-propagation velocity geological layers on surface ground motions, especially for underground blasts.For instance,the preceding study presented in Fig.1 showed that the DF drops from the underground rock to the ground surface even at the same SDs, while the PPV changes little(Gou et al., 2020).It is unclear whether these effects result fromeither surface wave or near-surface geological effects; the nearsurface geological effect is similar to the site effect in earthquake engineering.These challenges are illustrated by other recent studies.Jayasinghe et al.(2019) conducted six experiments at a location with 8 m of residual soil overlying granitic rock and concluded that the soil layer could reduce both amplitude and frequency.The PPV declined by 37.2% from the bedrock to the soil layer.Gui et al.(2018)employed the finite difference method(FDM)to compare changes in PPV from the buried blast point to the ground surface for rock-only and mixed rock-soil models.Modeling showed that the soil layer decreases the PPV and that the PPV changes with depth in a complex manner.Hijikata et al.(2004)excavated a 3 m deep pit, which was then backfilled with watersaturated sand, and the monitoring work was conducted with six adjacent bench shots.Ground horizontal acceleration was amplified in some cases and deamplified in other cases.

Fig.3.Geology of Shaxi mine.(a) Geological plan view of the monitoring area; the boundary of both ore blocks is encircled by dark red dashed lines.Seven black points are monitoring stations at FTS, and eight red points are monitoring stations at TQS.The box on the bottom right is a local magnification of location KJ, U, and hole ZKT503 with a distance scale.Both black lines represent the position of profiles A-A and B-B, respectively.(b) Profile A-A at FTS; (c) Profile B-B at TQS, and the red borehole is ZKT503.
The above-described studies show that attenuation of ground motions induced by underground blasts is still under scrutiny and requires further investigation.The effects of near-surface lowpropagation velocity strata are still unclear.Reasons for and implications of the decrease in DF at the surface are also unclear.To clarify these issues, systematic full-scale blasting experiments were conducted in an underground mine to produce subsurface and surface ground motions that could correlate to site geology changes.
This paper analyzes the measured surface ground motions resulting from the full-scale underground blasts.It begins by describing the underground ore blocks and the subsurface and surface geology.The full-scale stoping blasts and instrumentation programs are then defined.Attenuation characteristics of the measured ground motions are then comparatively graphed and analyzed.Differences in horizontal and vertical components are investigated.Effects of near-surface low-propagation velocity layers on measured ground motions are then studied with comparative amplitudes, response spectra, and 2D displacement time histories to identify wave types.The article then closes with analytical approaches to model the site amplification with shear wave site response and transfer functions.
2.Experimental details
2.1.Site description
The experiments were conducted in the Shaxi copper underground mine,80 km north of Hefei,Anhui Province in China.There are two main ore blocks shown in Fig.2: Tongquanshan (TQS) ore block and Fengtaishan (FTS) ore block.Both ore blocks adopt the bottom-up mining sequence,and the first mining level is-770 m to-650 m.The dissected stope is 80 m × 30 m × 60 m(length × width × height), and is mined with the large-diameter long-hole method combined with vertical crater retreat slotting and lateral caving (Gou et al., 2021).Blast experiments were conducted in two FTS stopes(F201 and F205)at level-650 m to-705 m and two TQS stopes (T105 and T109) at level -705 m to-770 m.
2.2.Site geology
Plan and cross sections or views of the geology are shown in Fig.3.Comparison of profile A-A in Fig.3b with profile B-B in Fig.3c shows that Quaternary soil covers a wide area at TQS whereas many old strata rocks are exposed at FTS.Quaternary soil consists of sand,clay and gravel.Geological logs state soil thickness ranges from 0 to 35 m.
Under the Quaternary soil layer,geological information at 200 m depth is provided to include the weathering crusts, which vary from 20 m to 100 m.Boring logs (such as Fig.4) show that the weathered crust contains abundant fractures and joints, and disintegrated kaolinized cores.The rock quality is poor,with a loss of cores during drilling.RQD ranges from 3% to 27%, with average statistical RQDs of 11% and 10% at FTS and TQS, respectively.Thus,the weathered crust belongs to classes V (completely weathered)and IV (highly weathered) in the classification of weathered rocks for engineering purposes(Dearman,1995;Ietto et al.,2018).Details of hole ZKT503 43 m away from location KJ are presented in Fig.4.
Under the weathering crust, both ore blocks are located in similar geology without great faults and fissures due to porphyritic magmatism (Zhou et al., 2015).It is assumed that below the weathered crust, propagation velocities are similar, although their mechanical properties have specific differences.Attenuation of blasting PPV and frequency was determined by assuming that the medium was isotropically homogeneous(Gou et al., 2020).
2.3.Experimental design
Experimental full-scale blast geometry is shown in Fig.5a.The maximum borehole lengths were 44.2 m at the FTS stopes and 55.1 m at the TQS stopes, respectively.The experimental blasts were conducted in the lateral zone with both spacing and burden of 3 m.Holes were detonated conventionally row by row, and the specific detonation sequences were in an experimental blast as shown in Fig.5b.However, owing to supporting pillars betweenrock drilling chambers, many slanted holes were arranged to replace vertical holes in several columns.Perimeter holes with small burdens (2 m) and large axial decoupling coefficient were detonated to produce a smoother face.

Fig.4.Geological information of hole ZKT503 adjacent to location KJ.
Explosive placement is also shown in Fig.5a.The emulsion explosive was placed in 0.4 m in length and 9 kg in weight.Double detonating cords were laid along the entire length of each borehole,and double detonators were attached to the detonating cords that connected these detonator fuses to the underground initiation network.Charging patterns of production holes differed from perimeter holes.Charge patterns in several holes were also adjusted to achieve the designed maximum charge per delay.The maximum charge per delay at the FTS for each blast was distributed evenly from 198 kg to 860 kg with a rough 50 kg interval, while it varied from 158 to 711 kg at the TQS.The total explosive weight in a blast round(generally no more than two rows)varied from 1122 kg to 4986 kg.
The detonation sequence was held constant.The design delay interval was 50 ms based on the available detonators in this mine.Delay numbers 1,3,5,7,9 and 11-20 were employed to maintain a 50 ms interval; an example of detonation sequences in an experimental blast is shown in Fig.5b.The design interval is affected by a delay error of 6%-10%.For delay#20,a 10%error would be 750 ms or 75 ms.Thus, the delays with the maximum charge were set within#1-#10 to reduce the effect of delay error.Some 30 blasts at FTS and 26 at TQS were carried out with this initiation sequence selected for analysis of the surface ground motions.
2.4.Monitoring work
As shown in Fig.2 and Table 1, surface ground motions were measured at 15 different locations;seven over FTS for four months then eight over TQS for three months.Locations O (FTS) and OT(TQS) were approximately directly above the experimental blasts.In addition,a station(U)was set on the mine ramp at level-140 m at TQS,as shown in Fig.3,to compare the ground motion variation from the mine bedrock to the surface.It is some 167 horizontal meters from ground location KJ.Rock properties from boring ZKT503 are assumed to be those of the rock transmitting motions from U to KJ.

Fig.5.Blast design for lateral blasts in the experimental stopes at the TQS:(a)Hole layout and charge patterns in the experimental stopes;(b)An example of detonation sequences in the experimental stopes.The arrow length of slanted holes increases with the decreasing angle between horizontal direction and hole direction.
As shown in Fig.2, these surface ground monitoring locations were selected at the neighboring villages and fixed on concrete floors adjacent to load-bearing walls of houses, except O and OT,located at two quarries.As shown by the photos of O and OT in Fig.2,all the soil has been removed from these locations.Elevations and distances from the stopes for each location are given in Table 1.These offset distances between the blasting sources and surface monitoring stations from 725.9 m to 1177.9 m at FTS,and 784.4 m to 1342.5 m at TQS except for U.
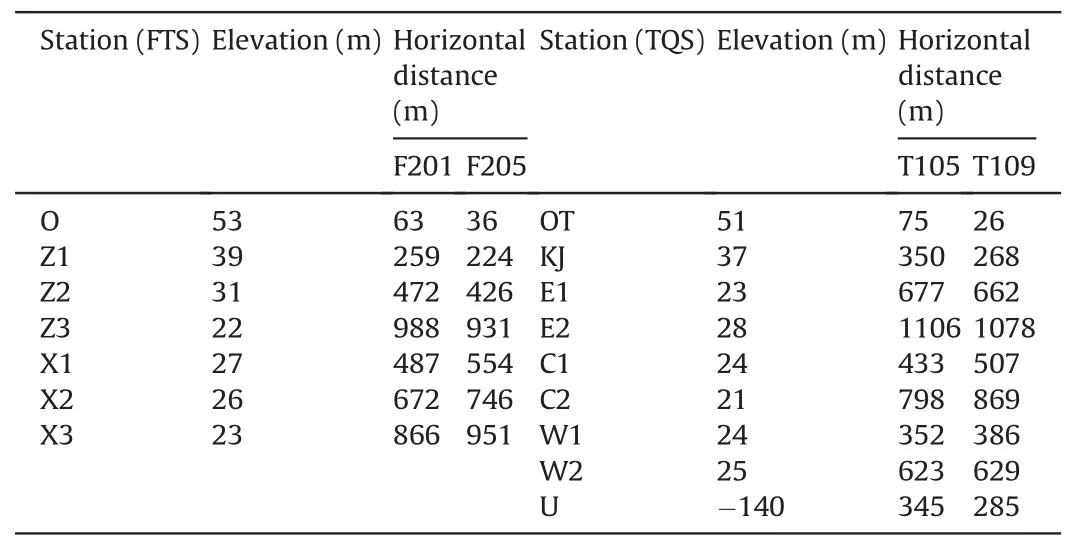
Table 1Elevations and horizontal distances from the experimental stopes at both ore blocks.
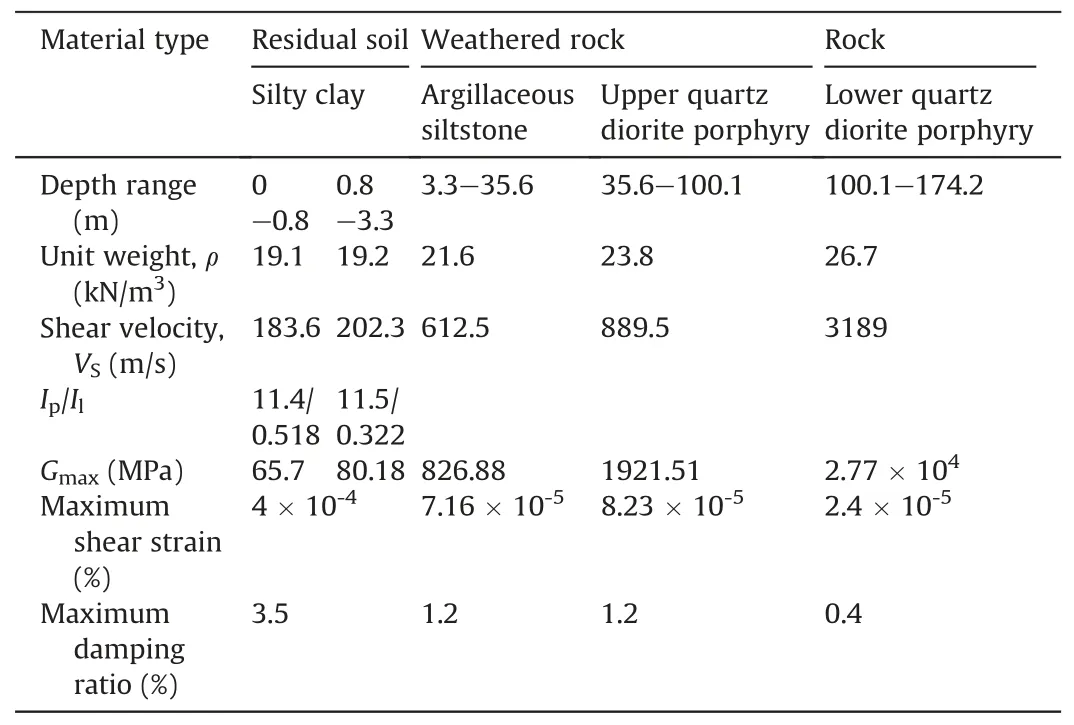
Table 2Properties of the residual soil, weathered rock and rock at boring ZKT503.
At each station, NUBOX-8016 intelligent monitor recorded the longitudinal (L), transverse (T) and vertical (V) components with electromagnetic geophones.These systems can measure particle velocities from 0.0047 cm/s to 35 cm/s with flat responses between 4.5 Hz and 350 Hz at 5000 samples per second.Consequently,169 time histories were recorded from 30 shots at the FTS,and 118 from 26 shots at the TQS.
3.Attenuation characteristics of surface ground motions
3.1.Vibration attenuation at both ore blocks
Attenuation is best studied with multiple stations and a single blast because the explosion source condition is constant for related monitoring locations.Only the stand-off distance of monitoring locations varies without considering geological influence.Fig.6 shows attenuation for 12 shots at block FTS, but PPV does not decline uniformly with the increasing distance for any one shot because of different geological conditions at related locations.It states that the PPV-distance relationship for a designated shot is seriously affected by geological conditions.Moreover, amplitudes vary from shot to shot because of differences in shot design and relief, and different travel paths slightly.For example, the case 432 kg presents higher PPVs resulting from the enormous burden,and the case 860 kg with lower PPVs was derived from overbreak of the last blast.
From another perspective, for a designated location, the geological condition is constant, and the independent variable is only the maximum charge weight per delay within the traditional SD attenuation equation.Thus,the PPVs at each location are further analyzed in Fig.7 to illustrate the attenuation of surface ground motions produced by variations of both shot details and travel path geologies.The traditional attenuation equation with cubic root form(R/W1/3)of SD is employed for graphing attenuation in Fig.7 based on its superior fitting coefficient compared to the square root scaling (R/W1/2) in the trial calculation (Duvall and Petkof,1959;Ambraseys and Hendron, 1968).The non-parameter statistical method, i.e.the Theil-Sen regression procedure, is employed toobtain their fitting results.Compared with the traditional fitting procedure (i.e.ordinary least squares (OLS)), the Theil-Sen regression has superior performance in fitting a line from data where the distribution is unknown or cannot be easily identified.Gou et al.(2021) have verified that this method can truly reflect varying blasting vibration, which is also hard to strictly assume that the data follow a normal distribution, and simultaneously, some extensive deviation data are inevitably presented.
The large scatter in SD graphs in Fig.7 displays the difficulties of combining the PPVs measured from other blasts with different travel paths.While it seems that distance and maximum charge per delay should account for both blast initiation details and geology along travel paths,in the final analysis,they do not include enough detail to reduce scatter.The large scatter does not for many reasons.The maximum charge per delay,W,does not account for energy per unit volume(powder factor),relief (burden and space for swelling during fragmentation), or initiation timing errors.Stand-off distance, R, alone does not account for changes in geology when the travel paths vary and thus have to cross different RQD zones.Nor does it account for changes in wave type.By comparison, the consistent trends displayed in Fig.6, where attenuation was investigated for each blast separately, show the importance of controlling the blast detail parameters.
Despite these overriding difficulties with scaled distance attenuation analyses,some conclusions can be drawn.As shown in Fig.7, the attenuation trends of X3 and E1 are different, even though both are spatially coincident but have different ore block travel paths.This indicates that PPV attenuation differs from ore blocks,resulting from different geology and blasting practice.Thus,both ore blocks are separately considered.At FTS, the attenuation slopes of the locations are similar within the range of-1.634 to-2.16 except O (-2.918), whereas the intercepts vary considerably.This similarity in slope indicates that the near-surface geological condition mainly affects the PPV amplitude level rather than the attenuation slope.At TQS, the attenuation slopes of surface locations vary more widely (from -2.395 to -3.349 except E2) than for FTS.A comparison of U and KJ data shows similar slopes.PPV levels at surface ground locations are slightly higher than that at underground U, despite the bedrock motions propagating upwardthrough weathered rock and mixed soil layer.However, it is not easy to clarify whether this increase results from the lowpropagation velocity layers,surface waves,or experimental scatter.

Fig.6.PPV variations of 12 shots at the FTS.Each line presents an individual shot with 7 stations of O, X1, X2, X3, Z1, Z2 and Z3, while these stations have been rearranged according to their distances from the explosion source.
3.2.Comparison between horizontal and vertical components
Generally, the horizontal component plays a crucial role in structure protection because shear failure easily occurs on structures.In earthquake engineering,researchers demonstrate that site geological conditions significantly affect horizontal components(Yaghmaei-Sabegh and Rupakhety, 2020), and the horizontal component is more remarkable compared with the vertical component as the site geological condition becomes soft.Conversely, the ratio between horizontal and vertical components decreases to 1 as the site geological layer tends to be hard rock(Kawase et al.,2019).However, there is no related literature about blast-induced ground motions.Therefore, the ratios of horizontal PPV(PPVH)to vertical PPV(PPVV)above FTS and TQS are illustrated in Fig.8.The PPVH is the maximum of L and T components.
These comparisons of PPVH/PPVV in Fig.8 demonstrate that it is difficult to establish a relationship between the ratio and the increasing distance (or the incident angle).The ratio of PPVH to PPVV varies significantly from location to location,and this mainly depends on the specific geological condition rather than distance or incident angle.More importantly, PPVH/PPVV is predominantly greater than 1,and the ratio range at FTS is smaller than that at TQS.According to the degree of softness of the site that is proportional to the ratio of PPVH/PPVV,the ratio difference results from weathered rock mainly exposed at FTS, while soil covers a wide area at TQS shown in Fig.3.Thus, it is necessary to pay more attention to the horizontal component of the ground vibration produced by underground blasts.
4.Site effect of near-surface low-propagation velocity layers
4.1.Motion variation from bedrock U to ground KJ
Variation in ground motion between bedrock (U) and ground surface(KJ)shown by the above analysis can be demonstrated moreclearly by the change of peak particle acceleration (PPA), velocity(PPV),and displacement(PPD)of each shot by the arrows in Fig.9.

Fig.7.PPV attenuation of each monitoring location and each ore block at(a)FTS and(b)TQS,respectively.Fitting results at C2 and OT are not given due to only 3 data at C2 and 5 data at OT, respectively.

Fig.8.Ratios of PPVH to PPVV at (a) FTS and (b) TQS with the same axis scale.
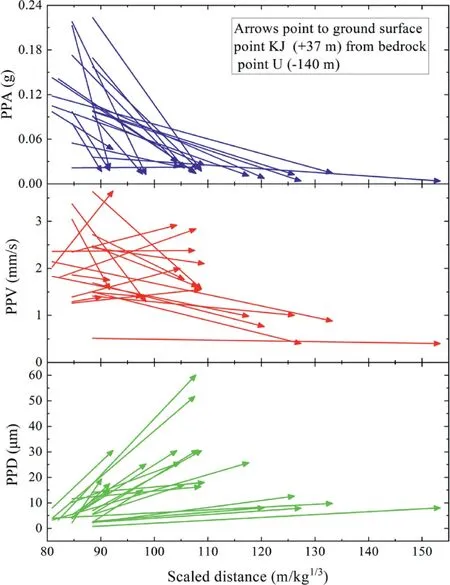
Fig.9.Variations of PPA,PPV and PPD from location U to KJ.Regarding each arrow,the beginning of the arrow is determined by the data of bedrock point U, and the arrow end depends on the data of ground point KJ.
As shown in Fig.9, the PPV does not necessarily increase from the bedrock to the ground for particular shots,although the overall PPV level increases slightly from point U to KJ,as shown in Fig.7b.Its amplification ratio varies from 0.27 to 1.83.Corresponding PPAs decrease while corresponding PPDs increase.This distinctive change of ground motions between U and KJ is more clearly illustrated in Fig.10 by their pseudo-velocity response spectra (PVRS),which are vibration responses of a structure calculated from the surface ground motions.Compared with conventional response spectra, the tripartite plot of PVRS is superior to simultaneously describe displacement, pseudo-velocity and pseudo-acceleration spectra, as shown in Fig.10 (Dowding,1996).Both comparisons of the single-hole shot (dashed red at U and solid red at KJ) and case Max (dashed blue at U and solid blue at KJ) are similar.They are similar to PPA, PPV and PPD comparisons in Fig.9, which result from a declining DF rather than a change in PPV amplitude.These changes demonstrate the importance of the observations in Fig.1,where the PPVs decrease unremarkably from underground to the ground surface, while the frequencies decrease significantly.This transformation differs from earthquakes, in which longer period earthquake motions may be closer to predominant site periods(Zhao et al., 2006), which results in less frequency variation when traveling upward through low-propagation velocity layers.For instance, PPA performance differs from acceleration amplification in earthquake engineering due to their different frequency bands.
Even though the L and T components of the single-hole shot differ at U, their PVRS shapes are similar.Furthermore, full-scale time-delay shots at KJ also have similar shaped PVRS as the single-hole shot,although they present more significant responses at 7 Hz.Spectral amplitudes for cases A-E in Fig.10 with the PPV amplitudes of 1.55-1.76 mm/s are concentrated in the band between the minimum and maximum cases.This consistency indicates that a specific location (KJ) with its unique geological condition results in the similar shape of its response spectra,while the response amplitude is determined by the ground PPV.Moreover,it implies that given the same amplitude at a specific location,the number of blast holes and the ordinary detonator delay sequence of these shots seem to have little effect on its response spectra, except in the 7 Hz range.
Considering that the PPV varies widely after traveling from the bedrock to the ground surface in Fig.9,PPV is not anappropriate index of the ground motion to assessitspotentialfor structural response and possible cracking.Relative displacement structural response forstructures (5-10 Hz) and walls (10-20 Hz) from the PVRS is more appropriate.It includes the effects of the entire waveform and thus includes amplitude and frequency considerations.When relative displacements exceed 0.254 mm(i.e.the dotted black line in Fig.10)(Dowding,1996),the ground motion has a potential risk to structures.The three cases with response spectra above 0.254 mm are associated with the observation of cosmetic cracks in wall covering.
4.2.Wave component associated with the frequency reduction
Figs.9 and 10 demonstrate that the substantial frequency reduction causes displacement amplification when vibration propagates upward through the near-ground low-velocity layers.This decreasing DF may result from not only the generated surface waves(always Rayleigh wave(R-wave)),but also low-propagation velocity layers (or the site effect).However, it is unclear which, if either, is responsible for reducing the DF of the surface ground motions.For instance,considering two conditions of the low-propagation velocity layer, only a weathered rock layer and a weathered rock and soil mixed layer exist at locations O and W2,respectively.Wave types in surface ground motions from single-hole shots at locations O and W2 are analyzed in Figs.11 and 12 to ascertain the low-frequency composition.Location O is in a quarry and is founded on only weathered rock.Location W2 covers the weathered rock and an approximately 10 m thick soil layer.In Figs.11b and 12b,displacement trajectories are employed to identify the R-wave component because R-waves follow an elliptic trajectory with a π/2 phase difference (Stein and Wysession, 2009).In addition, timefrequency spectra are plotted to observe the frequency distribution of waveforms by employing the S transform, which has superior performance on frequency localization(Stockwell et al.,1996).
At location O,Fig.11 shows that the R-wave is distinguishable in all three components(L,T,V)of displacement time histories due to their apparent phase differences.This R-wave also can be distinguished by the large radius displacement (in red) in the displacement trajectories.Since there is no surface soil layer,the R-wave is shown to be responsible for the significant displacement amplification.Furthermore,its time-frequency spectrum shows that the Rwave frequency is less than 30 Hz, whereas the body wave frequency is significantly higher within the range of 80-160 Hz.Nevertheless, it is difficult to identify the P- and S-waves.
As can be seen in Fig.12, at location W2, the R-wave is challenging to distinguish within its long time history, and the displacement trajectory shows that not only the R-wave but possibly an S-wave generates the maximum displacement.While the R-wave corresponds to the lowest frequency below 10 Hz,the Swave or the polarization displacement occurs at 15-27 Hz.Compared to location O (Fig.11) with the apparent frequency difference of body wave and R-wave, at W2, the S-wave frequency band occurs close to the R-wave.This duality implies that thethicker soil layer at least decreases the S-wave frequency.Thus,under some conditions (maybe thicker low-propagation velocity layers),both R- and S-waves have similar effects.

Fig.10.The pseudo-velocity(5%damped)response spectra at location KJ of the single-hole shot and representative full-scale time-delay blasts with the PPVs in the range of 1.5-1.8 mm/s.Pseudo-velocity on the Y axis, corresponding displacement coordinate (disp.) at 45° to the X axis, and pseudo-acceleration coordinate (accel.) at 135° to the X axis.For comparison, the presented are spectra of the single-hole shot at U (dashed red), the Max case at U (dashed blue), and three surface ground cases (i.e.Lhemkuler, Evansville and Spokane) associated with cosmetic cracking (Crum and Pierce,1995; Dowding,1996).Cases Max and Min are the blast events with recorded maximum PPV and minimum PPV at position KJ, respectively.
Consequently, it can be observed that the surface wave plays a key role for blast-induced surface ground motions, while the Swave also has a significant effect with specific properties and thicknesses of the soil layer.Unfortunately,the comparison of only two cases is not sufficient for this conclusion to be general without further investigation of the variation of ground motions through the low-propagation velocity layers.

Fig.11.Velocity and displacement time histories (a), displacement trajectories (b) and time-frequency spectra (c) at location O (on the weathered rock layer).
5.Site response analysis with depth
To clarify whether both R- and S-waves affect surface ground motions when blasting vibrations go through soil layers, the ideal analysis method is to establish the model of three-dimensional(3D) near-surface strata with inputting full-time wave history.However,two issues have not been solved at least until now.First,the establishment of 3D geological model is complex from the only information of geological drilling database.Even the dimension reduces to 2D, there are various optionally sectional profiles withdiffering geological distributions.Therefore, corresponding to different results of wave propagation, which one profile should be appropriately selected is a problem.Second, the full-time input history on the bedrock includes P- and S-waves, and S-wave contains shear vertical (SV-waves) and horizontal waves (SH-waves).The P- and SV-waves involve particle motion perpendicular to the plane of geological interfaces.In other words,propagation of P-and SV-waves is associated with the variability of geological interfaces and distribution.The P- or SV-wave also could produce both reflected and refracted P- and SV-waves (i.e.an incident P-wave (or SV-wave) would not only generate the reflected P- and SV-waves but also the refracted P- and SV-waves), simultaneously both further produce surface waves.Consequently,the entire waveform inputting to the model is challenging (Aki and Richards, 2002;Bowden and Tsai,2017).Moreover,even a method could reflect the variation of ground motions,it is still hard to distinguish the effects of R- and S-waves because the model should be verified to have a similar performance to the measured waveforms.
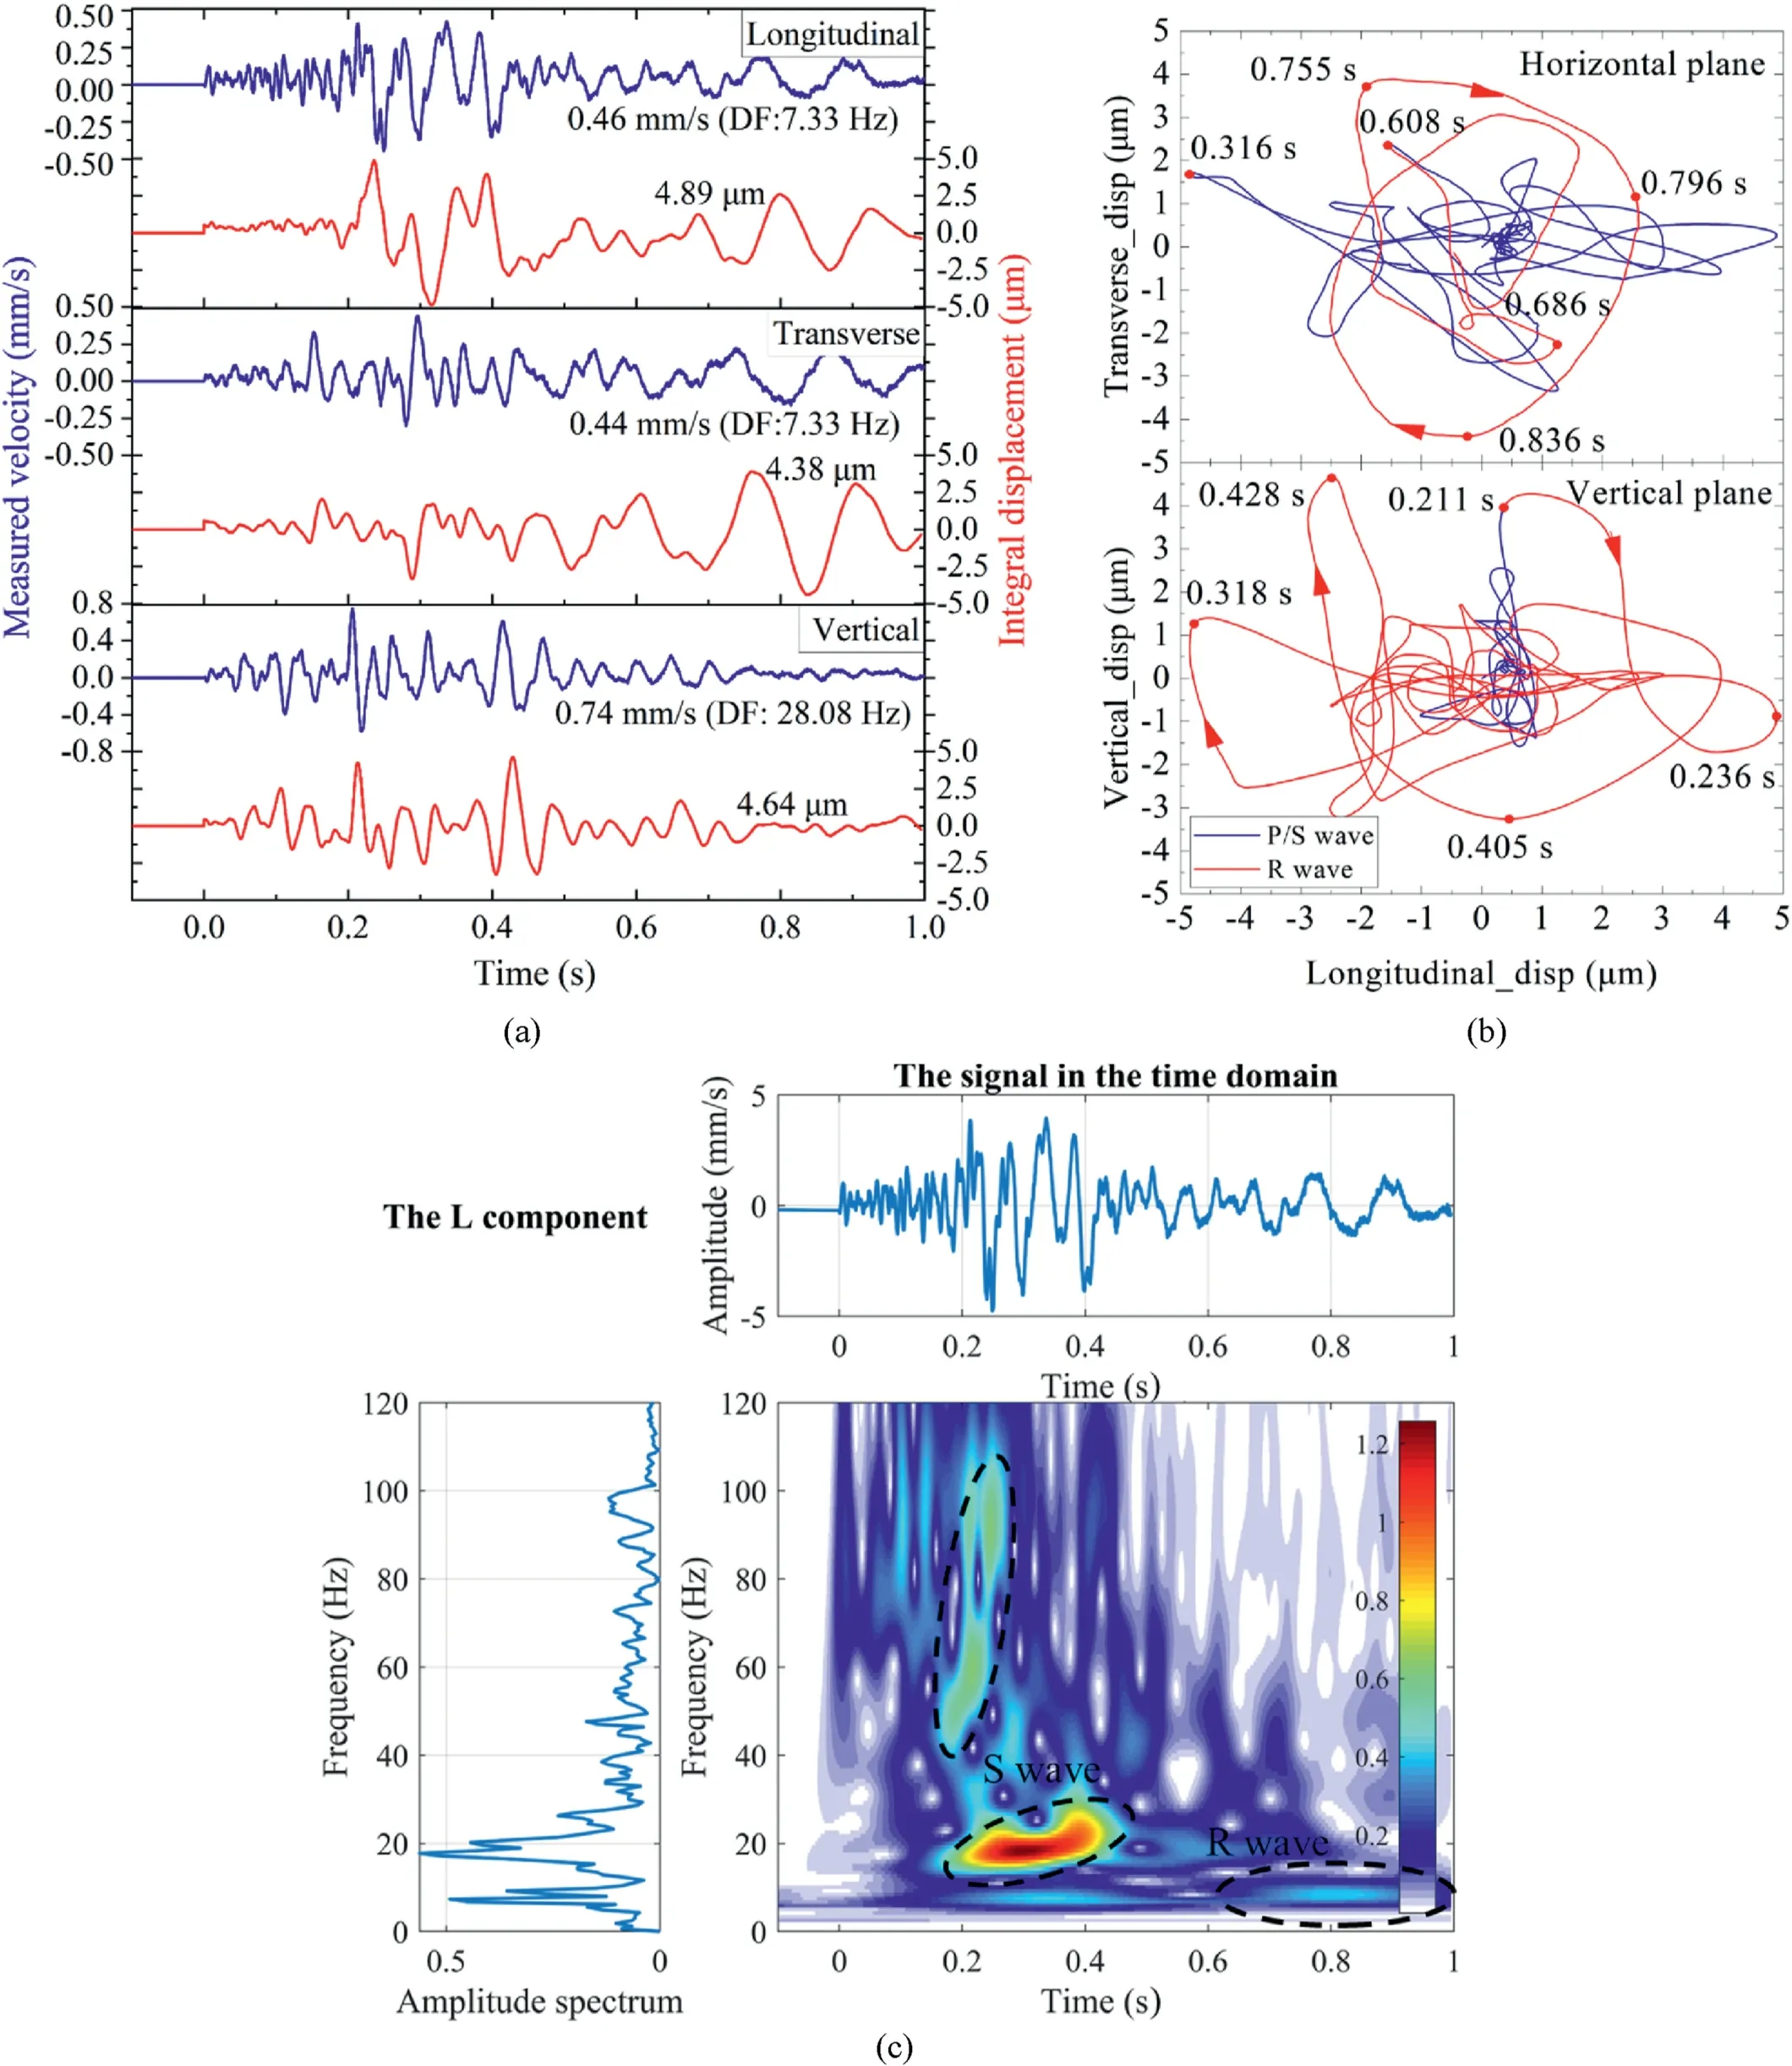
Fig.12.Velocity and displacement time histories(a),displacement trajectories(b)and time-frequency spectra(c)at location W2(on the weathered rock and maximum thickness soil layer).
Since there is no doubt about the effect of R-waves on ground motions irrespective of the influence degree of soil layer on this,because in any case, blast vibration is bound to generate surface waves (at least R-waves) as it propagates to the ground surface boundary;we need to clarify whether there is the effect of S-waves induced by soil layers.In virtue of the SV-waves are associated with R-wave and is challenging to make it clear,and Fig.8 states that the horizontal components play a more critical role in surface ground motions, the SH-wave is the key for surface ground motions from near-surface site geology;this has been defined as the site response analysis in the earthquake engineering.The incident SH-wave does not involve particle motion perpendicular to the interface.Thus only the reflected and refracted SH-waves are generated (Kramer,1996).Over the past few decades, sophisticated site models have been proposed in the frequency domain (mainly equivalent linear analysis)or time domain(mainly nonlinear analysis).In this paper,considering that only accurate information of a borehole next to positions KJ and U was obtained, the one-dimensional (1D)response analysis is employed.Regarding blasting vibrations featured by high-frequency, the equivalent linear frequency domain analysis method would underestimate high-frequency responses (Idriss and Sun, 1992; Ding, 2010; Bolisetti et al., 2014);thus, the nonlinear 1D time-domain analysis is employed thereinafter.
5.1.Nonlinear site model and its parameters
The site response analysis program DEEPSOIL V7.0 is undertaken to investigate the variation of motions caused by the surficial lowvelocity layers(Hashash et al.,2020).This program was developed by Hashash et al.(2020) at the University of Illinois Urbana-Champaign.It can perform 1D linear, equivalent-linear, and nonlinear site response analyses,while the program stands out and is well-known for its excellent performance of time-domain nonlinear analysis (Bolisetti et al., 2014).The procedure of calculating site response to blasting vibration in DEEPSOIL mainly includes (1) establishing the site profile with multiple geological layers; (2) definition of layer properties; (3) input motion on the bedrock;(4) definition of analysis controls; (5) results and output.The waveform at U of the single-hole shot was employed as the bedrock input motion could then be compared with the measured motions at KJ.Site response was then calculated with subsurface geological profiles provided by the adjacent hole ZKT503.It should be noted that the method assumes that this model boundaries of all layers are horizontal, and responses in low-propagation velocity strata are produced only by SH-waves propagating upward(Kramer,1996).The model cannot simulate P-, SV-wave propagation or R-waves, but it does simulate horizontal shear waves and does create a significant shift in DF.
Basic layer properties were measured from the core record of boring ZKT503 and are given in Table 2.Some properties had to be estimated.The Masing rule (one of the well-known hysteresis rules)had to be employed to define the nonlinear backbone shape between shear strain and shear stress of model materials(Kramer,1996).The Darendeli model was used for setting the material stress-strain and damping curves of soil and weathered rock layers.Regarding the underlying rock/bedrock layer, the example and tutorial of DEEPSOIL indicate that DEEPSOIL could model this(Hashash et al.,2020).Thus,the Idriss Rock model is used to define the rock layer’s stress-strain and damping curves (Idriss and Sun,1992; Darendeli, 2001).The given curves of modulus reduction and damping ratio of soil, weathered rock, and rock are shown in Fig.13.
Since this is a time-domain site response analysis,the maximum allowable frequency f of each layer was determined by (Dowding,1996):
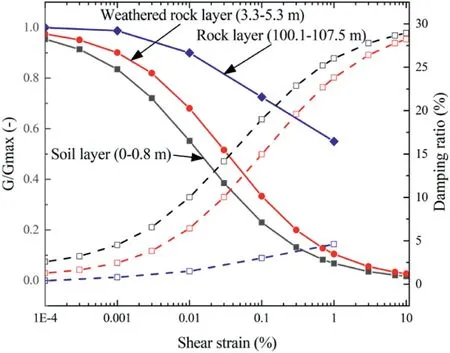
Fig.13.Curves of modulus reduction and damping ratio of soil, weathered rock and rock layers.Curves with filled marks are G/Gmax (ratio of shear modulus to maximum shear modulus), and the dashed curves with hollow marks are damping ratios.
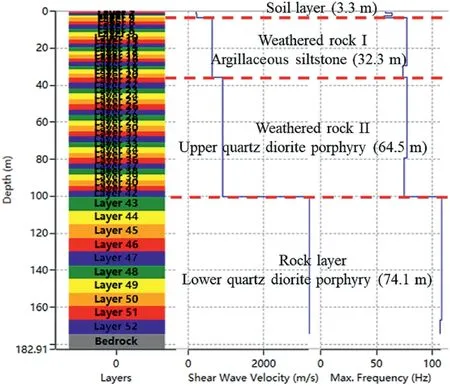
Fig.14.Site profile for the model with rock,weathered rock,and 3.3 m soil layers.Note that the bedrock shear wave velocity is the same as 3189 m/s as the rock layer.
where H is the layer thickness.To increase f, the thickness of the layer should be decreased based on the thickness should be shorter than 1/4 of the S-wave length in Eq.(1).Since blast-induced DFs range from 1 Hz to 40 Hz for soil layer and 10 Hz to 100 Hz for rock(Dowding,1996),each geological layer in Fig.3 was subdivided into sublayers to ensure that the maximum f is more than 40 Hz in the soil layers, and beyond 75 Hz in the weathered rock layers and 100 Hz in the rock layers,respectively.Consequently,52 layers were established with depth from the underground U to ground KJ as shown in Fig.14.
Properties of the bedrock and measured surface waveforms are essential since they serve as input for and comparisons with the site response model.The measured waveform of the single-hole blast at U is used as input.It and its displacement trajectories are illustrated in Fig.15.The P-wave is dominant in the vertical component,whereas the S-wave is dominant in the horizontal components.Displacement trajectories show that surface waves are negligible because U is located in the mine tunnel.The large-amplitude SHwave acceleration of the L component (encircled by a rectangle in Fig.15) is extracted as the input motion.
Surface ground motions calculated with DEEPSOIL are compared to the measured full-waveform L component at KJ in Fig.16.The displacement trajectory of the measured waveform in Fig.16b indicates that the S-wave is difficult to distinguish.Time history comparisons in Fig.16a show the significant differences between measured and calculated waveforms.While the simulated S-wave components fluctuate with similar low frequencies, amplitudes vary.Compared with the input motion (gray curves), the calculated ground response acceleration amplitude decreases,whereas the velocity and displacement amplitudes increase.These peak amplitudes are more significant than that of the measured waveform.A comparison of response spectra of calculated and measured surface ground motions in Fig.17 shows that the main difference is the response amplitude.The DF of calculated and measured motions are in closer agreement.
The differences and similarities may result from the following reasons: (1) properties of the soil, weathered rock and rock were obtained from several cores in geological drilling holes, respectively,and these cores are hard to represent the variable property ofeach layer; (2) description of the log in Fig.4 shows that the weathered rock layers contain many discontinuities (e.g.disintegrated rock pieces, fissures and fractures), which significantly affect the propagation of high-frequency motions; (3) geological conditions at boring ZKT503 may differ from those at location KJ because there is 43 m distance between both.
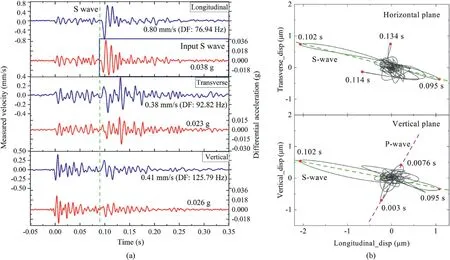
Fig.15.Velocity and acceleration time histories (a), as well as the displacement trajectories (b) at U measured from the single-delay/hole shot.
5.2.Site effect of different geological profiles
Although the initial simulation model, which is based on estimated properties, produces ground motions that vary from those measured waveforms, it does return the lower DF.In order to investigate the effectiveness of the site response model, two other profiles were investigated.The profiles shown in Fig.18 were chosen for analysis.Properties shown in Table 2 were employed,but waves varied in thickness as shown in Fig.18.The layer thicknesses of each model were adjusted according to Eq.(1).The calculated surface ground motions are added and shown as the PVRS form in Fig.17.

Fig.16.(a) Comparison of the simulated surface ground S-wave and measured fullwaveform of the L component at KJ; and (b) Measured horizontal displacement trajectory at KJ.
Variations of the near-surface low-propagation velocity layers can produce significant variations in the ground motion calculated with DEEPSOIL.As shown in Fig.17, the surface ground motion of the only rock model increases its amplitude with little change in the frequency range.A mixed model (rock and soil) mainly decreases the frequency to a lower band, and the only soil model significantly decreases the frequency band and amplitude.Thus,layer thickness and properties changes can significantly affect the calculated surface motions.
To further understand variations of ground motions in depth,profiles of calculated PPA, PPV, PPD and DF from the three models are shown in Fig.19.As can be seen, the response amplitudes of different geological profiles differ.Nevertheless,some combination of the dynamic properties incorporated in the soil and mixed profiles would produce PPA,PPV and PPD that would more closely match the measured values.The mixed model most closely matched the DF at the surface.
The only rock model demonstrates that PPA-PPD first decreases slightly, but as the depth decreases into a specific range, they fluctuate with depth and approach the maximum at the ground surface due to the surface boundary.Their surface ground amplitudes are twice the amplitudes at a depth of 50 m.Regarding the only soil model, the rock-soil interface raises these amplitudes at the front of the interface, whereas the amplitudes drop after this interface due to the significant difference between rock and soil wave impedance.However, there is no soil amplification except ground surface effects shown in the local enlargement.
The mixed model demonstrates that PPA-PPD amplitudes decline as the motions radiate upward,with the PPA declining the most, while these amplitudes increase as the motions travel through the 3.3 m soil layer.The geological interfaces also affect amplitude variations,but this influence becomes weaker due to the decreasing difference in wave impedances.The amplitude attenuation rates increase in the weathered rock layer compared to the rock layer, while this faster attenuation inversely generates the maximum PPD among the three models.This results from the decreasing DF in the mixed model because the transformation from acceleration to velocity(or displacement)is inversely proportional to the frequency (Gou et al., 2019).The DF profile proves that the low-propagation velocity layers decrease the S-wave DF compared to oscillating DFs in the only rock medium that may result from the vibration superposition between the upward waveform and the reflected downward waveform.The degree of reduction depends on geology properties.
The relationshipbetween the site effect and wave frequencycanbe demonstrated with the transfer functions between surface response and the input motion for the three models in Fig.20a.The transfer function is the ratio of surface displacement amplitude to input motion displacement for each given frequency, while it is the same for velocity and acceleration based on the differential relationship at any specific frequency(Kramer,1996).Moreover,the transfer function at the weathered rock-soil interface in the mixed model is added to ascertain the effect induced by the top 3.3 m soil layer at KJ.
As shown in Fig.20a, the surface ground response highly depends upon input motion frequencies.Specifically, in the rock model, the amplification occurs periodically as the input motion frequencies correspond to the local frequency maxima of natural frequencies (Kramer,1996).In the soil model, slight amplification occurs as the frequency below 10 Hz.This explains why the soil amplification is insignificant for blast-induced motions featured by high-frequency.The de-amplification with frequencies beyond 10 Hz also states why the response amplitudes in the soil layer are close to zero.In a sense,the soil model can be viewed as a lowpass filter.However,in the mixed model,the weathered rock layer has a slight amplification as the input frequencies below 55 Hz,and then the 3.3 m soil layer further amplifies low-frequency components in frequencies below 15 Hz and 25-35 Hz.This low-frequency amplification shows that the gradual decreasing propagationvelocity of near-surface layers not only reduces high-frequency motions,but also leads the site response to a wider frequency band.

Fig.17.PVRS of surface ground motions from different models compared to the measured values.Note that the curves of “The only rock model” and “The only soil model” are plotted based on the following models in Fig.18.
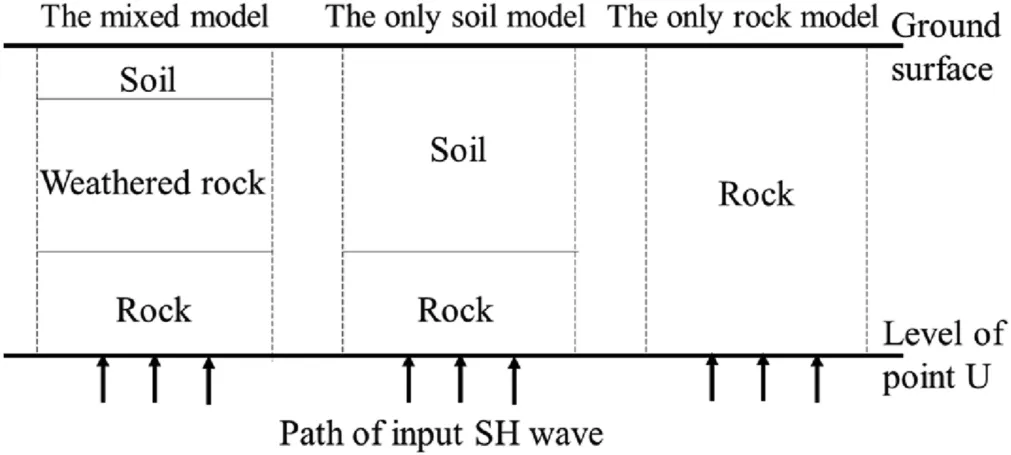
Fig.18.Profiles of three different models.
6.Discussion
Surface ground motions induced by underground blasts have been shown by attenuation analyses to be affected significantly by the near-ground geology.DFs decrease from the bedrock motions,and ground displacement is amplified.In order to ascertain what geological phenomenon is responsible,it was necessary to analyze the effect of various near-ground lower-propagation velocity geological conditions, including the weathered rock layer and the weathered rock with a soil layer.Ground motions at location O on the fresh weathered rock were compared to those at location W2 on weathered rock and maximum thickness soil layer.The comparison shows that the R-wave is dominant at location O, while both S- and R-waves influence low-frequency components at W2.At location KJ, the S-wave is absent, as seen by comparing displacement trajectories in Figs.12 and 16.The lack of shear wave content may result from the thin (less than 3.3 m) layer of soil,which substantiates the importance of soil thickness for generating S-wave content.
Underground motions at location U produced by a single delay were employed to produce output motion at KJ with a shear wave site response model.Three profiles were employed to produce simulated surface ground motions, including rock, rock and soil,and rock, weathered rock and soil with the same input motions.Although the simulated responses at KJ differ from the measured waveform in amplitude,they are consistent with the experimental observation of the lower DF.The near-surface lower-velocity layer decreases the S-wave DF.However,the site amplification of ground motion amplitudes presented in Fig.19 shows that the amplification depends on specific properties of the geological profile.This dependency explains why some research has concluded that an upper low-velocity layer would decrease PPV, while the others found that PPVs were amplified.Thus without precise knowledge of the properties of the upper low-velocity layers, surface ground motions could not be predicted accurately with shear wave analysis models.In addition and more fundamentally,they cannot produce surface or R-waves.
The transfer function between U and KJ further illustrates why the DF decreases and whether or not there is site amplificationunder variable geological conditions.The transfer function of the single hole shot for measured ground motions is further compared in Fig.20b to the simulated transfer functions of the ground motion for a 3.3 m depth of soil and the mixed model.The measured transfer function is similar to the others in the 10-20 Hz frequency range.It is most similar in the 5-10 Hz range for the depth of 3.3 m in the mixed model.However, this measured ground motion consists of P-,S-and R-waves,while shear wave amplification models produce ground motion S-waves and thus cannot reproduce P-and R-wave type ground motions.Care must be taken with the comparison in Fig.20b with the presentation with a log scale as it conveys the impression that there is no considerable difference in the transfer functions between measured (with R-waves) and simulated(without R-waves).Bowden and Tsai(2017)developed a surface wave model and found that transfer function peaks of the Rwave are close to those of the S-wave for lowered DF in earthquake ground motions.More research is required to determine the Rwave site effect for blast-induced motions because of their one to two orders of magnitude higher DFs.
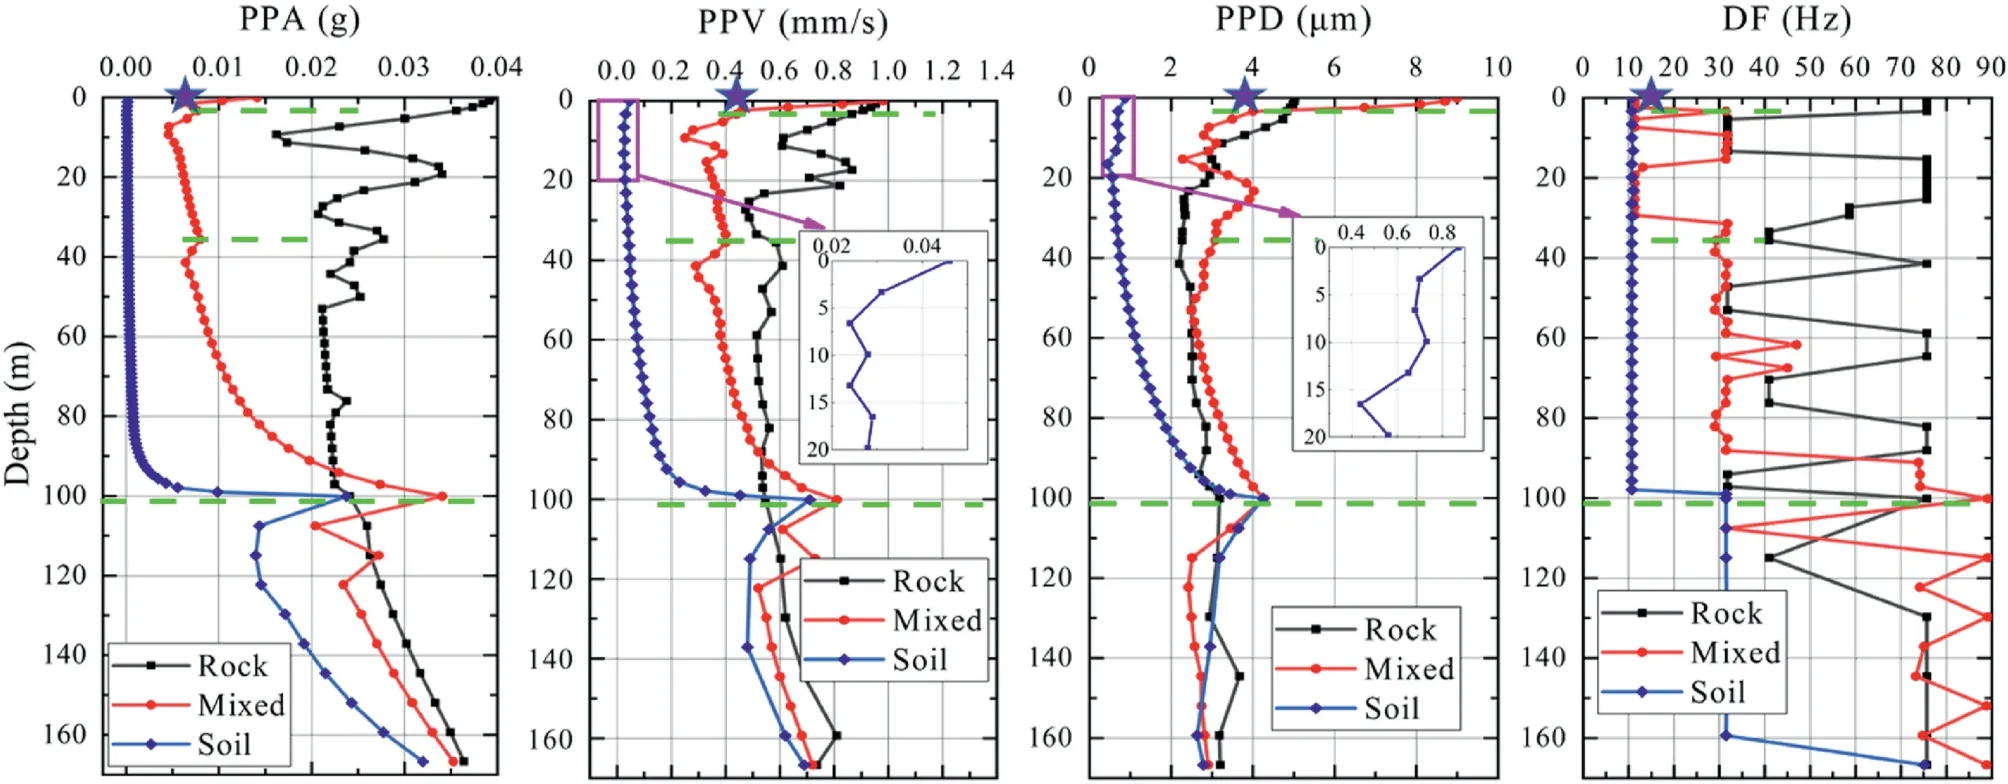
Fig.19.Profiles of calculated PPA,PPV,PPD and DF with depth in three models.The asterisk mark is the measured values at KJ.In the legend,‘Rock’is the only rock model,‘Mixed’is the soil and weathered rock mixed model, and ‘Soil’ is the only soil model.

Fig.20.(a)Transfer functions of different geological models;and(b)Comparison of the transfer functions of the single measured delay and simulated S-waves in the mixed model.Note that the depth of 3.3 m in the mixed model is the weathered rock-soil interface.
Shear wave amplification models demonstrate that ground motions are affected by variations in shear stiffness, thickness,input motion and ground reflection.This geological complexity is also responsible for the lower fitting coefficients of the scaled distance attenuation equations of the surface ground motions in Fig.7.It also demonstrates the difficulty of determining a uniform equation of ground motion attenuation.
More importantly for PVRS, Figs.9 and 10 demonstrates why PPV attenuation is not helpful because the relative displacement structural response is proportional to both the ground PPV and the DF.This frequency dependency is why blasting safety standards consider both ground PPV and dominant excitation frequency(Singh and Roy,2010).Unfortunately,the determination of DF is not straightforward.For example,the China standard divides frequency into three bands(f <10 Hz,10 Hz <f ≤50 Hz and f >50 Hz)(Luet al., 2012).Applying such a standard is difficult when excitation ground motions contain pulses with significant amplitudes at frequencies in several bands.Alternatively,Fig.10 shows that response relative displacements calculated from the full time histories can be employed directly in the range of the natural frequencies of structures and walls(5-20 Hz).Thus,comparing response relative displacement to a critical value can be employed to assess the potential for cracking,even with multiple significant pulses of varying amplitudes.
Inevitably, certain limitations also exist in the empirical attenuation relations and site response analysis.PPV attenuation is based on the traditional scaled distance equation using the nonparameter statistical method.It does not mean this equation is the best form to describe surface ground PPV attenuation,but how to consider other factors(e.g.blast initiation details,travel path and topographic effects) to propose new attenuation equations for ground vibrations needs more detailed investigation.While the site analysis model employed the provided S-wave velocities and weathered rock and soil thickness according to the closest drilling hole, some properties are estimated based on existing models.More studies are required to accurately predict surface ground motions with precise knowledge of the properties of the upper low-velocity layers.The site response analysis also could not account for the generation of surface waves.The site response analysis of the R-wave or full-waveform site effect for blasting vibration needs further research.
7.Conclusions
Properties of the ground motion induced by underground stope mining blasts were investigated and defined with full-scale field experiments at two ore blocks and subsequent nonlinear site response analysis.Scatter in the nonparametric statistical regression of the traditional scaled distance attenuation equations limited conclusions that could be drawn concerning surface motions produced by deep sub-surface blasting.However,they do demonstrate the importance of the near-surface low-propagation velocity layers,and the ratio of horizontal to vertical PPV is also influenced by geological site conditions.Then the site effect of near-surface lowpropagation velocity layers is analyzed from motion variation,wave component,and different geological profiles.These analyses allow for the following conclusions:
(1) PPV cannot attenuate with distance uniformly even for the designated blast due to the near-surface low-geological layers.The near-surface geological condition mainly affects the PPV amplitude level rather than the attenuation slope.Moreover, the PPV attenuation at a specific location is significantly influenced by travel paths.
(2) As blast vibrations travel upward through rock and lower velocity layers to the surface,S-waves begin to dominate and surface R-waves develop.The DF declines significantly compared with periodically oscillating DFs in the only rock medium.This leads to PPV not necessarily increasing from bedrock to ground while corresponding PPAs decrease and PPDs increase.
(3) The shape and DF of the PVRS at a specific location were found to be determined by the geological site condition,while the response amplitude depends on the ground PPV irrespective of the number of holes and delay sequence(including any errors).Surface structures could be best protected by confirmation of modeled responses by direct measurement of surface ground motions and response spectrum analysis when necessary.
(4) Surface ground response depends on not only the geological profile but also the input motion, as shown by the transfer function between rock mass and surface motions.The gradual decreasing propagation velocity of near-surface layers not only reduces high-frequency motions, but also amplifies low-frequency components.While the only soil model significantly decreases the frequency and amplitude because of the significant difference in rock-soil wave impedance.
Declaration of competing interest
The authors declare that they have no known competing financial interests or personal relationships that could have appeared to influence the work reported in this paper.
Acknowledgments
The authors would like to thank Charles H.Dowding for his help during this study.This work was supported by Natural Science Foundation of Jiangsu Province,China(Grant No.BK20220975)and the National Natural Science Foundation of China (Grant Nos.51874350 and 41807259).
 Journal of Rock Mechanics and Geotechnical Engineering2023年3期
- Journal of Rock Mechanics and Geotechnical Engineering的其它文章
- Development of mathematically motivated hybrid soft computing models for improved predictions of ultimate bearing capacity of shallow foundations
- A post-peak dilatancy model for soft rock and its application in deep tunnel excavation
- Numerical simulation of fatigue crack propagation in heterogeneous geomaterials under varied loads using displacement discontinuity method
- Combined load bearing capacity of rigid piles embedded in a crossanisotropic clay deposit using 3D finite element lower bound
- Long-term decay of the water pressure in the osmotic tensiometer
- Predicting and validating the load-settlement behavior of large-scale geosynthetic-reinforced soil abutments using hybrid intelligent modeling
