Influence of inter-grain cementation stiffness on the effective elastic properties of porous Bentheim sandstone
Bin Chen, Jiansheng Xiang, John-Paul Latham
Department of Earth Science and Engineering, Faculty of Engineering, Imperial College London, London, SW7 2BX, UK
Keywords:Porous sandstone Cohesive finite element model Grain-based model Rock microstructure Micro-computed tomography (CT)
ABSTRACT Effective elastic properties of porous media are known to be significantly influenced by porosity.In this paper, we investigated the influence of another critical factor, the inter-grain cementation stiffness, on the effective elastic properties of a granular porous rock (Bentheim sandstone) using an advanced numerical workflow with realistic rock microstructure and a theoretical model.First,the disparity between the experimentally tested elastic properties of Bentheim sandstone and the effective elastic properties predicted by empirical equations was analysed.Then, a micro-computed tomography (CT)-scan based approach was implemented with digital imaging software AVIZO to construct the 3D(three-dimensional)realistic microstructure of Bentheim sandstone.The microstructural model was imported to a mechanics solver based on the 3D finite element model with inter-grain boundaries modelled by cohesive elements.Loading simulations were run to test the effective elastic properties for different shear and normal intergrain cementation stiffness.Finally, a relation between the macroscale Young’s modulus and inter-grain cementation stiffness was derived with a theoretical model which can also account for porosity explicitly.Both the numerical and theoretical results indicate the influence of the inter-grain cementation stiffness,on the effective elastic properties is significant for porous sandstone.The calibrated normal and shear stiffnesses at the inter-grain boundaries are 1.2 × 10⁵ and 4 × 10⁴ GPa/m, respectively.
1.Introduction
Macroscale properties of geomaterials are strongly dependent on its microscale structures and mineral properties.How to reproduce the macroscale properties from the microscale characteristics has attracted great attention in recent years (Andrä et al.,2013a; Chen et al., 2019, 2020; Qu et al., 2019; Liu et al., 2020;Das et al., 2021; Diamantis et al., 2021).It is well known that the effective Young’s modulus of a porous medium E is significantly influenced by the porosity and the Young’s modulus of the matrix E0(Ramakrishnan and Arunachalam, 1993; O’Rourke et al., 1997;Drach et al.,2016; Yu et al.,2016).However, some studies indicate that the pores may not be the only factor leading to the reduction of E0to E for granular porous media (Andrä et al., 2013a; Shulakova et al., 2013; Saenger et al., 2016; Saxena et al., 2017; Wetzel et al.,2018).Indeed, an explanation of the underlying mechanisms of the observed elastic behaviour that is not due to the pores is a prerequisite to the new generation of powerful microstructural models of both granular and interlocking crystalline rocks.The accurate capture of the macroscopic Young’s modulus is the foundation upon which such microstructural models can then be extended to simulate more complex inelasticity, e.g.brittle fracture and postpeak behaviour.
Many theoretical and empirical relationships have been developed to estimate the effective Young’s modulus of porous media(Spriggs,1961;Zimmerman,1985,1991; Pabst et al., 2006; Choren et al.,2013;Yu et al.,2016).In these models,porosity is considered as the only factor to explain the difference between the Young’s modulus of the solid and that of the porous medium.Theoretical models normally assume a binary mixture of solid and void,where the solid material is homogeneous and isotropic with idealized microstructure to represent the voids (e.g.regular pore shape)(David and Zimmerman, 2011a, b).Motivated by the inability of these models to predict the effective Young’s modulus of the porous sandstone in our experimental results, these effective medium theories were briefly re-examined in this study.Compared with the analytical approaches, numerical approaches are a more accurateway to predict the effective Young’s modulus of geomaterials with complex pore shapes.To compute the effective Young’s modulus numerically, the skeleton of the porous media needs to be constructed first and then the Young’s modulus is solved with specific numerical approaches, such as the finite element method (FEM).Digital rock physics based on micro-computed tomography (CT)has been extensively used to construct the microstructure model of the geomaterials(Andrä et al.,2013b;Shulakova et al.,2013;Saxena et al., 2017; Wetzel et al., 2018).The microstructure model can be constructed through a direct“voxel to finite element”transcription(Andrä et al., 2013a; Wetzel et al., 2018), but will lead to a great computational cost in three-dimensional (3D) models.An alternative way is to regenerate a much coarser mesh with a series of processes including segmentation, surface and volume mesh generation(Shulakova et al.,2013).Some other approaches to present the microstructure of the porous media in the numerical model include the stochastic reconstruction methods such as the random fields theory (Paiboon et al., 2013) and software packages (Pabst et al., 2018), but cannot guarantee the accurate representation of the microstructure characteristic critical to the mechanical behaviours.Diverse numerical approaches (e.g.FEM, finite difference method, Fourier-based Lippmann-Schwinger method), have been adopted to solve the effective Young’s modulus from the microstructure model (Andrä et al., 2013a; Saxena et al., 2017; Wetzel et al., 2018).A key drawback of the numerical models presented above is that the grain contacts and microscale cracks are not accurately presented and simulated, leading to overestimation of the effective elastic Young’s modulus of granular porous rock(Shulakova et al., 2013; Saenger et al., 2016; Saxena et al., 2017;Wetzel et al.,2018).In addition,the artificial parameters used in the CT image processing may also lead to deviations (Saxena et al.,2017).
An ideal numerical model for investigating the effective Young’s modulus of porous rock requires a microstructural model with both pores and inter-grain boundaries accurately presented and a suitable numerical solver.The concept of grain-based model(GBM)has been put forward to present the grain-scale interaction along with different kinds of numerical methods including particle flow code(PFC) (Zhang et al., 2019, 2020; Zhou et al., 2019; Bahrani and Kaiser, 2020; Wang et al., 2020; Kong et al., 2021; Peng et al.,2021), universal distinct element code (UDEC) (Gao et al., 2016;Farahmand and Diederichs, 2021; Huang et al., 2021; Pan et al.,2021), and combined finite-discrete element method (FDEM)(Abdelaziz et al., 2018; Li et al., 2020; Chen et al., 2021), and has been used for simulating grain-scale behaviours.Similar to the concept of the GBM, the weak stiffness and strength on the intergrain boundaries can also be simulated by inserting cohesive elements into a finite element mesh at the inter-grain boundaries (El Shawish et al., 2013; Simonovski and Cizelj, 2015; Rodrigues et al., 2020; Naderi and Zhang, 2021).This is referred to hereafter as cohesive FEM model.Note that the cohesive elements here are used for simulating the displacement and failure of the inter-grain boundaries instead of the fracture propagation.The microstructure models used in these studies are mostly created artificially using Voronoi polygons for nonporous materials such as concrete and crystalline rock (e.g.granite).However, the complex shape of the grains in granular porous rock, as it can be argued, is harder to capture in the same way, and has only been considered in limited literature.In the framework of particle-based discrete element method(DEM),the irregular shape of the aggregates or sand grains can be approximated by clumping the DEM particles (Lu and McDowell, 2006; Garcia et al., 2009; Liu et al., 2017).Wu et al.(2021) simulated the sand deformation with each sand grain reconstructed using clumped spherical particles in PFC3D.In terms of element-based method,a grain-shape library was constructed byLatham et al.(2008) using 3D laser ranging and was used for modelling fragmentation of single rock grain in Ma et al.(2017).Compression of an Ottawa sand sample with a large amount of sand grains was simulated using FDEM with the grains constructed from CT-scan image (Chen et al., 2021).Chen et al.(2020) developed a CT-scan based approach for constructing realistic granular rock microstructure using digital rock techniques.This two-dimensional(2D) microstructure model of sandstone, constructed with grains segmented and meshed separately using triangular elements was imported into the FDEM-GBM model for grain-scale simulation.The CT-scan based approach was extended in this study to 3D construction of the microstructure for granular porous media,focussing here on the same Bentheim sandstone sample reported in our previous 2D study of sandstone fracture.
The purpose of this paper is to investigate the influence of the inter-grain cementation stiffness on the effective elastic properties of porous sandstone numerically and theoretically.The disparity between the experimentally tested Young’s modulus of granular porous media and the effective elastic Young’s modulus predicted by the popularly used empirical equations was firstly analysed.Then a cohesive FEM model with realistic 3D sandstone microstructure constructed from CT-scan data was developed to simulate the influences of both the pores and inter-grain cementation stiffness on the effective Young’s modulus.In addition, a theoretical reduced stiffness model was proposed to incorporate the influences of both the porosity and inter-grain compliance on the effective Young’s modulus into a simple relation.Finally, the effect of intergrain cementation stiffness on the effective elastic properties was investigated with the numerical and theoretical results.
2.Disparity between the experimentally tested elastic properties and empirical prediction
Different types of empirical relationships have been developed to estimate the porosity dependence of the Young’s modulus for porous media based on the theoretical analysis with idealized pore shape and distribution (Zimmerman, 1991; Pabst et al., 2006;Choren et al.,2013).In this section,the applicability of the existing relationships to granular porous media was checked.As a typical granular porous medium,Bentheim sandstone was chosen for this study for the following reasons: (1) Bentheim sandstone has a constant mineralogy and is a quartz-rich sandstone(normally over 90%)(Peksa et al.,2015),which makes it reasonable to approximate the property of the solid grains by that of quartz;and(2)Bentheim sandstone has been extensively tested experimentally and the relevant data are available in the literature to support the analysis.The effective Young’s modulus of the Bentheim sandstone is predicted with the existing relationships and compared with the experimentally tested Young’s modulus or data collected from the literature.
2.1.Experimentally tested properties of Bentheim sandstone
The experimentally measured porosity,quartz content,Young’s modulus and Poisson’s ratio of Bentheim sandstone collected from several publications are listed in Table 1.The Bentheim sandstone samples used for further numerical analysis were collected from the Gildehaus quarry, Germany with an average grain size D =0.2 mm (Chen et al., 2020).The corresponding experimentally tested results are listed in the first row.The Young’s modulus of Bentheim sandstone ranges from 10.3 GPa to 16.87 GPa while the Young’s modulus and Poisson’s ratio assumed for the quartz grains are 94.53 GPa and 0.074,respectively(Mavko et al., 2009).
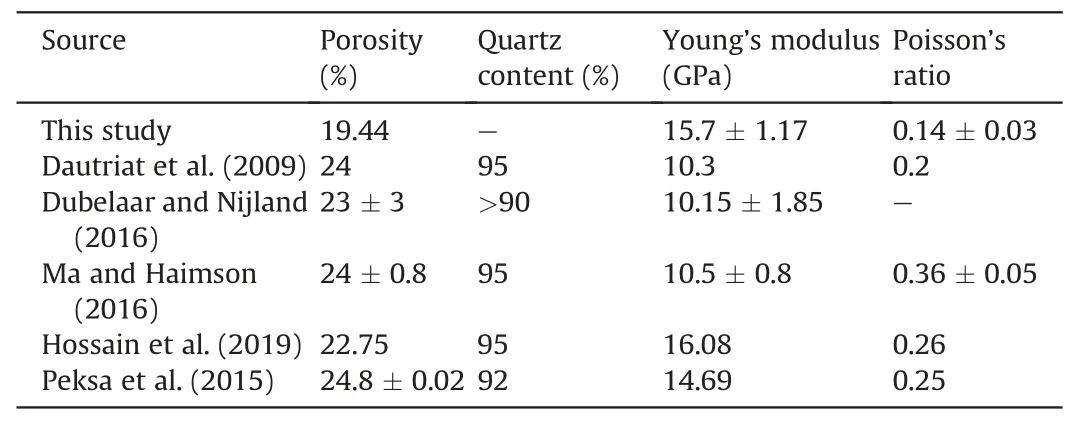
Table 1Porosity, quartz content, Young’s modulus and Poisson’s ratio of Bentheim sandstone.
2.2.Prediction of effective Young’s modulus of Bentheim sandstone with empirical relationships
Many empirical relationships have been developed to estimate the influence of the porosity on the effective Young’s modulus of porous media(Pabst et al.,2006;Choren et al.,2013).According to the theory of linear elasticity, a linear relationship between the Young’s modulus for the porous media and matrix is given:
where E and E0are the Young’s modulus of the porous media and the matrix material, respectively; α is an unknown function of porosity φ and has been fitted using different expressions:
where k is a constant related to Poisson’s ratio of the matrix and takes 1.9 or 2.636 (Choren et al., 2013), i and j for the power relationship are both empirically determined,j = 1 and i ranges from 2 to 4 for φ <0.6 in Wagh et al.(1993).In the exponential relationship, m is a parameter ranging from 2.7 to 4.3 for φ <0.37(Spriggs,1961; Choren et al.,2013).
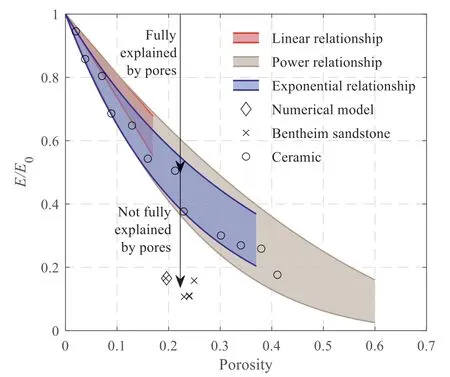
Fig.1.Comparison between the empirical relationships and the experimental data for Bentheim sandstone(Table 1)and ceramic(Knudsen,1962;Fedotov,2016).The arrows indicate the decrease of the Young’s modulus of the matrix (i.e.E0) to the effective Young’s modulus predicted by the empirical relationships induced by pores as well as the further decrease of the Young’s modulus to experimental values for Bentheim sandstone which is still not fully explained.
Fig.1 compares these empirical relationships with the experimental data for Bentheim sandstone (Table 1) and ceramic(Knudsen,1962; Fedotov, 2016).It shows that these relationships are approximately consistent with each other and accurately estimate the decrease of the effective Young’s modulus of ceramic with increase of the porosity.However, none of the experimental data for Bentheim sandstone is covered by these relationships, indicating that the significant decrease of the Young’s modulus for the sandstone compared to that of quartz(E0)is not completely due to the inclusion of the pores.The difference between the Young’s modulus predicted by these relationships and the experimental values for Bentheim sandstone has not been fully understood or explained in any quantitative sense.A reasonable assumption is that the weaker inter-grain cement or the micro gaps between the grains further reduces the effective Young’s modulus.To account for the influence of the inter-grain cementation, a cohesive FEM model is developed via the directly extracted realistic sandstone microstructure constructed from CT-scan data in Section 3.A new theoretical model, the reduced stiffness model, is proposed in Section 4.
3.Cohesive FEM model based on realistic microstructure
An advanced numerical workflow is described herein to simulate the influence of the inter-grain cementation stiffness on the effective elastic properties.Two significant features of the numerical workflow are the construction of the realistic 3D rock microstructure based on CT-scan image and the 3D cohesive FEM model compatible with the microstructure model,as described in Section 3.1 and 3.2, respectively.
3.1.Construction of 3D realistic rock microstructure
A CT-scan based approach for constructing 3D microscale models is implemented with AVIZO(version 2019.1)to present the 3D microstructure of porous sandstone (see Fig.2).Three cubic subsamples with an edge of 2.5 mm were taken from a Bentheim sandstone (Gildehaus quarry) sample (diameter of 10 mm and height of 7 mm).The preparation of the 3D microscale models for numerical simulation takes several steps including mainly material segmentation, grain separation, surface generation and simplification, and tetrahedral mesh generation.More specifically, a median filter was first applied to the CT-scan image to remove noise.Then the solid and pores were segmented via interactive thresholding.Afterwards, the sandstone grains were recognized and separated using the watershed segmentation approach.Next the triangular surface mesh was generated using the surface generation tool and was further simplified.The tetrahedral volume mesh was generated from the simplified surface mesh with the built-in grid generation tool and was exported from the AVIZO.The accuracy of the constructed microstructure models is demonstrated by comparing the internal microstructure of model A with the corresponding CT-scan image in Fig.3.
The size of the constructed microstructure models is determined according to an analysis of the representative elementary volume (REV), i.e.the smallest subvolume of the heterogeneous materials to be used in determining the corresponding effective properties for the macroscopic model.Fig.4 shows the microstructure models with different edge lengths of 0.5-3 mm and the corresponding porosities against the edge length.The number of grains along each edge, i.e.length/diameter (L/D) in the microstructure models increases from 2.5(Fig.4d)to 17.5(Fig.4a).The corresponding porosity shows significant changes for L/D <10,i.e.for cube edge length L > 2 mm,the resolution plot for porosity (Fig.4e) converges and becomes flat, indicating theREV has a size of about L/D = 10.The cube edge length L =2.5 mm which is slightly larger than the REV was chosen in this study.The validity of the REV for elastic properties is further proved in Section 5.4.
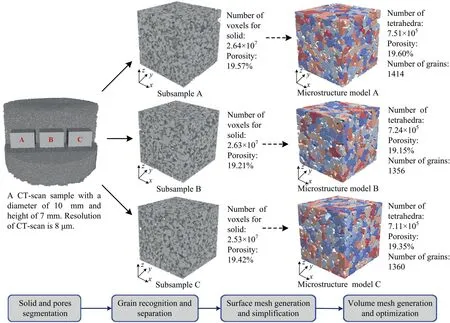
Fig.2.Construction of 3D microstructure models for Bentheim sandstone.The cubic Bentheim sandstone subsamples have an edge length of 2.5 mm.The dashed arrows represent the process of the CT-scan image detailed in the workflow at the bottom.

Fig.3.Comparison between the internal microstructures of (a) model A, and (b) CTscan image.
It is important to choose a proper mesh size to control the trade-off between the accuracy of the microstructure model and element number which in turn determines the computation cost for the following simulation.Fig.5 shows four microstructure models of subsample A with the same grain segmentation but different mesh sizes.As shown by the close-ups, the accuracy of the grain geometries decreases with increase of the mesh size but the topological structure is still basically kept.The element numbers of the triangular surface mesh and tetrahedral volume mesh as well as the porosity for different mesh sizes are shown in Fig.6.The element number of the constructed microstructure model increases from 2.44×10⁵for the mesh size of 0.125 mm to 2.29 × 10⁶for the mesh size of 0.05 mm.The corresponding percentages to the total voxel number for grains in the original CTscan image are 0.92% and 8.67%, respectively.A rapid increase of the element number is observed for the mesh size smaller than 0.075 mm (see Fig.6).Therefore, the mesh size of 0.075 mm was used in following simulations to reach a balance between the accuracy of the model and computation cost in following simulation.The porosities of the constructed models are all consistent with that calculated from the CT-scan data.The great advantage of the workflow implemented here is that it not only presents the complex shapes of the pores and solid phase but also recognizes and separates the grains,which makes it applicable in simulating the grain-scale interaction.
3.2.3D cohesive FEM model
A mechanics solver compatible with the realistic microstructure model in Section 3.1 is needed to incorporate the complex grain geometries and interaction into the analysis of the mechanical behaviours of the granular materials.In this study,a cohesive FEM model was adopted with the grain deformation simulated by the standard FEM elements and grain interaction simulated by thecohesive elements.As shown in Fig.7, the tetrahedral mesh in the microstructure model was used as the FEM elements and 6-node zero-thickness prismatic cohesive elements were inserted along the grain boundaries.
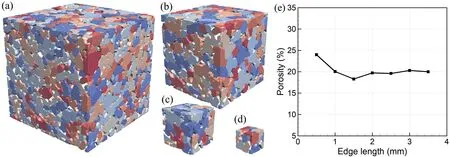
Fig.4.REV analysis of the constructed microstructure model:microstructure models with edge length(a)3 mm,(b)2 mm,(c)1 mm,(d)0.5 mm,and(e)corresponding porosities against the edge length.
The discretized form of the governing equation for the linear elastic deformation of the system is written as
where Keand Kcohare the stiffness matrices assembled from the individual stiffness matrix for each FEM element and cohesive element, u is the displacement field, and F is a vector of external forces representing the loading on the boundaries and body force.
For each cohesive element,the stiffness matrix kcohis computed as (Spring and Paulino, 2014; Durand and da Silva, 2021)

Fig.5.Comparison between (a) the finest microstructure model constructed directly from voxels and the microstructure models constructed based on different mesh sizes (b)0.05 mm, (c) 0.075 mm, and (d) 0.125 mm for subsample A.
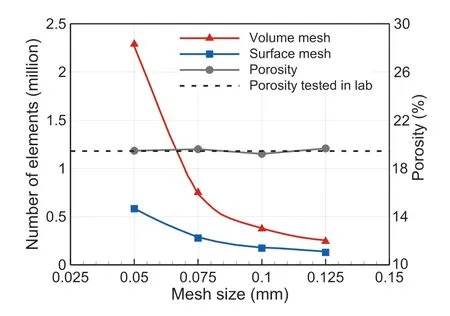
Fig.6.Number of elements for the surface mesh and volume mesh and porosities for the 3D microstructure models of subsample A with different mesh sizes.
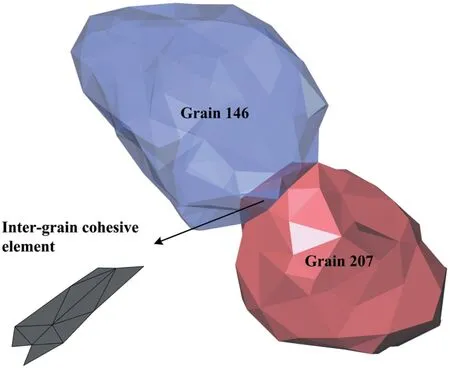
Fig.7.Schematic of the cohesive FEM model for simulating grain deformation and interaction.The grains 146 and 207 in model A consist of 354 and 383 tetrahedral elements and interact through 10 zero-thickness prismatic cohesive elements.
where ξ and η are the nondimensional local coordinates,matrix B is computed from the shape function Ni(i = 1,2,3)and the identity matrix I:
The rotational matrix, R in Eq.(4), is used to express global displacements in the local reference and consists of three vectors n,s, and t:
The J vectors in Eq.(4) are easily calculated from the Jacobian matrix as detailed by Durand and da Silva (2021).The Jacobian matrix is defined as
where x, y, z are the global coordinates and
where the terms J11, J12, …, are the components of the Jacobian matrix J.
For the elastic regime, the constitutive matrix D in Eq.(4) is given by
where knand ksare the normal and shear stiffnesses of the cohesive elements, respectively.
The computation of Keaccording to the classic theory of FEM is omitted here.The integration in Eq.(4) for the 6-node zerothickness prismatic cohesive elements is computed using 3 Gauss integration points.
4.A theoretical reduced stiffness model based on an ideal granular microstructure
A theoretical model accounting for both the effects of porosity and inter-grain cementation on the effective Young’s modulus is proposed in this section.Note that the theoretical model is only used for investigating the expression of the relationship between the microscale and macroscale properties and the parameters involved may need to be determined numerically (detailed in Section 5.5).We consider an ideal granular microstructure with a height of H compressed by a loading F (see Fig.8).Then a displacement ΔH occurs in the grain-scale model with elastic properties[E0,ν0](ν0is the Poisson’s ratio of the matrix)as well as the equivalent macroscale model with elastic properties [E, ν] (ν is the Poisson’s ratio of the porous media).For the macroscale model,ΔH is simply expressed as
where S is the macroscale cross-sectional area, S is the area of the inter-grain boundary, F is the loading on the top in vertical direction.
For the grain-scale model, ΔH is induced by the grain deformation and compression of the cementation and micro gaps along the inter-grain boundaries:
where E0is the Young’s modulus of the grains, n is the number of the inter-grain boundaries along the height of the sample.Combining Eqs.(10) and (11) leads to
where Rn= n/H is defined as the density of the inter-grain boundaries along the direction of the deformation, i.e.the reciprocal of the average grain interface spacing for scanlines parallel to the applied force and has a unit of m-1.Rs= S/S'is defined as the ratio of the macroscale cross-sectional area of the model to the area of the inter-grain boundary in the ideal grain-scale model (see Fig.8).
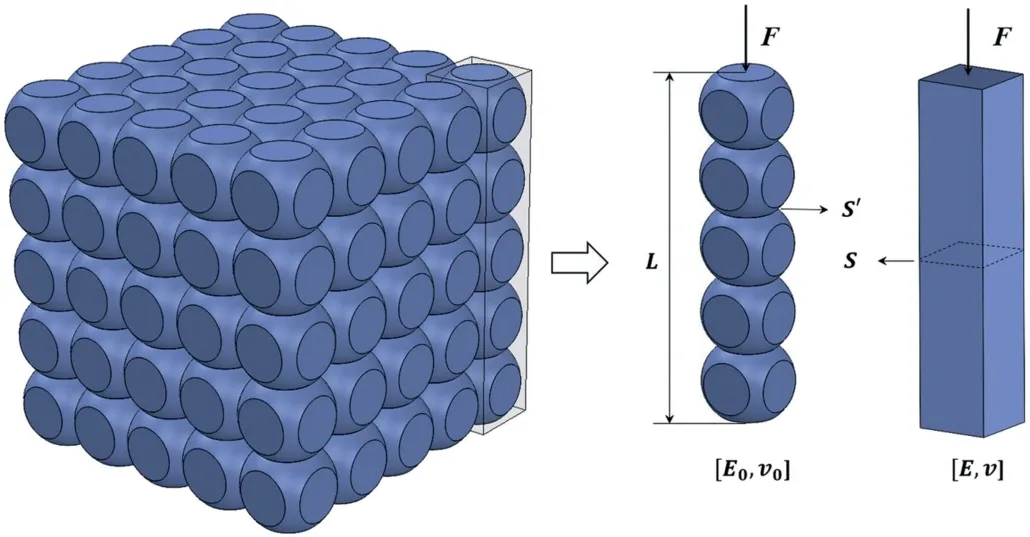
Fig.8.Schematic of the reduced stiffness model accounting for both the effects of porosity and inter-grain cementation on effective Young’s modulus and its equivalent macroscale model.[E0,ν0] and [E,ν] are the elastic properties of the grains and macroscale model, respectively.
For the realistic rock microstructure,the inter-grain boundaries generally have complex shapes and may have arbitrary angles in the direction of loading, leading to difficulties in the calculation of Rnand Rs.Therefore, we redefine RnRsas a parameter β and calibrate it numerically.Then the Eq.(12) is rewritten as
The first term on the right side gives the influence of porosity on the E while the second term represents the influence of inter-grain stiffness.Considering the limiting case of infinite inter-grain stiffness(i.e.kn→∞),the second term on the right-side disappears and the reduced stiffness model degrades to E = αE0.Thus, Eq.(1) is with only the influence of porosity accounted for.The parameter α depending on the porosity and pore shapes has been extensively investigated in previous studies (e.g.Eqs.(1) and (2)).For porous granular geomaterial, the influence of the inter-grain stiffness is controlled by parameter β, which depends on rock microstructure and has to be determined numerically.According to definitions of β,Rnand Rs, the parameter β increases with the increasing porosity and decreasing grain size.
5.Numerical setup and results
The cohesive FEM model is used for studying the elastic properties of the microstructure model in this section.The influences of porosity and pore shapes on the effective Young’s modulus are first re-examined.Then the normal and shear stiffness of the inter-grain boundaries are calibrated and the effective elastic properties of the sandstone microstructure models with different size are tested.Finally, the numerical results are compared with the theoretical model.
5.1.Numerical setup
To calculate the effective elastic properties ([E, ν]) of the constructed samples, the Young’s modulus E and P-wave modulus M were tested with the set-ups in Fig.9.In both cases,a displacement constrain was applied on the top boundary and then the corresponding modulus was calculated by dividing the averaged stress by the strain in the direction of compression.The P-wave modulus M is expressed as (Mavko et al.,2009; Qu et al., 2019)
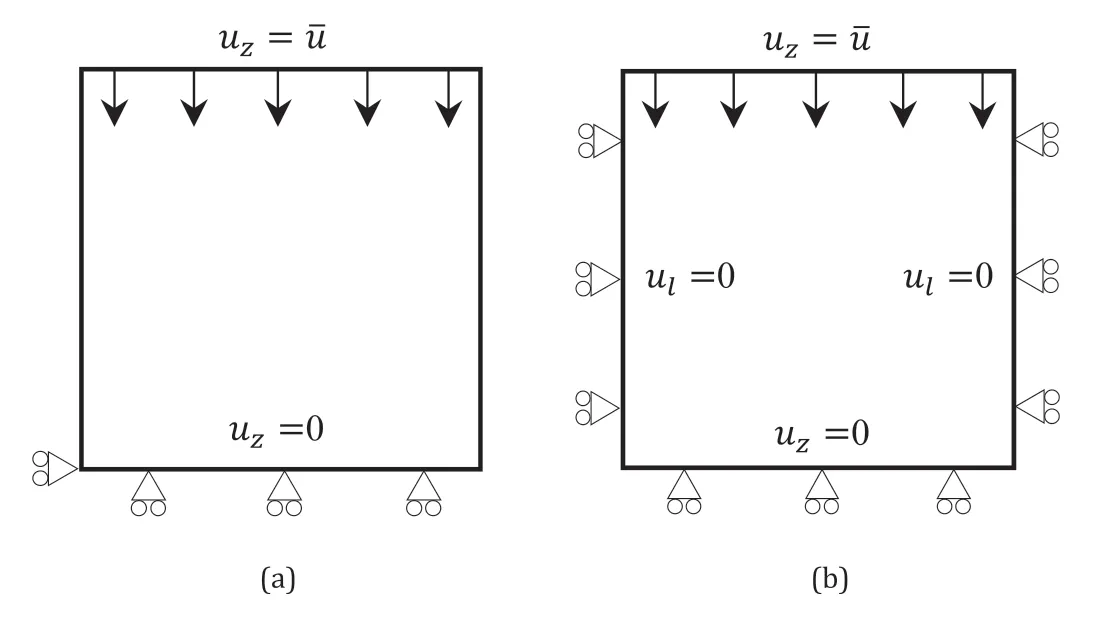
Fig.9.Schematic of displacement boundary conditions for testing(a)Young’s modulus E and(b)P-wave modulus M.The applied displacement at the top = 0.01 mm.uz is the vertical displacement and is fixed at the bottom.ul means the normal displacement on lateral boundaries and is fixed in (b).
Then the Poisson’s ratio ν is calculated as
5.2.Influence of porosity and pore shapes on the effective Young’s modulus
In this section, we re-examined the influence of the pores in regular and realistic shapes on the effective Young’s modulus.The numerical cases may be regarded as a validation of our FEM program in calculating the effective Young’s modulus and, in the meantime, the exploration of suitable values of α in Eq.(13).The standard FEM (see Eq.(3) without Kcoh) was used since the influence of the inter-grain compliance is not considered in this section.Fig.10 shows the influence of the spherical, cubic, and realistic pores on the effective Young’s modulus (ν0= 0.074 was used according to the elastic properties of quartz).Our numerical results for the spherical and cubic pores are consistent with the curves in literature, which validates the accuracy of the numerical model.The results for sandstone were computed from 6 specimens with a size of 1 mm × 1 mm × 1 mm from the original sample in Fig.2.Three typical microstructure models for spherical, cubic, and realistic pores are shown in Fig.11.For the realistic sandstone microstructure,assuming a linear relationship between the parameter α and porosity φ in the tested range φ <0.25 leads to E/ E0=α(φ) = (1-kφ) with k≈1.9.

Fig.10.Influence of the spherical, cubic, and realistic pores on the effective Young’s modulus.
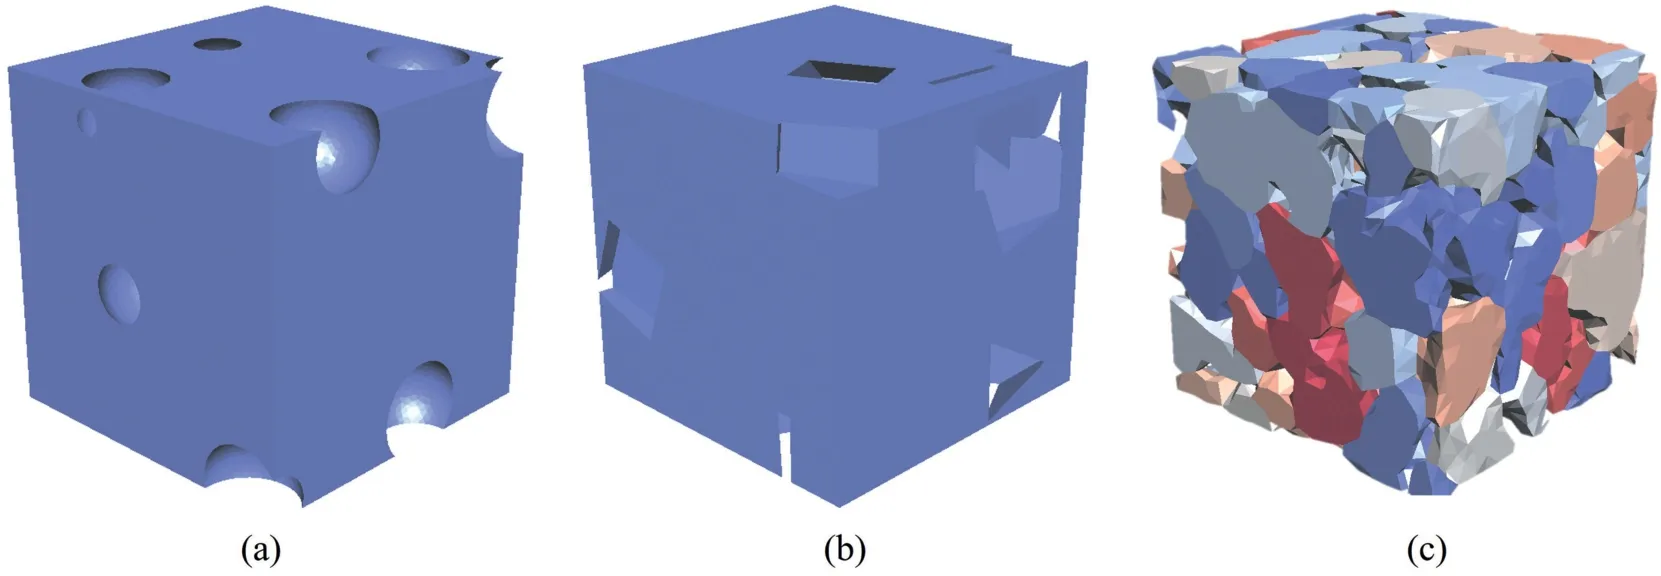
Fig.11.Representative elementary volumes with (a) spherical, (b) cubic, and (c) realistic pores.The corresponding porosities are 19.38%,19.72%, and 20.05%, respectively.
5.3.Calibration and validation of normal and shear stiffnesses at inter-grain boundaries
Fig.12 shows the numerically tested effective Young’s modulus E and Poisson’s ratio ν of Model A in x-direction(defined in Fig.2)for different combination of normal and shear stiffness [kn, ks] of the inter-grain cohesive elements using the cohesive FEM model in Section 3.2 and numerical set-ups in Section 5.1.The results show that the macroscale elastic properties of the porous sandstone are largely influenced by the inter-grain cementation stiffness.E increases with increase of[kn, ks]with a slightly stronger effect of kn(see Fig.12a).In the case of infinite [kn, ks], the inter-grain compliance disappears and the cohesive FEM model degrades to a standard FEM model,in which only the influences of the pores are simulated.The corresponding E is 63 GPa.With decrease of[kn, ks]from 107GPa/m to 104GPa/m, a significant decrease of the E from 61.73 GPa to 3.04 GPa is observed, which explains the difference between the experimental data and empirical equations in Fig.1.Fig.12b shows the calculated ν for different pair of[kn, ks]based on the tested E and P-wave modulus M.Small Poisson’s ratio ν (less than 0.1) is observed in the region where ksis equal to or slightly larger than kn.For rock-like materials,it is more common to have a larger knthan ks.Therefore, the region kn> ksis focused on.For the Bentheim sandstone in this study, the experimentally tested E and ν are 15.7 ± 1.17 GPa and 0.14 ± 0.03, respectively.[kn, ks]values are solved at the intersection of the contour lines for E = 15.7 GPa in Fig.12a and ν = 0.14 in Fig.12b and are about[1.2×10⁵, 4×10⁴]GPa/m.The result is shown in Fig.1 to compare with the experimental results and empirical relationship.
To further test the calibrated [kn, ks], we also calculated the E and ν of the Model A in y-and z-directions as well as Model B and C using the same parameters.The results listed in Table 2 show small variability of the tested E and v, indicating the validity of the calibrated parameters.In addition, the calibrated [kn, ks] are also comparable to the calibrated stiffness of the inter-grain joint elements kn= ks= pe/h = 9.2×10⁴GPa/m in the FDEM-GBMmodel for the same type of sandstone in Chen et al.(2020),where peis the elastic penalty and h is the mesh size in the FDEM model(the same normal and shear stiffnesses are assumed).

Table 2Numerically tested Young’s modulus E and Poisson’s ratio v of three microstructure models in different directions using calibrated [kn, ks] = [1.2 × 105,4 × 104] GPa/m.

Fig.12.Influence of the inter-grain cementation stiffness on: (a) effective elastic Young’s modulus E(GPa), and (b) Poisson’s ratio ν.The experimentally tested results of the Bentheim sandstone sample [E, ν] = [15.7 GPa, 0.14] are indicated by the star.
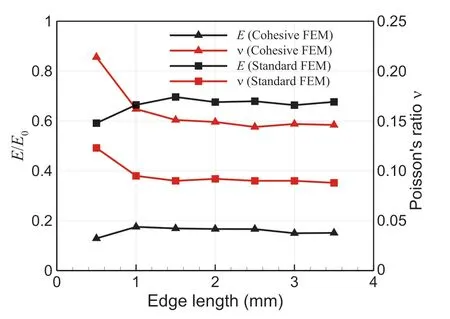
Fig.13.Effect of model size on the elastic properties.
5.4.Effective elastic properties of models with different size
The calibrated[kn, ks]are applied to the microstructure models with different sizes in Fig.4 to investigate the effect of model size on the effective Young’s modulus.Fig.13 shows the numerically tested effective elastic properties with or without the inter-grain compliance considered.In both cases, the effective elastic properties change significantly for L <2 mm due to the material heterogeneities but converge to a flatter plot for larger models with larger REV.The model with an edge length L = 0.5 mm has the minimum E due to the high porosity of the small block and the incomplete support of the skeleton.With increase of the model size and grain number,the porosity decreases to an averaged value and the loading is distributed in the model more uniformly, leading to the increase of E.A converse trend is observed for Poisson’s ratio ν.For the model with an edge length L > 2 mm, the introduction of the inter-grain compliance results in a significant decrease of E/E0from 0.667 to 0.17 and an increase of ν from 0.09 to nearly 0.15.It is also observed from Fig.13 that the pores cause 33.3% deduction of Young’s modulus while the inter-grain stiffness causes another 49.7%.Therefore, the influence of inter-grain stiffness is more significant than porosity for Bentheim sandstone.
5.5.Comparison of numerical and theoretical models
The numerical effective Young’s modulus E of Model A in x-direction under different pairs of[kn, ks]is fitted and compared with the theoretical model in Eq.(13), as indicated in Fig.14.We considered three different cases,i.e.kn/ks= 1,3,10.To best fit the numerical results for the three cases with the proposed theoretical model, the parameters α and β are set to be 0.667 and 3900 m-1,6300 m-1,11000 m-1(only one value of α is needed since the same microstructure is used in the three cases), respectively.The excellent agreement between the numerical and theoretical results indicates the theoretical model derived from the ideal microstructure is also valid for realistic rock microstructure In addition, the Bentheim sandstone sample with a calibrated[kn, ks] = [1.2×10⁵, 4×10⁴] GPa/m and E = 15.7 GPa is also labelled in Fig.14 and locates on the dashed line with β = 6300 m-1.
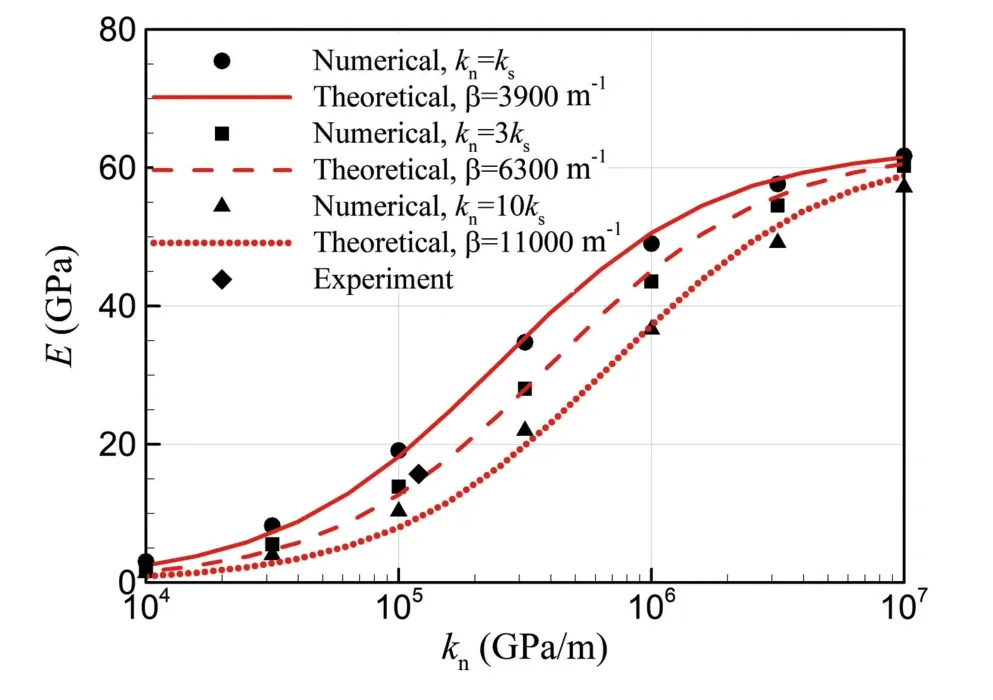
Fig.14.Evolution of the effective elastic Young’s modulus with normal inter-grain stiffness kn for different values of kn/ks.
6.Conclusions
The influence of the inter-grain cementation stiffness on the effective Young’s modulus of the porous sandstone was investigated in this work using an advanced numerical approach with realistic 3D microstructure models constructed from CT data and a theoretical model.
An elaborate numerical workflow incorporating realistic rock microstructure into numerical modelling was developed consisting of the construction of the microstructure model and the cohesive FEM modelling.A CT-scan based approach for constructing microscale models was implemented to present the 3D microstructure of Bentheim sandstone accurately.Both the complex shape of the sandstone grains and pores were recognized and accurately presented.A suitable mesh size was chosen to reach a balance between the accuracy of the microstructure model and mesh number.The information for the connections between individual grains was kept and passed to the numerical model.A 3D cohesive FEM model was adopted to simulate the weak inter-grain cementation stiffness and the strong stiffness of the grains.The proposed workflow helps to bridge the grain-scale properties with the macroscale property of the granular media.The calibration of the inter-grain parameters was also achieved via exploring realistic inter-grain parameters since realistic microstructure geometry was imported directly into the model used here.
On the physical part, the influence of the inter-grain cementation stiffness on the effective Young’s modulus of the granular porous rock (Bentheim sandstone) was investigated theoretically.First, the disparity between the experimentally tested Young’smodulus of Bentheim sandstone, a granular porous rock, and the effective elastic Young’s modulus predicted by empirical equations was described and analysed.This indicates that the property of the Bentheim sandstone is not only influenced by the porosity and pore shape but also the microscale interaction between the grains.A theoretical reduced stiffness model was proposed to incorporate both the influence of the pores and the inter-grain cementation stiffness on the effective Young’s modulus using two terms in a relation as 1/E = 1/αE0+ β/kn.The validity of the theoretical model was proved by the excellent agreement between the numerical and theoretical results when suitable values of α and β are chosen.The theoretical model can be used for guiding the determinations of the microscale mechanical parameters in numerical simulation.
Our numerical model was applied in investigating the influences of both pores and inter-grain cementation stiffness on the effective Young’s modulus.We first revisited the influences of the regular and realistic pore shapes on the effective Young’s modulus.Then the dependence of the effective Young’s modulus E and Poisson’s ratio ν of the Bentheim sandstone sample on the normal and shear inter-grain cementation stiffness [kn, ks] was given numerically.The results show that the macroscale elastic properties of the granular porous sandstone are largely influenced by the inter-grain cementation stiffness.The calibrated [kn, ks] were proved to be valid for the same model in other two directions and other microstructural models.The comparison between the numerical models with and without the inter-grain compliance indicates the low stiffness of the inter-grain boundaries not only reduces the effective Young’s modulus but also increase the Poisson’s ratio.Finally, for the Bentheim sandstone, the pores caused 33.3%deduction of Young’s modulus while the inter-grain stiffness caused another 49.7%, indicating inter-grain stiffness has a more significant influence than porosity.
As for the future work, the elaborate numerical workflow consisting of realistic microstructure model construction and 3D cohesive FEM modelling can also be applied in calibrating other grain-scale properties (e.g.tensile and shear strengths) by comparing the numerically tested effective properties with the experimentally tested macroscale properties.But it needs to be noted that a contact model may need to be incorporated into the framework when the grain contact plays an important role during and/or after failure,e.g.uniaxial compression test and shear failure.Then the numerical model may turn into a hybrid continuum/discontinuum model, e.g.FDEM-GBM.Once all the necessary grainscale properties are calibrated, the numerical model can be applied to investigate the grain-scale response of the rock under complex loading conditions.
Declaration of competing interest
The authors declare that they have no known competing financial interests or personal relationships that could have appeared to influence the work reported in this paper.
Acknowledgements
The authors would like to acknowledge the support of the EC project ‘SURE-Novel Productivity Enhancement Concept for a Sustainable Utilization of a Geothermal Resource-RIA’ (CEC 654662,H2020).The authors thank Dr.Richard R.Bakker at Delft University of Technology, Netherlands for sharing the CT-scan data and the experimental test results.The authors also would like thank Prof.Robert Zimmerman at Imperial College London, UK for discussions on this work.
 Journal of Rock Mechanics and Geotechnical Engineering2023年3期
- Journal of Rock Mechanics and Geotechnical Engineering的其它文章
- Development of mathematically motivated hybrid soft computing models for improved predictions of ultimate bearing capacity of shallow foundations
- A post-peak dilatancy model for soft rock and its application in deep tunnel excavation
- Numerical simulation of fatigue crack propagation in heterogeneous geomaterials under varied loads using displacement discontinuity method
- Combined load bearing capacity of rigid piles embedded in a crossanisotropic clay deposit using 3D finite element lower bound
- Long-term decay of the water pressure in the osmotic tensiometer
- Predicting and validating the load-settlement behavior of large-scale geosynthetic-reinforced soil abutments using hybrid intelligent modeling
