A numerical case study on the long-term seismic assessment of reinforced concrete tunnels in corrosive environments
Maria Antoniou, Antonios Mantakas, Nikolaos Nikitas, Raul Fuentes
a ETH Zurich, Zurich, Switzerland
b National Technical University of Athens, Athens, Greece
c University of Leeds, Leeds, UK
d RWTH Aachen University, Aachen, Germany
Keywords:Tunnels Reinforcement corrosion Ageing Earthquakes Numerical modelling Long-term performance Concrete cracking behaviour
ABSTRACT The paper investigates the long-term seismic behaviour of an underground reinforced concrete (RC)metro tunnel in Santiago, Chile, considering the combined effects of chloride-induced corrosion and cumulative, low-amplitude seismic shaking on the structure’s performance.The soil-tunnel response is evaluated with the aid of transient,nonlinear finite element analysis using a two-dimensional(2D)plane strain numerical model that adopts advanced nonlinear models for the simulation of soil and concrete plasticity and the dynamic stiffness behaviour.The effects of corrosion deterioration are demonstrated in terms of time-dependent loss of rebar area and cover concrete stiffness and strength.The study illustrates the influence of ageing and repeated seismic shaking on lining deformation, crack development,and the modal characteristics of the intact and degrading systems.The results indicate that multiple lowamplitude events drive the non-degrading RC tunnel beyond its elastic regime without significant structural response consequences.A noticeable impact of corrosion deterioration on the structure’s seismic performance is revealed, increasing with the number and intensity of earthquake events.Two different tunnel embedment depths are comparatively assessed.The analyses demonstrate larger coseismic section convergence in the case of the deeper tunnel, yet a less pronounced effect of ageing and successive seismic loading compared to the shallow section,which is evident in the RC lining cracks at the end of shaking.
1.Introduction
The effects of ageing manifested as the structural deterioration of infrastructure elements become increasingly important for the resilience of existing transportation systems.A significant percentage of these systems in developed nations were constructed around the 1960s; therefore, they are gradually reaching their maximum lifespan,operating at substandard service levels(Council on Foreign Relations, 2021).Tunnel structures are no exception to this rule,with several examples indicating the severe consequences of time-dependent structural degradation.A 1990 statistical survey in Japan indicated that 24% of the nation’s 6705 highway tunnels were suffering from material deterioration caused by carbonationinduced or chloride-induced corrosion (Han et al., 2020), while in 2012, material degradation of the Sasago tunnel in Tokyo caused the collapse of 300 ceiling panels, leading to nine deaths and two injuries ( Baji et al., 2017).
On top of the acute effects of ageing, the occurrence of natural disruptive events,such as earthquakes,further stresses the limits of our infrastructure.Although tunnel structures are widely considered less vulnerable to seismic damage compared to over-ground structures (mainly due to the ground confinement), recent history has proven that intense seismic shaking may drive a tunnel lining past its elastic regime:cracking of varying intensity has been documented on tunnel sections after the 1995 Kobe and 2016 Kumamoto earthquakes in Japan, the 1999 Duzce earthquake in Turkey,and the 1999 Chi-Chi,the 2008 Wenchuan and 2013 Lushan earthquakes in China (Hashash et al., 2001; Wang et al., 2001;Eidinger et al., 2014; Zhang et al., 2018; Tsinidis et al., 2020).Inspired by such occurrences,significant efforts have been made in the recent literature towards understanding and predicting theseismic behaviour of tunnels, involving numerous experimental(e.g.Bilotta et al., 2009; Cao and Huang, 2010; Shibayama et al.,2010; Cilingir and Madabhushi, 2011; Lanzano et al., 2012; Chen and Shen, 2014; Tsinidis et al., 2016) and numerical studies (e.g.Kontoe et al., 2011; Bilotta et al., 2014; Gomes, 2014; Abate et al.,2015; Lanzano et al., 2015; Fabozzi et al., 2017; Tsinidis, 2017; Lu and Hwang, 2019; Kampas et al., 2019).A full review of the current state-of-the-art may be found in Tsinidis et al.(2020), which summarises the research conducted on the seismic behaviour of tunnel structures and the need for future research.
The studies mentioned above primarily focus on the tunnel’s response to single earthquake events.In seismically active countries worldwide, modern infrastructure is nowadays designed to withstand severe earthquake damage under the guidance of updated seismic codes.Typically,however,design procedures refer to the 475-yr return period earthquake event, expecting that damages will be rectified and strengthening will occur in the aftermath of a severe earthquake.Nevertheless,civil infrastructure systems are expected to experience multiple earthquake events during their service lifetime, especially when located in regions of high seismicity, which can induce cumulative damage to the affected structures(Abdelnaby and Elnashai,2015).The intensity of such events may be low, moderate or severe, yet the chances of experiencing low-intensity earthquakes are higher since the earthquake intensities are inversely proportional to the likelihood of occurrence(Lee et al.,2009).To the best of our knowledge,little work has been carried out to date on the cumulative effect of earthquake events on tunnels.Wang et al.(2015) conducted shaking table tests to identify progressive damage in scaled, unreinforced concrete linings following multiple excitations of increasing intensity.There exists, however, an evolving research thrust on the subject for other types of highway structures.In a recent study, Tolentino et al.(2020) presented numerically-based fragility curves for reinforced concrete (RC) bridges, considering the effect of the cumulative damage caused by earthquakes, while Kumar et al.(2009) and Panchireddi and Ghosh (2019) also proposed probabilistic approaches to estimate the damage accumulation in bridges subjected to repeated seismic loading while simultaneously experiencing continuing corrosion deterioration during their service life.
Despite the well-established view that single, low-amplitude seismic events are not expected to jeopardize a tunnel’s structural performance, small-scale seismic deformation due to successive low-amplitude events may threaten serviceability,especially in the presence of structural deterioration as a result of adverse underground environments.In the heavily interconnected urban environment of megacities, ensuring infrastructure operability becomes equally important as cancelling out the probability of failure, particularly in terms of indirect costs associated with downtime.
Although ageing effects in the seismic vulnerability assessment of over-ground structures has already gained focus in the recent literature (e.g.Pitilakis et al.(2014) and Yalciner et al.(2012) for buildings; Choe et al.(2008, 2009), Ghosh and Padgett (2010),Simon et al.(2010)and Ghosh and Sood(2016)for bridges),limited studies have incorporated such effects in the seismic vulnerability assessment of existing tunnels.Argyroudis et al.(2017)proposed a set of numerically-derived fragility curves for shallow tunnels,where ageing effects due to reinforcement corrosion were accounted for by considering a time-dependent loss of reinforcement area.The study,however,does not take into account the effect of cumulative seismic damage imposed on the structures due to life-cycle seismic loading.
This paper aims to contribute toward this direction by investigating the behaviour of RC tunnels under long-term seismic shaking, including the simultaneous input of lifetime damage due to corrosion deterioration.An idealised case study inspired by a recently constructed metro tunnel in Santiago, Chile, is employed for this purpose.The study paves the way for further analysis/interpretation of the dynamic monitoring data currently being gathered from the actual tunnel in Santiago, in the framework of the ‘Shaking Tunnel Vision’ project.
The problem is investigated numerically, using the finite element (FE) method and accounting for soil and structural nonlinearities.The concrete lining follows a damaged plasticity model capable of simulating the inelastic response of concrete to detect the seismically induced cracking patterns on the structure.In Section 2,the study employs historical earthquake data to construct a timeline of low-amplitude seismic events originating from two different seismogenic sources within a 100 km distance from the tunnel location, corresponding to a plausible seismic shaking scenario within the 100-yr tunnel design life.The employed deterministic seismic sequence does not account for the multiple sources of epistemic and aleatory uncertainty typically involved in the seismic hazard assessment process,nor does it provide a unique solution to the tunnel’s dynamic design problem.Instead, it comprises a legitimate assumption, backed up by realistic return periods from historical seismicity, which serves well the study’s primary objective, i.e.to investigate and highlight the seismic damage accumulation mechanisms present in the lifecycle of deteriorating tunnel structures, as these could indicatively be observed in practice.
The study uses analytical models available in the literature to simulate the time-dependent corrosion phenomenon.The employed time-dependent deterioration model and the limitations inherent to the adopted modelling strategy are discussed in detail in Section 3.In Section 4,the study initially quantifies the effect of multiple shocks on the non-degrading tunnel lining in terms of permanent structure deformation and developed cracking patterns.The effect of tunnel embedment on the resulting structural vulnerability is discussed.Subsequently, the study captures the total damage accumulation by the end of the tunnel’s service life by jointly considering the effects of successive shaking and continuous corrosion deterioration.A direct comparison between degrading and non-degrading tunnel responses is presented,and the effect of damage on the modal characteristics of the soil-structure assembly is discussed.The study ends with key conclusions, limitations and recommendations for future work on the subject.
2.A case study from Santiago metro, Chile
2.1.Description of RC tunnel and soil conditions
The adopted case study refers to a RC tunnel,part of the recently constructed Line 3 of the metro infrastructure in Santiago, Chile(Fig.1a).Geotechnical investigations of the ground conditions in the site of interest indicated that the soil profile consists of two main geotechnical units (Metro de Santiago S.A., 2014).A silty/clayey material overlies river deposits consisting of sandy gravel with little presence of non-plastic fines up to a depth of 30 m(Fig.1b).Within the upper 10 m of soil, slightly lower cohesion values are observed for the silt/clay material.Moreover,the isolated presence of thin lenses (1-2 m) of fine silty sands, gravel and volcanic ash was detected within the clay/silt layer.Table 1 summarises a description of the various geotechnical units and their mechanical properties.Investigations prior to design detected the groundwater table (GWT) approximately at a depth of 20 m.However,historical measurements report a water table fluctuation between the surface(1968)and 5 m depth(1987);thus,the GWT is conservatively assumed at the ground surface.The adopted(simplified) soil stratigraphy is illustrated in Fig.2, along with the small-strain Young’s modulus and undrained shear strength for the examined soil layers.The tunnel section is located within the second clay layer at variable depths below the ground surface.Two typical cross-sections of the soil-tunnel system are investigated in the present study: (a) The case of a deeper section, where the tunnel crown is located 21 m below the surface (Position 1, with cover-to-height ratio C/H ≈2.5), and (b) the case of a shallow section, where the crown is located 12 m below the surface (Position 2,with C/H ≈1.5)(Fig.2).The selected layouts approximately reflect the upper and lower bounds of tunnel embedment depth met along Line 3 of the Santiago Metro in soil profiles similar to the one studied herein.It should be noted that the value of C/H ≈2.5 does not strictly correspond to the response of a deep tunnel.The hereafter employed definitions of ‘shallow’ and ‘deep’ constitute a basic convention to distinguish between the two studied real tunnel positions,rather than a strict approach to fully mapping the influence of embedment depth on the tunnel’s dynamic response.Similar conventions may be found in the literature (e.g.de Silva et al., 2021) for cover-to-height ratios (C/H) resembling those studied herein.
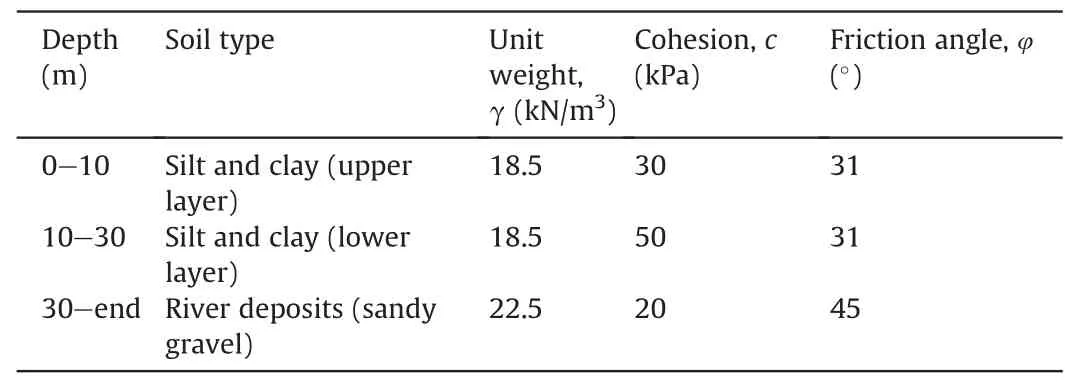
Table 1Properties of the soil materials encountered in the examined tunnel section.
According to the design drawings(Metro de Santiago S.A.,2015),the tunnel has a horseshoe shape with excavated dimensions of 10.1 m in width and 8.13 m in height (Fig.3).The lining thickness equals t=0.4 m,while the void below the section slab is filled with low grade (C7/8) blinding unreinforced concrete.Indicative reinforcement details are illustrated for the left part of the symmetrical tunnel section in Fig.3.
2.2.Estimation of seismic hazard
The methodologies employed in the literature for assessing multiple earthquake effects on structures typically depend on the time horizon of the assessment.In studies associated with longterm seismic effects on structures, the assumed event sequence usually relies on the seismic hazard curve at the site of interest,which correlates the annual frequency of exceedance with a seismic intensity measure and allows for the estimation of the probable maximum number of earthquakes occurring in the service life of a structure (Akiyama and Frangopol, 2014; Panchireddi and Ghosh,2019; Tolentino et al., 2020).In other cases, replicated motion sequences (the same earthquake record, in repetition) or random ground motion sequences, selected based on their frequency content and predominant periods, have also been employed(Abdelnaby and Elnashai, 2015).
This study calculates the magnitude-frequency distributions for the San Ramon fault and the Nazca plate (both within a 100 km distance from the tunnel location) based on recorded earthquakes in the sources’ vicinity, following the methodology presented in Stein et al.(2006).Subsequently, appropriate ground motion models (GMMs) are employed to estimate the expected levels of shaking at the examined tunnel site.Details regarding the applied methodology for the estimation of seismic demand at the site of interest are presented in Appendix A.Based on the results, a plausible deterministic life-cycle earthquake scenario is adopted for the seismic assessment of the tunnel.
The adopted seismic sequence is presented in Fig.4a, corresponding to 100 yr of the tunnel’s lifetime.It comprises 11 lowamplitude seismic events: seven M 4.5 earthquakes with peak ground acceleration PGA = 0.06g and return period Tr= 12.9 yr produced by San Ramon Fault, and four M 7.0 events with PGA = 0.075g and return period Tr= 21 yr originating from the subduction zone.The number of earthquake occurrences considered within the t = 100 yr lifespan of the tunnel is based on the interevent time of the selected events.The study considers the(simplistically intuitive)worst-case scenario in terms of corrosioninduced structural degradation when assigning the time gap between two successive earthquakes from the same source: the events are assumed to occur towards the end of their assigned return period when the time-dependent structural degradation is further amplified.Other plausible seismic sequences could be considered as well,but such a discussion is beyond the scope of the present study.
The resulting time series stem from actual seismic motions(recorded during the M8.0 1985 Valparaiso earthquake) that have been mathematically manipulated to match the target GMM spectra presented in Appendix A(i.e.the spectral characteristics of the employed motions are altered to reflect those of the target spectrum).The SeismoMatch software is used for this purpose(Seismosoft, 2021a).The application adjusts accelerograms to match a specific target response spectrum using the algorithm proposed by Al Atik and Abrahamson (2010).From this point onwards, the loading sequence is termed Scenario 1.As observed in Fig.4a, the effect of record-to-record variability is not assessed herein.The study assumes that the sequential time histories corresponding to the M 4.5 or M 7.0 events share the same motion characteristics (spectral shape, total duration and load cycles), a simplification that stems from the adopted spectral matching method (one-to-one spectrum match), which would inherently produce motions of very similar characteristics.
A second loading sequence-henceforth termed Scenario 2-is employed to examine the cumulative deformation pattern caused by the plausible combination of a larger magnitude earthquake with Scenario 1.Scenario 2 comprises the 11-event sequence, followed by a seismic motion corresponding to the acceleration spectrum recorded on soil of Site Class C (Vs= 412 m/s) at the STGO03S station within the Santiago area during the M8.0 1985 Valparaiso earthquake.The acceleration time history(PGA=0.15g)and respective response spectrum are plotted in Fig.4b.Scenario 2 brings the structure closer to its performance limits, thereby allowing for a quantitative comparison of the effect of repeated low-amplitude seismic events to that of higher intensity earthquakes on the tunnel structural behaviour.
Baseline correction using the SeismoSignal software(Seismosoft, 2021b) has been applied to all seismic records employed in the FE analyses to remove residual velocity and displacement values from the input motions.
3.Numerical analysis methodology
The seismic response of the Santiago metro tunnel is analysed employing the FE analysis environment of Abaqus 6.17 (Abaqus,2017).Nonlinear, plane-strain two-dimensional (2D) dynamic analyses are conducted, focusing on the tunnel performance under seismic SV shear waves,vertically propagating towards the surface.Existing numerical studies that focus on the dynamic behaviour of tunnel structures under this mode of deformation follow the same 2D modelling approach(e.g.Bilotta et al.,2009;Tsinidis et al.,2016;de Silva et al., 2021).
Fig.5a displays a representative FE mesh of the investigated soil-tunnel system.The tunnel structure is located at Position 1.Special zero thickness contact elements are introduced between the soil and the lining to simulate the interface, which is assumed as fully rough for the sake of conservatism: according to relevant studies by Sedarat et al.(2009)and Tsinidis et al.(2016),a zero-slip soil-tunnel interface results in increased developed shear stresses on the tunnel sidewalls,compared to full-slip conditions.Radiation damping is taken into account by introducing dashpots at the model’s base.The dashpot coefficient C is calculated as
where ρ = 2.25 t/m3is the gravel material density,Vsis the shear wave velocity corresponding to halfspace, and A (m2) is the effective area of each dashpot.Moreover, ‘node to node’ kinematic constraints(forcing two nodes to have identical displacements)are applied along the lateral model boundaries to simulate the response of a soil column subjected to in-plane vertically propagating waves.The same method has been previously applied by Bilotta et al.(2009),Tsinidis et al.(2016)and Antoniou et al.(2020)for the numerical simulation of centrifuge or 1g experiments on tunnels conducted in a laminar box or rigid container.
3.1.Soil modelling: kinematic hardening model
The soil is modelled with quadrilateral plane-strain continuum elements, adopting a kinematic hardening model with a modified pressure-dependent von Mises failure criterion and associated plastic flow rule(Anastasopoulos et al.,2011).The model’s capacity to simulate the hysteretic response of soils under cyclic and seismic loading has been validated against experimental results by several researchers, including Anastasopoulos et al.(2011) for surface and slightly embedded foundations, Giannakos et al.(2012) for piles and caissons subjected to horizontal/moment loading,and Tsinidis et al.(2014) for the seismic response of circular tunnels in clay.A detailed description of the model is provided in Appendix B.The calibration of model parameters requires knowledge of (i) the small-strain stiffness, expressed via the soil shear modulus G0, (ii)the pressure-dependent soil shear strength (τult), defined as a function of the mean effective stress σ'm,the soil cohesion c,and thefriction angle φ, and (iii) the stiffness degradation, i.e.the G-γ curves.The model is incorporated in the numerical analyses with the aid of a user material subroutine, as explained in Appendix B.

Fig.2.(a) Adopted soil profile and marked tunnel positions, and (b) Soil stiffness and strength properties under undrained conditions.
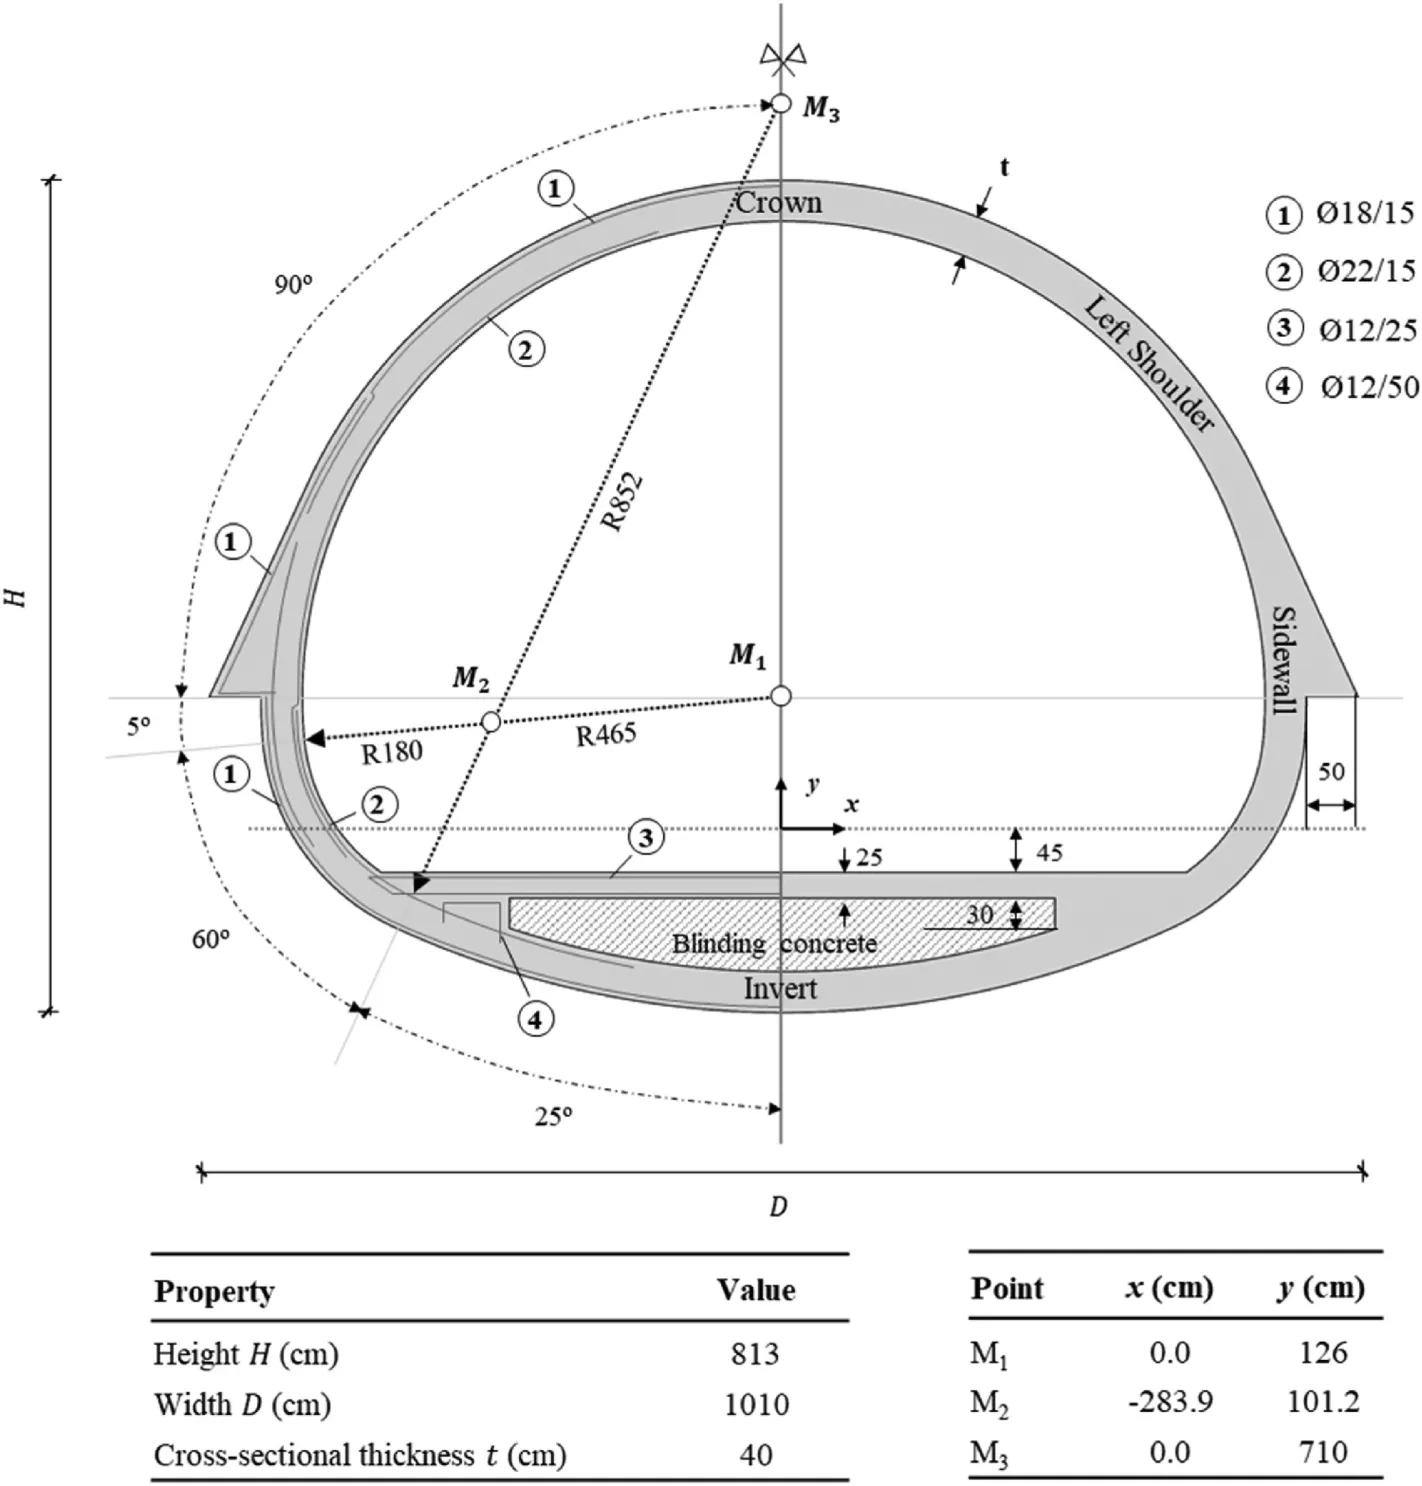
Fig.3.Geometric properties of the examined tunnel.
For the clay layers, a soil rigidity ratio of G0/τult= 600 is assumed, corresponding to a moderately stiff clay profile.For the gravel layer, the small strain stiffness modulus is expressed as a function of the mean effective stress σ'm:
where B is a scaling parameter, taken equal to 25,000.The value corresponds to a very dense sand/soft gravel material,following the values reported in Rollins et al.(1998) and Seed et al.(1986).The variation of shear modulus G and hysteretic damping ratio ξ with shear strain γ are calibrated against the respective experimental curves of Vucetic and Dobry (1991) for clay materials, and Rollins et al.(1998) and Seed et al.(1986) for gravel materials.The calibration procedure involves a series of numerical simulations of cyclic simple shear tests at different levels of shear strain γ.The computed values of G and ξ (derived from the shear stress-shear strain hysteresis loops) are compared to the published G/Go-γ stiffness degradation curves in Fig.6.It should be noted that the small-strain stiffness values assumed in the numerical analyses follow the static stiffness values provided by onsite geotechnical investigations, i.e.they are increased by approximately 300%compared to their static counterparts.
Due to the presence of water(groundwater table at the surface),the analysis considers the saturated density ρ of the soil layers(refer to Table 1 for the relative soil properties).It is assumed that the clay materials will perform in an undrained manner during the rapid seismic loading (Poisson’s ratio of v = 0.495), while drained behaviour is assumed for the gravel layer(assumption of Poisson’s ratio equal to v = 0.25).With the aid of the user material subroutine, the shear strength of the clay layers (which is computed as a function of mean effective stress σ'mat the initial geostatic step) is kept constant during (undrained) dynamic loading.On the contrary, the pressure-dependent shear strength of the gravel layer changes as a function of σ'mthroughout the analysis.Finally,viscous(Rayleigh)damping is introduced in the soil materials according to the equation:
where ξ is the Rayleigh damping ratio; ω is the soil ensemble angular frequency;aRand bRare the Rayleigh damping coefficients proportional to the mass and stiffness,respectively.Coefficients aRand bRare derived so that ξ corresponds to 1%(Sun and Dias,2018)around the first and second undamped natural frequencies of the soil ensemble.
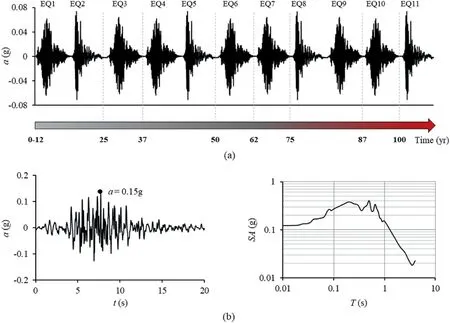
Fig.4.(a)Adopted sequence of earthquake events(Scenario 1);and(b)Artificially generated seismic record,corresponding to the acceleration spectrum recorded at the STGO03S station in Santiago area during the main shock of the M8.0 1985 Valparaiso earthquake (on the right).
3.2.Modelling of the RC lining: concrete damaged plasticity
The concrete lining and the blinding concrete are modelled with inelastic continuum quadrilateral elements.According to the design drawings, the lining consists of a Class 25/30 concrete mix,characterized by compressive strength of fc= 25 MPa.The tensile strength is calculated according to EC2 as ft=0.7[0.3(fc/1000)2/3] = 1.795 MPa, and the Young’s modulus is estimated according to Chang and Mander (1994) formula: E =8.2(fc/1000)3/8= 27.4 GPa,where fcis in MPa.The Poisson’s ratio is set to ν = 0.2, while the material density equals ρ = 2.4 t/m3.A constant viscous(Rayleigh)damping ratio of ξ=5%is assumed for the concrete material around the first and second undamped natural frequencies of the soil-tunnel system.Similar assumptions are also made for the C7/8 blinding concrete.
For the simulation of the degrading concrete stiffness and strength due to multiple seismic excitations,the inelastic concrete behaviour follows the concrete damaged plasticity (CDP) constitutive model, a continuum, plasticity-based damage model available in the Abaqus FE environment (Lubliner et al.,1989; Lee and Fenves, 1998).The model is based on the Drucker-Prager yield surface with non-associated flow rule and captures the irreversible damage in concrete,associated with two main failure mechanisms:tensile cracking and compression crushing.The evolution of the yield surface is controlled by two hardening parameters related to each mechanism, while the development of cracks is macroscopically introduced in the model via a softening stress-strain response.The model’s capacity to adequately capture dynamic concrete material response has been repeatedly demonstrated (e.g.Zoubek et al., 2013; Behnam et al., 2018; Krahl et al., 2018), also for the case of buried structures (Nagy et al., 2010; Antoniou et al., 2020).The study does not consider the effects of long-term phenomena such as creep, shrinkage or tension-stiffening on concrete behaviour.
The basic parameters required for the definition of the plastic flow and the yield function of the CDP constitutive model are listed in Table 2, i.e.the concrete dilation angle ψ, the eccentricity ε, the ratio of initial equibiaxial compressive yield stress to initial uniaxial compressive yield stress (f bo/f co), and the ratio of the second stress invariant on the tensile meridian to that on the compressive meridian (Kc).Based on the relevant literature, the dilation angle may range between 10°and 30°(e.g.Lubliner et al.,1989; Alfarah et al., 2017).Following Alfarah et al.(2017), a value towards the lower end of this range is adopted(ψ=15°),indicating a less ductile concrete response.All other parameters are set to the default values suggested by Abaqus(2014).Commonly used relations are adopted for the uniaxial stress-strain response under compression (Chang and Mander,1994) and tension (Alfarah et al., 2017).The latter is illustrated in Fig.5c, compared to published experiments of concrete specimens under uniaxial tensile and compressive loading.A detailed model description and the validation of the modelling methodology may be found in Antoniou et al.(2020).

Table 2CDP model parameters.
The S400 steel rebars are modelled using truss elements.An elasto-plastic constitutive law with hardening is adopted,assuming typical mechanical properties: yield strength fy= 400 MPa, ultimate strength fu= 450 MPa, ultimate strain εu= 15%, Young’s modulus E = 210 GPa and Poisson’s ratio ν = 0.2.The outer andinner reinforcement comprises φ18 mm and φ22 mm rebars,respectively, placed at a distance s = 0.15 m in the transverse direction (Fig.3).The section design indicates lower reinforcement for the slab and supports(φ12 mm at 25 cm distance and φ12 mm at 50 cm distance, respectively).A cover depth of 5 cm and 2.5 cm is considered for the main tunnel section and the slab, respectively.The combined steel and concrete behaviour is simulated in Abaqus using the ‘embedded element’ technique, which assumes that rebars are embedded in concrete with the same degrees of freedom,i.e.introducing a perfect bond between the concrete and the rebar elements.The same modelling technique has been adopted in several studies employing the CDP model in Abaqus(e.g.Agalianos et al.,2020;Sakellariadis et al.,2020).Such an assumption implies that the concrete-steel bond degradation under repetitive cyclic loading cannot be captured, a limitation that is expected to affect post-failure structural behaviour.
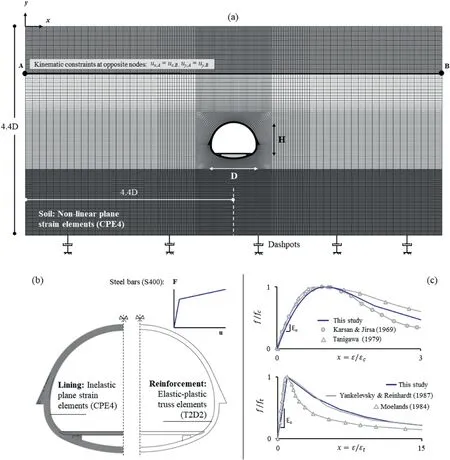
Fig.5.(a)Representative FE mesh of the soil-tunnel system;(b)Lining FE mesh and reinforcement details;and(c)Compressive and tensile concrete stress-strain curves employed for the CDP model, in comparison to literature experiments.
3.3.Chloride-induced corrosion modelling
Corrosion is the principal reason for structural decay due to ageing in various RC structures.The long-term durability of such structures is mainly affected by chloride-and carbonation-induced corrosion, resulting in alteration of the members’ mechanical characteristics, and more specifically in the reduction of the area and ductility of reinforcing steel bars, the significant decrease of concrete cover strength due to cracking and spalling,and the drop of the strength of the interface between concrete and reinforcement(;Ouzaa and Oucif,2018;Recupero et al.,2018).In the case of RC tunnels, corrosion due to chloride penetration is of paramount importance, especially for tunnels constructed within saturated soils that contain high amount of chloride.On the contrary,carbonation-induced corrosion may be considered negligible for our study, supported by on-site investigations in undergroundmetro tunnels that have indicated chloride ingress as the primary cause of RC corrosion in such structures(Li et al.,2020).This section presents the adopted methodology to predict corrosion initiation for the examined RC tunnel and its time-dependent effects on the structural properties of the lining.
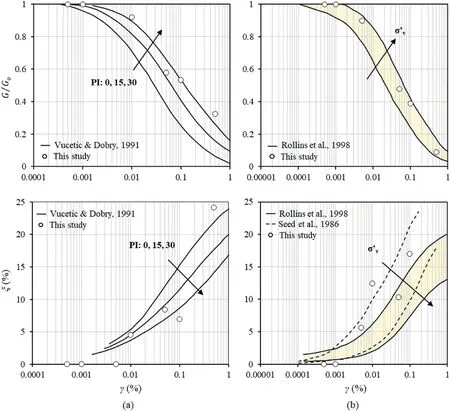
Fig.6.G-γ and ξ-γ curves for (a) the clay materials and (b) the gravel material adopted in the study.
There are only a few recent studies regarding the effects of reinforcement corrosion on the strength of tunnel linings (e.g.,Zhang and Mansoor, 2013; Showkati et al., 2021; Zhang et al.,2022), and no specific framework developed for the analysis and evaluation of tunnel degradation effects.Due to the lack of a methodology that accounts for the initiation of corrosion and its effects on the tunnel’s lining capacity, approaches referring to other structures (e.g.typical buildings or bridge piers) were used in the present study (as in Choe et al., 2008, 2009; Ghosh and Padgett, 2010; Simon et al., 2010; Yalciner et al., 2012; Pitilakis et al., 2014; Ghosh and Sood, 2016).These approaches are well documented and adopted as a corrosion assessment guideline by the fib-Task Group 5.6 (fib, 2006).In addition, previous research work on the effect of corrosion on the seismic vulnerability of tunnels also employs this particular methodology (Argyroudis et al., 2017).
3.3.1.Time to corrosion initiation
For the prediction of the corrosion initiation time due to the penetration of chloride ions,the rate of chloride ingress is modelled using Fick’s 2nd law of diffusion (Ghosh and Padgett, 2010; Afsar Dizaj et al., 2018).According to fib (2006), the time to corrosion initiation of embedded reinforcing bars inside concrete (Tcorr) can be evaluated by
where Dapp,Cis the apparent coefficient of chloride diffusion,Ccritis the critical chloride concentration,Cois the initial chloride content in the cement paste,X is the depth of concrete cover,Δx is the depthof the convection zone,Cs,Δx is the chloride content at depth Δx,and erf (z)is the error function.Owing to the lack of data for the site of interest, the values of the parameters involved in the diffusion process are based on fib (2006) recommendations, yielding Tcorr= 12 yr.Further details regarding the calculation procedure and the adopted parameters can be found in Appendix C.
3.3.2.Rebar mass loss percentage
The time-dependent percentage l(t)of rebar mass loss at time t after corrosion initiation may be evaluated as(fib,2006;Afsar Dizaj et al., 2018):
where D(t) is the residual steel bar diameter at time t after corrosion initiation, Dois the initial bar diameter, Pave(t) is the timedependent average corrosion penetration depth, and a is the ratio of the maximum pitting depth to the average reduced area known as the pitting coefficient.According to Vidal et al.(2004),a equals 2 for the simulation of uniform corrosion,while it varies from 4 to 8 for the simplified simulation of pitting corrosion alongside a reinforcement element when the spatial variability of pitting corrosion is not accounted for.Details regarding the calculation of Pave(t)are provided in Appendix C.
The variations of the reinforcement mass loss percentage l(t)and the residual outer reinforcement diameter D(t)within 100 yr of operational life for the examined RC tunnel are plotted in Fig.7a and b,respectively.For the case examined herein,it is assumed that chloride-induced corrosion only affects the outer tunnel reinforcement(due to the direct contact with the saturated soil),while the inner reinforcing bars at the main lining section and the connecting slab remain intact.Corresponding to a worst-case scenario,a quite high mass loss percentage of l(t)=30%affects the rebars by the end of the tunnel’s service life.The adopted percentage agrees with the maximum values of 25%-30% reported by Morinaga(2018) and Palsson and Mirza (2002) for rebars in service chloride environments, i.e.rebars extracted from RC structures (buildings and bridges)that suffered severe reinforcement corrosion due to chloride penetration (Du et al., 2005a).
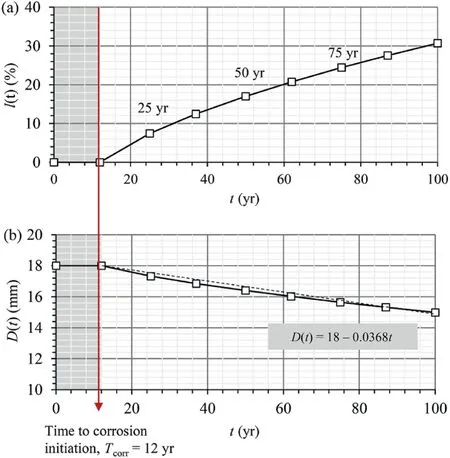
Fig.7.Chloride-induced lining corrosion: (a) Reinforcement mass loss percentage (t),and (b) residual outer reinforcement diameter D(t) within 100 yr of operational life(total diameter loss = 17%).
3.3.3.Modelling of corrosion-damaged rebars
The employed FE model accounts for the reduction in yield stress and ductility of reinforcing steel, using the empirical correlations proposed by Du et al.(2005a, b) and incorporated in a phenomenological hysteretic model for corroded reinforcing bars by Kashani et al.(2015):
where f'yand ε'uare the yield stress and ultimate strain of a corroded bar in tension, respectively; fyand εucorrespond to the respective values of the non-corroded bar;and l(t)is the percentage mass loss due to corrosion.Parameters βsand βeare empirical regression coefficients based on experimental data from rebars embedded in concrete, subjected to chloride-induced corrosive environments.Following Du et al.(2005a,b),they are assumed equal to 0.005 and 0.03,respectively,with the latter being a lower bound value based on the experimental results.The study acknowledges the inherent limitations that may arise from the fact that the degrading rebar yield stress and ultimate strain for the RC tunnel of interest are not calculated based on corrosion measurements conducted on underground structures exposed to chloride environments.However,due to the lack of sufficient data, such an approach has also been employed by other studies that examine the corrosion-induced degradation of RC infrastructure systems (e.g.in Panchireddi and Ghosh (2019) for bridges).The deterioration of bonding due to chloride-induced steel corrosion is simplistically not accounted for in this study, similar to several other studies on the subject (e.g.,Stewart and Al-Harthy, 2008; Ghosh and Padgett,2010).
3.3.4.Secondary effects of corrosion deterioration: concrete cover degradation
In addition to the loss of reinforcement cross-sectional area(and subsequent reduction of yield stress and ultimate strain), the corrosion of reinforcing steel may lead to secondary effects,such as the cracking and spalling of the concrete cover due to the accumulation of expansive rust products.The study employs the approach suggested by Coronelli and Gambarova (2004) to simulate the corrosion-induced cracking and spalling of concrete cover.According to their study on RC beams, the residual compressive strength of cracked concrete cover is calculated as
where fcis the compressive strength of the sound cover concrete,K1=0.1 corresponds to the bar roughness and diameter,εcois the strain corresponding to the peak compressive stress fc,and ε1is the average tensile strain of the cracked concrete which may be calculated using the following equations:
where b0is the width of the non-corroded section; bf- b0is the section width altered by corrosion cracking;nbarsis the number of bars in the section;wcris the total crack width for a given average corrosion penetration depth Pave(t); and νrustis the ratio of the volumetric expansion of the corrosion products for the noncorroded steel, with a suggested value νrust= 2 (Molina et al.,1993).The model has also been adopted by Biondini et al.(2014)and Rao et al.(2016) to assess deteriorating RC bridges.The following assumptions are made to adapt the model to the tunnel structure investigated herein:for known Pavevalues at time t after corrosion initiation, b0equals the non-corroded lining thickness(i.e.0.4 m),while the number of bars in the plane-strain RC section is equal to 2, accounting for both the outer and inner reinforcing elements.The tensile capacity of cover concrete is conservatively considered to diminish to very low residual values due to corrosion-induced micro-cracking, already at T = 12 yr since the onset of corrosion(i.e.at T =25 yr of the tunnel’s service life).The calculated residual strength properties of the concrete cover are reported in Table 3,along with the occurrence year and respective corrosion level in terms of mass loss percentage.
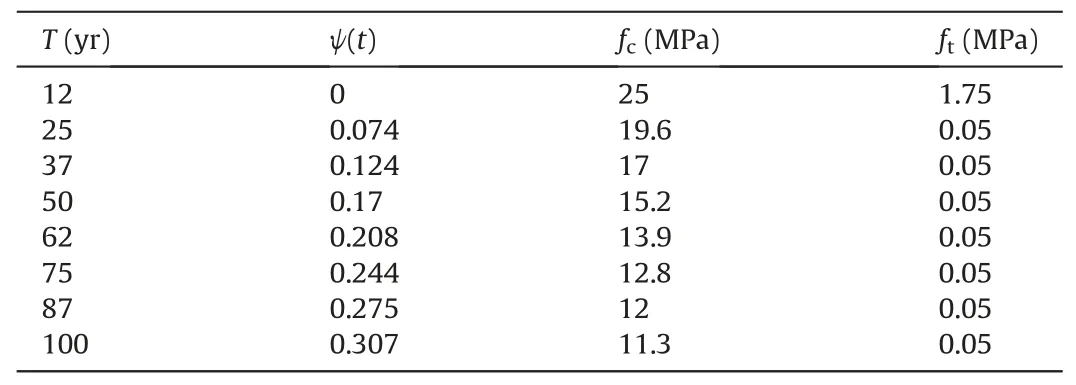
Table 3Residual strength properties of the concrete cover due to corrosion.
3.4.Numerical analysis stages
The FE analyses presented in the study are conducted in three stages:
(1) Stage 1 - Reaching the ‘reference’ stress state: The first stage corresponds to the static steps required to reach the ‘reference’ stress state prior to the dynamic load application.Proper simulation of the initial geostatic stress field requires that the FE domain initially corresponds to the soil stratum at rest.This is accomplished through a geostatic step via appropriately defined initial conditions: the soil’s vertical and horizontal effective stresses at rest are prescribed at the soil nodes through a set of field variables (Fig.8a).The coefficient of earth pressures at rest equals Ko= 1.During the second analysis step, the excavated soil is removed instantaneously, while a restriction is posed to the inward soil movement along the perimeter of the excavation hole.An internal pressure equal and opposite to the field stress around the tunnel is applied for this purpose.In the ensuing,the RC lining is activated,and the applied pressure is zeroed,allowing for the redistribution of soil stresses at the surrounding soil and subsequent soil/lining deformation.For the FE model at Position 1 (Fig.8b), soil heave of w = 0.0011 m is observed at the tunnel invert, while settlements of w = -0.0008 m occur at the tunnel crown,corresponding to w = 0.0003 m of settlement at the soil surface.As a result, the initial tunnel convergence due to gravitational loading equals Δw = |wcrown-winvert| = 0.0019 m.It is noted that the vertical effective stress values of Fig.8b correspond to the soil profile,not the RC lining.The adopted technique does not account for the stress redistribution and respective deformation during sequential excavation and tunnel advancing;the latter can be more effectively simulated using three-dimensional (3D)numerical models.Moreover, it leads to larger initial tunnel distress than expected during actual excavation conditions,where the soil around the excavation hole would be allowed to deform inwards prior to the lining placement,leading to a more relaxed stress state.Similar simplifications have been made in several studies that focus on the dynamic response of soil-tunnel systems,e.g.by considering the tunnel cast-inplace (Hatzigeorgiou and Beskos, 2010; Argyroudis et al.,2017).It should be noted that the research team has investigated volume loss effects and subtle details of the construction stage separately in Kampas et al.(2020).
(2) Stage 2 - Application of the long-term earthquake sequence:The second stage corresponds to the simulation of the longterm seismic sequence (Scenarios 1 and 2).The seismic motions are applied to the FE model through the dashpots layer.Moreover, the events are applied in time windows rather than in real-time, i.e.the system’s behaviour in the time interval between two successive seismic events is not explicitly accounted for.The latter implies that any consolidation phenomena associated with the dissipation of excess pore pressures in clay are not reflected in the results.To this end, two opposing mechanisms are not captured by the FE analyses:the first corresponds to the increase of soil stiffness following consolidation, and the second to the increase in soil settlements due to the consolidation phenomenon.Detailed analysis of the effects of excess pore water pressure dissipation on long-term ground movements around tunnel structures founded in clay is provided in Soga et al.(2017).Despite the limitation, the current analyses can offer significant insights into the mechanisms that govern damage accumulation in the RC lining under consecutive, lowamplitude seismic events.Furthermore, the Santiago clays are classified as low plasticity clays,which are very silty and reasonably permeable.Hence,they are not likely to develop significant excess porewater pressures.
(3) Stage 3 - Examination of modified dynamic characteristics: A white noise excitation is applied at the end of each seismic sequence to examine the modified dynamic characteristics of the soil-tunnel system.
3.4.1.Incorporation of corrosion effects into FE analyses
The FE analyses of the degrading RC tunnel incorporate the combined effect of seismic loading and chloride-induced corrosion on the mechanical response of the RC lining within 100 yr of service life.The latter requires the reduction of geometric and mechanical properties of the concrete cover and outer reinforcement during the analysis, which poses a challenge in terms of numerical modelling and is considered as follows:
(1) The FE code reproduces all discussed aspects of reinforcement corrosion by introducing a field variable in the analysis- hereafter named as FVx- which represents total analysis time.Following static loading, the mechanical properties of steel (elastic modulus, yield strength and ultimate strain)change based on the value of FVx,each time corresponding toa prescribed corrosion level.Instead of changing the rebar diameter,effective yield strength and elastic modulus values are considered, which result in correct values of axial stiffness EA and yield axial force f'y(t), based on the appropriate level of mass loss percentage.
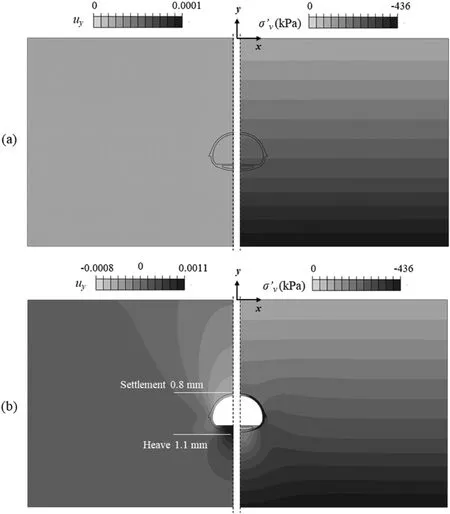
Fig.8.Stage 1 of the FE analysis.Vertical displacement (uy) and vertical effective stress (σ'v) contours after (a) the geostatic step, and (b) the lining placement, for Position 1.
(2) A simplified approach is adopted to numerically reproduce the corrosion-induced damage on the concrete cover.The CDP model displays convergence issues due to the sharp changes in the evolution of damage variables within the analysis; hence the model cannot be paired with the same approach utilized for rebars.Instead, the Mohr-Coulomb model is adopted herein to simulate the concrete cover behaviour in a corrosive environment.Upon proper calibration,the model can simulate concrete behaviour,as indicated by several previous studies or software recommendations(Lelovi´c et al., 2019; Luo et al., 2019; PLAXIS, 2019; Yu et al.,2021).In our case, two values of Poisson’s ratio were considered: a value of v = 0.2 for the non-damaged lining prior to corrosion initiation and a value of v = 0 for the damaged lining, according to EC2 recommendations for fissured concrete.The plasticity parameters of the Mohr-Coulomb model (friction angle φ, cohesion c, dilation angle ψ, and tension cut-off) are obtained from the compressive and tensile concrete strengths at each level of corrosion according to the representation of the yield surface shown in Fig.9.The change of concrete strength properties depending on corrosion levels is conducted based on the value of the field variable FVx.Moreover, a conservative assumption is made herein regarding the concrete cover elastic modulus:upon corrosion initiation, the initial elastic modulus is decreased to the value of 10 GPa, following the EC2 guidelines for damaged RC sections, which propose the use of an effective elastic modulus equal to half of the initial value for cracked sections in numerical analyses or analytical calculations (EN1992 Eurocode 2, 2001).
4.RC tunnel response under long-term seismic shaking
4.1.Identification of the system’s natural frequencies
Modal testing with the transfer function method was employed to obtain the modal parameters of the examined soil-tunnel system in the FE models(Tunnel Positions 1 and 2).The method uses a classical modal analysis approach with fast Fourier transform(FFT)to establish the transfer function between different model points.This type of analysis yields equivalent results to the eigenvalue(modal) analysis in Abaqus for the initial (undamaged) system condition.However, the transfer function method also allows for the identification of changes in the soil-tunnel system after the induced earthquake sequence, based on the modification of associated dynamic characteristics.
Low-amplitude, band-limited white noise with a zero mean random Gaussian signal within the 0.1-50 Hz frequency band,with 11 s duration,a standard deviation of 0.005g,and a sampling rate of 100 Hz was used as the excitation signal.Natural frequency estimation was based on the transfer function S, i.e.the power spectrum calculated for a reference point(RP)within the model,divided by the power spectrum of the base excitation.Several RPs were initially considered (at the invert level, the surface level, and the soil layer interfaces) to cross-correlate results and improve the identification process.Results for the RP at the top of the middle soil layer are plotted in Fig.10,as these were found to illustrate the model eigenfrequencies more clearly.Three distinct peaks appear on the graph,indicating the first to third observable system natural frequencies within the 0-10 Hz frequency band.These correspond to values of f1=1.6 Hz,f2=4.0 Hz,f3=6.3 Hz(Tunnel Position 1)and 6.1 Hz(Tunnel Position 2).The system’s first natural frequency(1.6 Hz) corresponds to the translational mode causing ovalling deformation on the lining.The respective mode shape, which is expected to be excited during an earthquake event, is depicted in displacement contours in Fig.10.
4.2.Intact tunnel deformation under successive seismic loading
The developed FE models are subjected to Scenarios 1 and 2.The study assumes that the tunnel is not repaired between successive seismic events, although, in reality, repair interventions may initiate before the end of the structure’s service life (Panchireddi and Ghosh, 2019).The two different tunnel embedment depths allow for the investigation of kinematic effects on structural performance.Results are displayed in Figs.11-13.
Fig.11 illustrates the soil plastic strain contours(PMAG)for the two positions at the end of Scenario 2.Contours indicate increased permanent strains for the soil around Position 2 due to the more pronounced lateral soil movement.The wave propagation throughout the adopted soil profile is almost identical in the two cases, yet the shallow tunnel is subjected to higher kinematic distress during the applied seismic loading.As repeatedly reported in several studies(e.g.Bilotta et al.,2009;Tsinidis et al.,2020),the kinematic loading induced by the surrounding soil prevails over inertial loads stemming from the oscillation of the tunnel itself;therefore, the structural response may be directly associated with soil deformation.In this case,the gravel layer of the examined soil profile is very stiff and, therefore, insensitive to shaking.
On the other hand, the more flexible overlying layers (Clay-2 and Clay-1) deform under the applied seismic motions, displaying increasing lateral deformation towards the ground surface.The latter is also confirmed by the first system eigenfrequency modal shape displayed in Fig.10.At the end of Scenario 2, the maximum values of PMAG for Position 1 are concentrated at the gravel-clay interface, as the upper soil body translates laterally due to shaking, while the lower part behaves almost like a boundary.For the tunnel at Position 2, a deeper bulb of permanent strains has developed below the tunnel, along with significant straining at both sides of the structure.
Fig.12 offers an overview of the system response to cumulative seismic loading from Scenarios 1 and 2 in terms of acceleration time histories α-t at the invert and soil surface, vertical lining displacements, and vertical convergence Δw (i.e.the relative vertical displacement between the crown and the invert).The tunnel seismic response data are also tabulated in Table 4 for ease of reference.Fig.12a refers to the accelerations calculated by the FE model with the tunnel at Position 1 (deep tunnel), yet results indicated almost identical values for the tunnel at Position 2.The input acceleration signals reach the RC tunnel approximately unaffected(in terms of amplitude)by wave propagation.For Position 1, settlements at the tunnel crown and heave at the tunnel invert increase incrementally as a function of acceleration amplitude throughout Scenario 1 (Fig.12b, black lines).This results in coseismic vertical convergence of dΔw1(P1) = Δwf,1(P1) - Δwo(P1) = 4.7-1.9 = 2.8 mm (Fig.12c), where Δwf,1is the finally accumulated convergence value after 11 seismic events, and Δwocorresponds to the value acquired during static loading.Shaking under the 1985 Valparaiso record at the end of the low-amplitude sequence(Scenario 2)increases co-seismic convergence by 2.8 mm for Position 1, leading to a final value of dΔw2(P1) = 5.6 mm(Fig.12c).It is observed that a single 0.15g intensity event (at the invert level) produces similar permanent co-seismic deformation compared to the one caused by the preceding low-amplitude sequence.

Table 4Intact tunnel seismic response data under Scenarios 1 and 2 (read in conjunction with Fig.12).
The comparison of vertical convergence between the two examined tunnel positions indicates that the shallow tunnel (Position 2) is less vulnerable to cumulative vertical seismic deformation (Fig.12c).As expected, the tunnel experiences slightly lower static convergence Δwo(P2) due to the lower overburden pressure at the initiation of seismic loading.During subsequent loading under Scenario 1, the tunnel develops a relative convergence value of dΔw1(P2) = Δwf,1(P2) - Δwo(P2) = 4.1-1.6 = 2.5 mm, which is further increased to dΔw2(P2) = 4.3 mm after Scenario 2.
However,it is interesting to observe that the shallow structure is subjected to a different seismically-induced vertical displacementpattern than the deep tunnel(Fig.12b).Despite commencing from the same static displacement, the shallow tunnel invert experiences a more considerable uplift (i.e.a difference of 5 mm is measured at the end of Scenario 2).The uplift invert displacements increase due to the soil stiffness degradation below the tunnel and continue to accumulate up to the termination of seismic loading.The behaviour resembles the one reported in Zheng et al.(2021)for tunnels in sand experiencing soil liquefaction with subsequent loss of soil strength and stiffness.At the same time, the tunnel crown also uplifts at a slower rate,in stark comparison to Position 1,where the crown continuously settles during each consecutive earthquake event.The soil deformation in the vicinity of the shallow tunnel forms circular loops around the sides, subsequently inducing the observed structure uplift.Since the tunnel is lighter than the surrounding soil, the soil at the tunnel bottom applies a force that causes the structure to uplift.Being closer to the Gravel/Clay-2 boundary, the deeper tunnel (Position 1) is naturally subjected to lower lateral deformation (Fig.11 illustrates no signs of increased soil plasticity at the tunnel sides),a fact also confirmed by Fig.13a,which plots in comparative terms (Position 1 vs.Position 2) the horizontal displacements experienced along the centerline of the FE models at a single,exemplary instance of EQ(4)(t=7.12 s).The soil-structure interaction effects highlighted in this section are bound to influence the lining performance,as illustrated later in the developed cracking patterns.

Fig.9.(a) Schematic representation of the Mohr-Coulomb parameters deduced for the concrete cover simulation, and (b) Deterioration of concrete cover compressive strength.
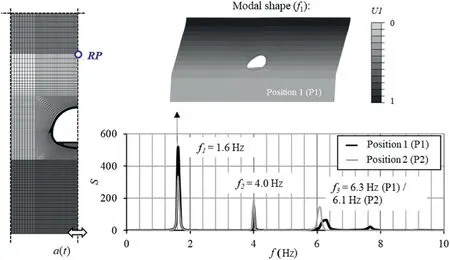
Fig.10.White noise for eigenfrequency identification: intact lining prior to earthquake loading.
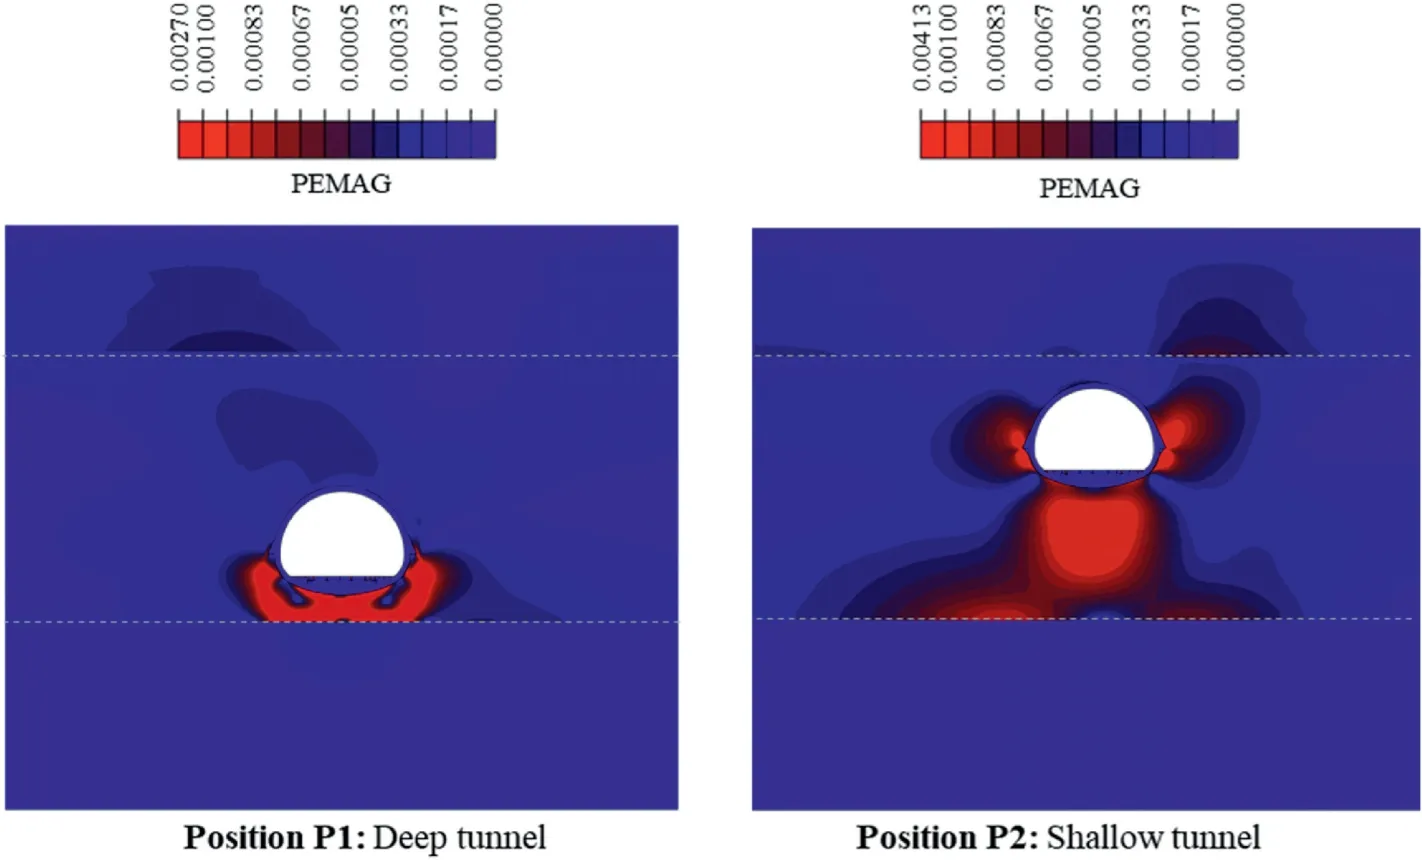
Fig.11.Magnitude of soil plastic strains at the end of Scenario 2 for positions P1 and P2.
Another interesting fact is the trend of maximum surface settlements w at the end of Scenarios 1 and 2 for the two tunnel configurations.The profiles illustrated in Fig.13b indicate that the models develop a different settlement pattern near the ground surface, owing to the different soil-structure interaction mechanisms developed in each case.A settlement increase from w=-0.3 mm to w=-0.92 mm is observed for Position 1 at the end of shaking, with the Valparaiso event further increasing this value by approximately 50% in Scenario 2 (w = -0.0014 m).On thecontrary,the ground surface in Position 2 follows the movement of the tunnel, thus eventually being uplifted throughout seismic shaking (Fig.13b, grey lines).
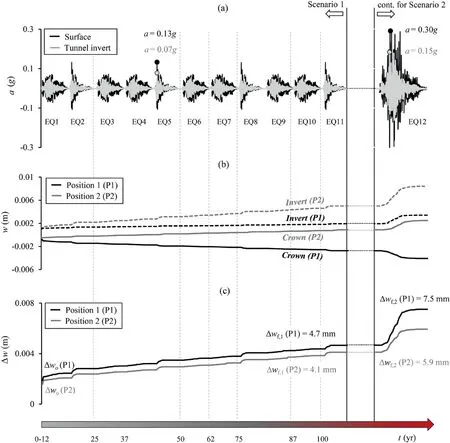
Fig.12.Intact system response under Scenarios 1 and 2,in terms of(a)acceleration time histories(α-t)at the tunnel invert and soil surface,(b)vertical displacements of the tunnel crown and invert, and (c) vertical lining convergence (Δw).
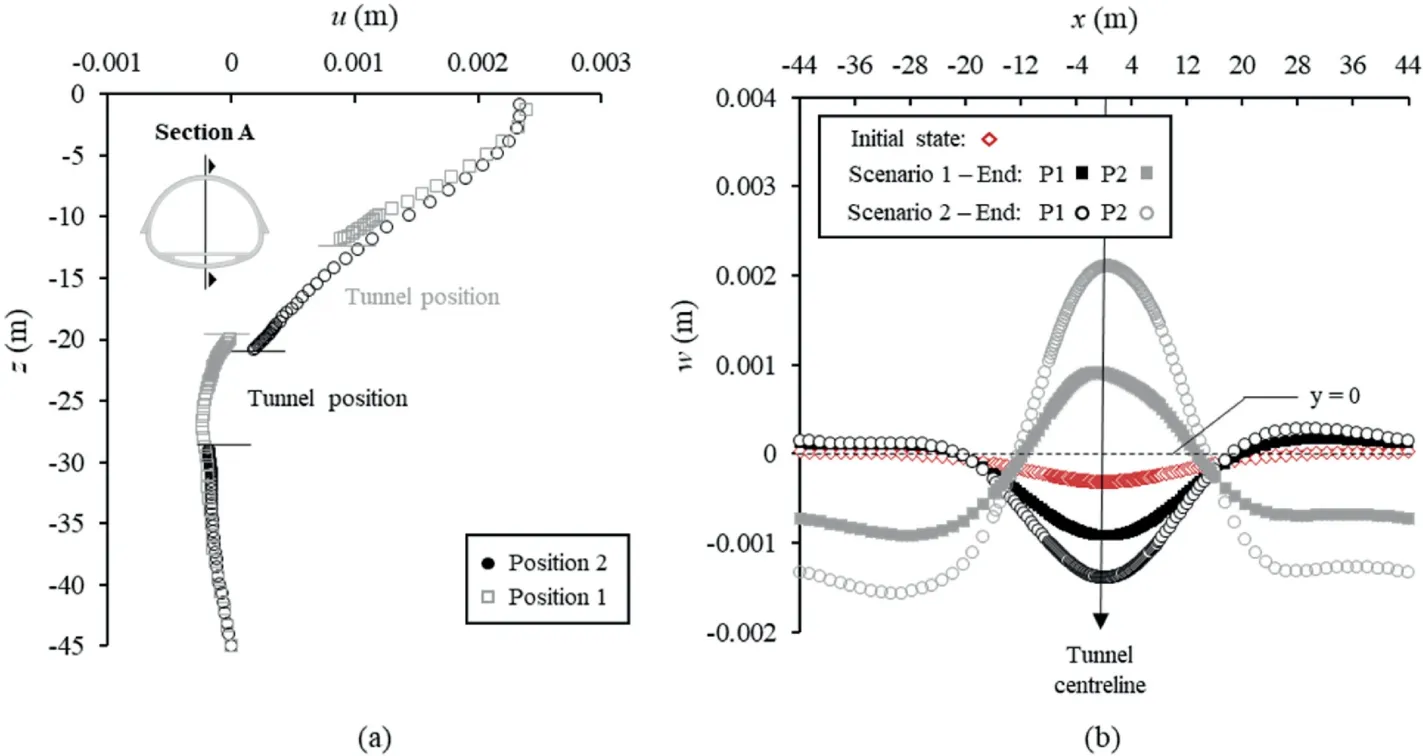
Fig.13.(a) Horizontal displacements of Section A during EQ (4) at t = 7.12 s (Positions 1 and 2), and (b) Vertical displacements at the ground surface after Scenarios 1 and 2(Positions 1 and 2).
4.3.Long-term co-seismic tunnel deformation under chloride exposure conditions
The tunnel’s long-term performance under cumulative seismic loading in a corrosive environment is presented in comparison to the intact tunnel behaviour.Results from both tunnel positions are displayed in Figs.14-17.The seismic response data of Fig.14 are also tabulated in Table 5 for ease of reference.Corrosion is assumed to inflict the same degradation pattern on both tunnel sections,considering that they lie in the same (saturated) soil layer.
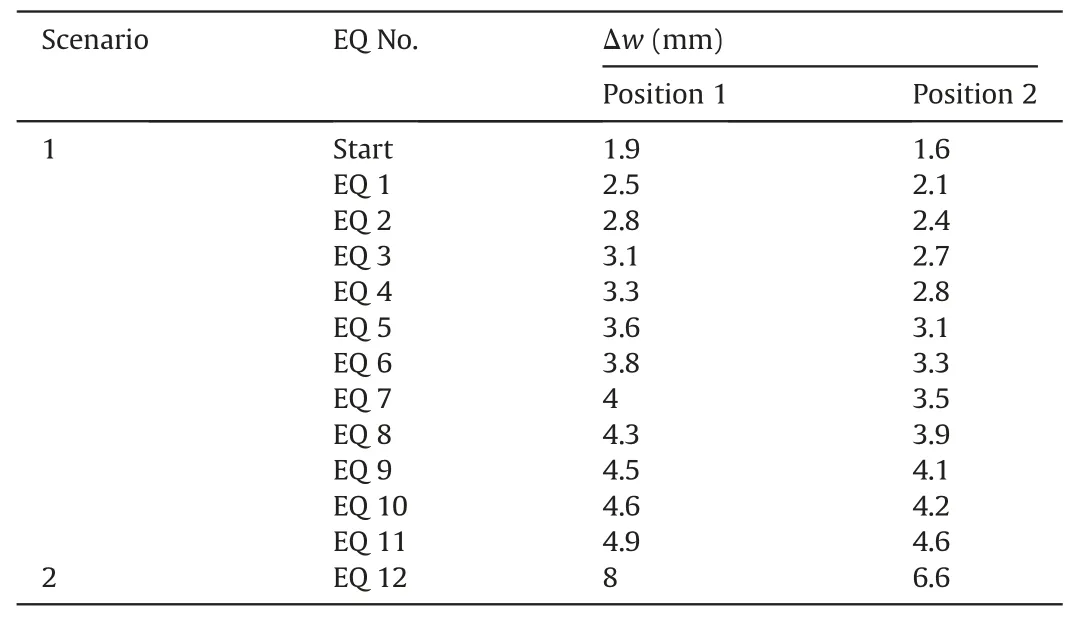
Table 5Co-seismic vertical convergence data for the degrading tunnel sections under Scenarios 1 and 2 (read in conjunction with Fig.14).
Fig.14 plots the vertical lining convergence after Scenarios 1 and 2 for the examined models.The horizontal axis marks the initiation of a new time window in years,while the vertical dashed black lines indicate the associated corrosion level: prior to every new time window,an intermediate step of rebar and concrete cover material change occurs.The corroded sections develop identical deformation to their non-degrading counterparts until the 25th year of the tunnel’s service life,since l(t)remains equal to zero.The first two records are assumed to occur within the first 12 yr of the tunnel’s lifecycle,while the 3rd event is assumed to strike after the 25th year when the level of mass loss percentage has reached l(t) = 7.4%.Results indicate an increase in permanent lining deformation due to increasing corrosion intensity:dΔw = 0.5 mm for Position 1 and dΔw=0.7 mm for Position 2,which shows that the effect of corrosion is greater for the shallow tunnel.This must be the effect of corrosion because the effects of only earthquake loading led to smaller tunnel convergence for Position 2.The final convergence values at the end of Scenario 2 are not significant in absolute terms for the degrading tunnels,yet they correspond to 9%and 16%of additional co-seismic convergence at the end of shaking for Positions 1 and 2, respectively (Fig.14).For the case examined herein, corrosion-induced deformation constitutes a low and approximately constant percentage of the final co-seismic deformation,calculated between 6%and 16%for the cases examined(6%corresponds to the response of the lining under Scenario 1).However,it will be shown in the ensuing that this seemingly small percentage may have alarming effects on the progression of crack patterns during Scenario 2.
4.3.1.Cracking patterns in the intact and degrading tunnel structure
To determine and compare the areas of damage that give rise to permanent co-seismic displacements for both the intact and degrading tunnel structure, contours of plastic equivalent tensile strains (PEEQT) on the lining are illustrated in Figs.15 and 16.The intact RC lining remains undamaged until EQ (7), after which damage initiation occurs(Fig.15a).The first signs of lining damage appear at the edges of the horizontal slab.More importantly,however, they are more pronounced in the case of the shallow tunnel.As discussed in the previous section, the shallow tunnel may experience lower vertical convergence due to the reduced initial static load and the uplift of the entire RC section(both invert and crown)during shaking.However,it is subjected to larger lateral loads that eventually lead the section to faster degradation.By the end of Scenario 1(Fig.15b),additional cracks appear in the middleof the slab and the blinding concrete for both positions, while minor cracking appears at the outer side of the left sidewall of the shallow tunnel.At the end of Scenario 2 (Fig.15c), extended microcracking is observed at the slab and the blinding concrete for both sections.At the same time,damage has also been developed at the external side of both sidewalls, indicating that the damage mechanism has ‘migrated’ to the next most vulnerable part of the lining, i.e.the one already sustaining the highest stresses due to static loading (refer to subsequent Fig.17).The displayed cover damage is expected to have a negligible effect on structural operability, which is rather more threatened by the cracks on the slab,particularly due to possible misalignment of the train rails.The slab practically acts as a fuse or sacrificial element, being the only structural element suffering non-trivial damage under the applied loading.Interestingly, the shallow section also displays slight damage on the inner part of the left shoulder at the end of Scenario 2.Overall,the mean tensile damage on the RC lining after Scenario 2 is very low,reaching dt,mean=0.01 and 0.016,respectively,at the end of loading(dtstands for the CDP damage variable in tension,i.e.it would become 1 for zero section tensile capacity).
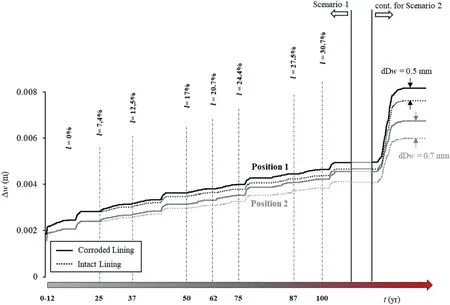
Fig.14.Vertical convergence of degrading vs.intact lining under Scenarios 1 and 2.
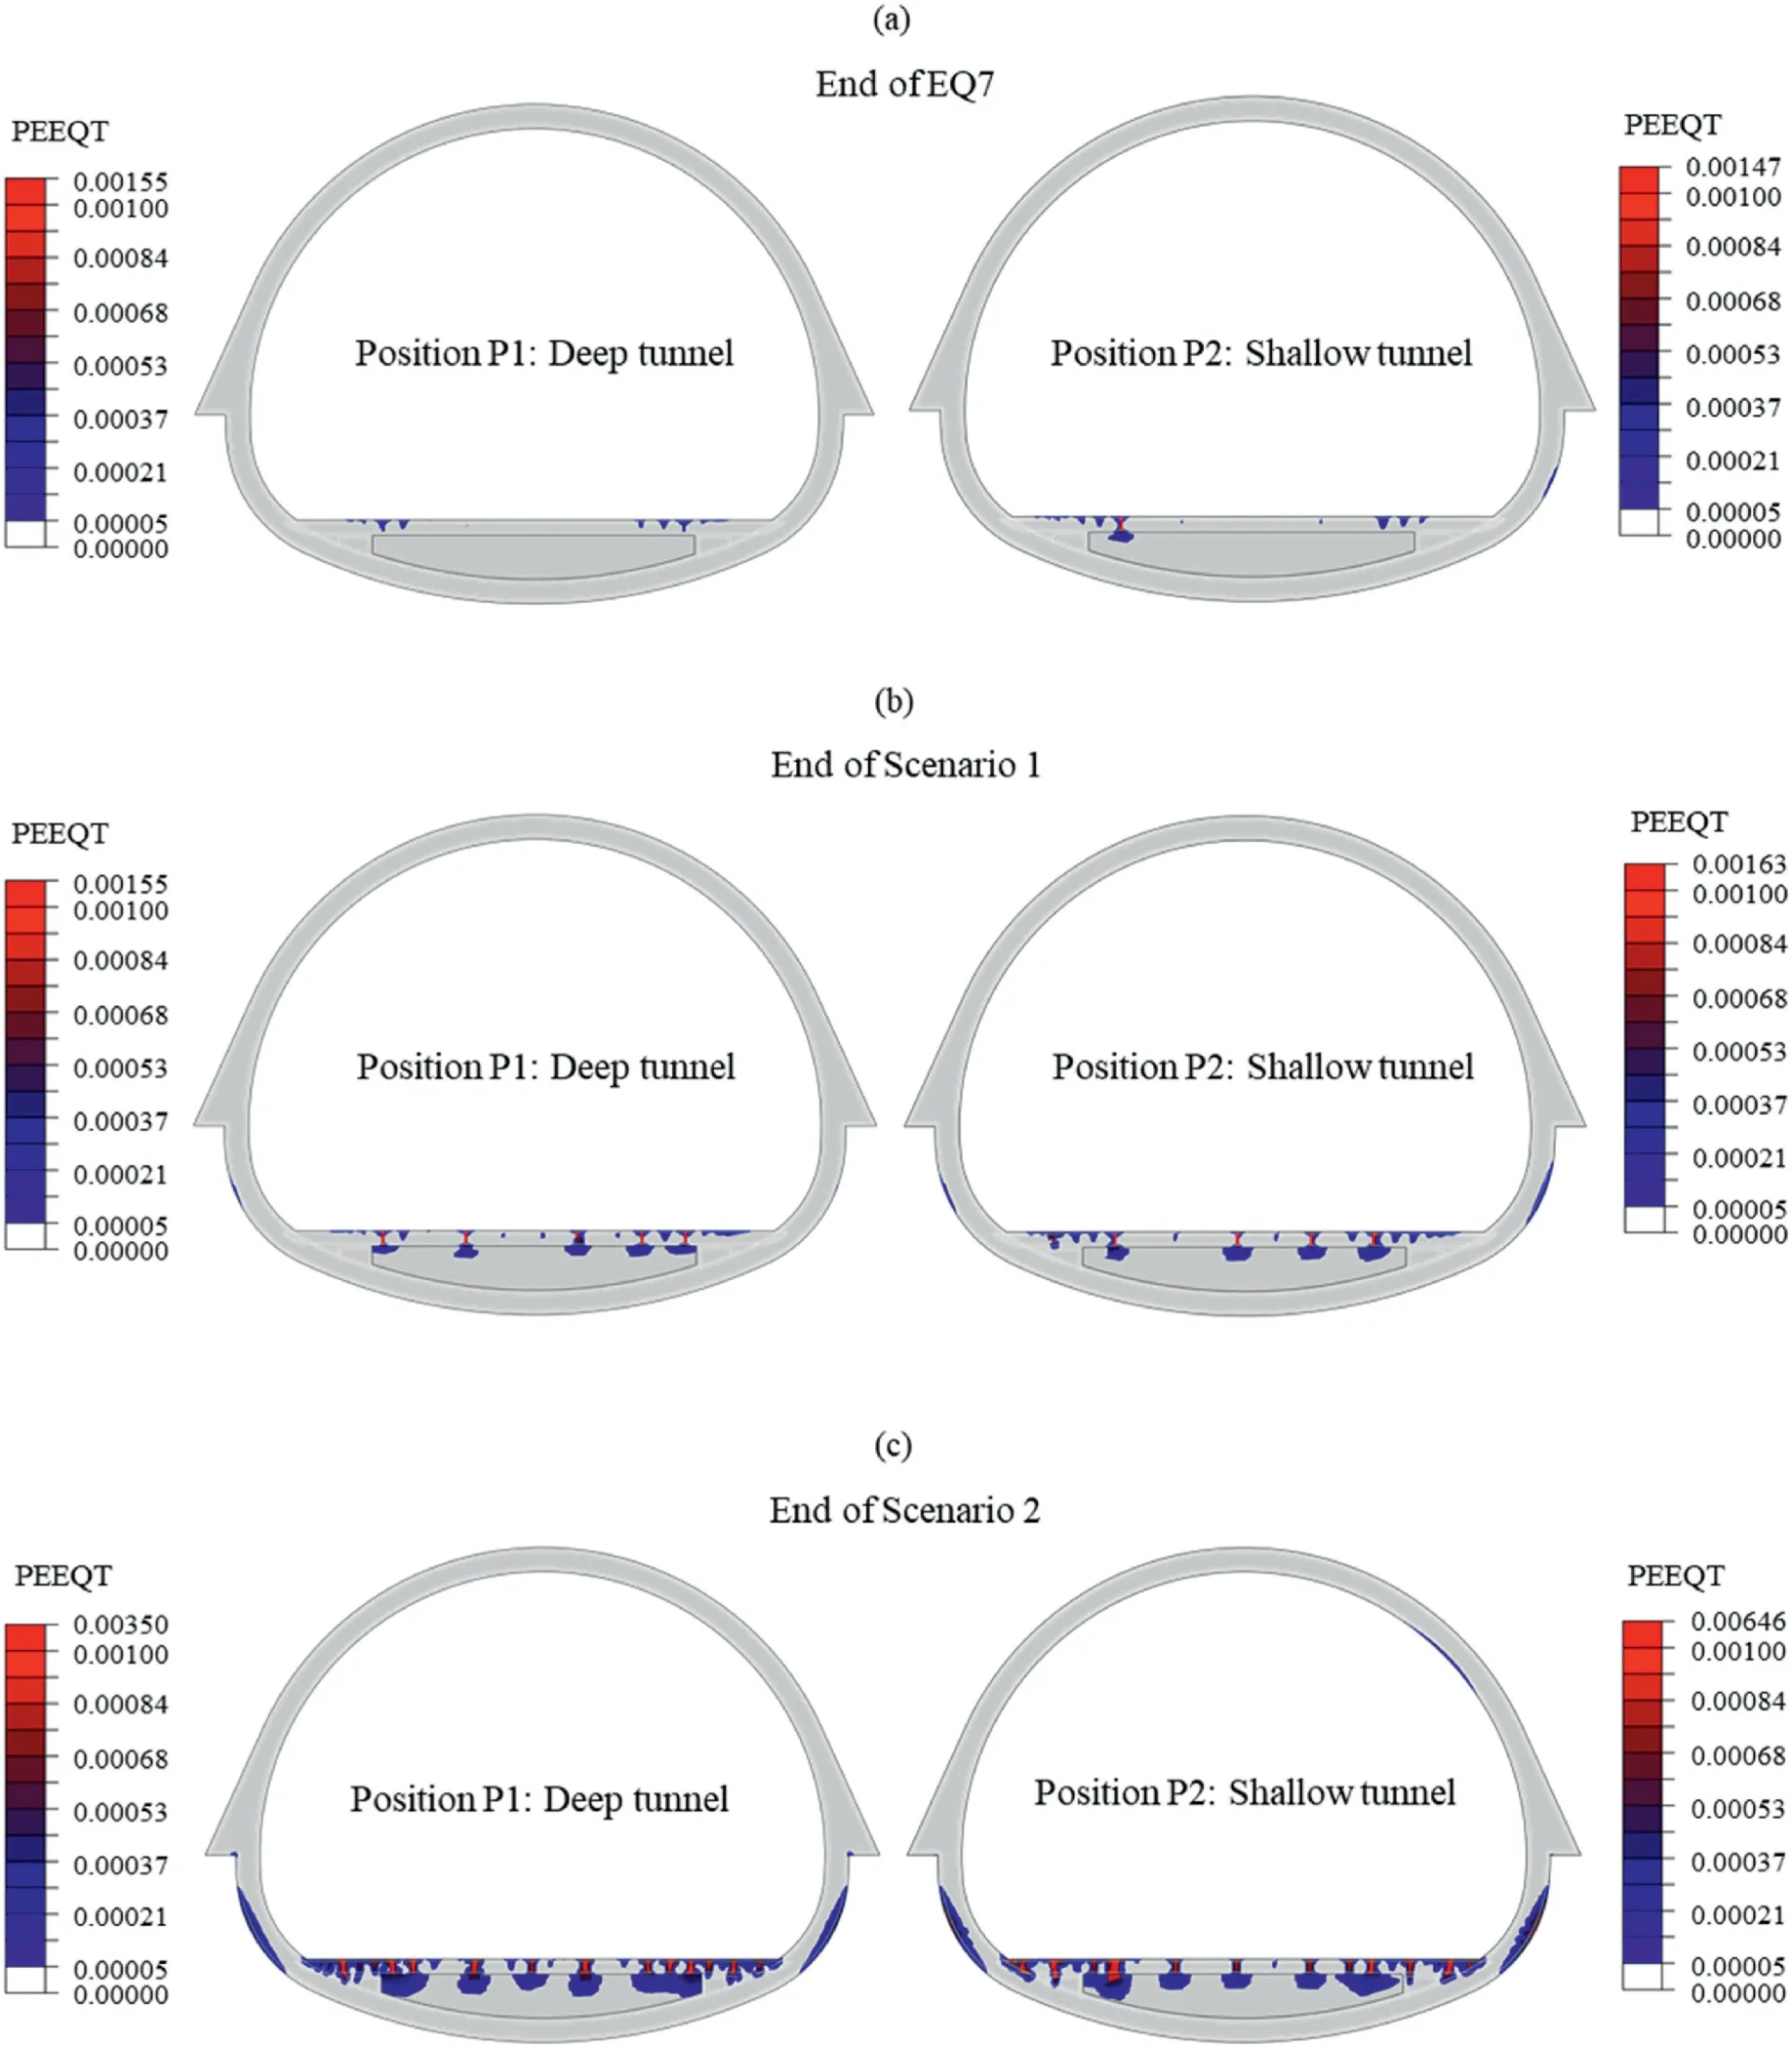
Fig.15.Intact lining at(a)the end of EQ 7,(b)the end of Scenario 1,and(c)the end of Scenario 2(Positions P1 and P2):Magnitude of plastic equivalent tensile strains at the lining.
Corrosion leads to faster structure deterioration during seismic loading,which is mainly correlated to the development of cracks at the exterior side of the invert for both Positions P1 and P2(Fig.16).In contrast to the non-degrading section, there is now apparent damage to the concrete cover in that area.The latter occurs after cracking has already developed on the slab, on a part that, crucially, is noteasily accessible for maintenance or retrofitting.At the end of Scenario 2, deeper cracks have developed on the exterior side of the invert,penetrating the section beyond the outer reinforcement layer.It is observed that the damage at the left shoulder of the shallow tunnel has not further progressed due to corrosion,as the inner sides of the tunnel are less prone to corrosion-related deterioration.The mean tensile damage on the lining is dt,mean= 0.03 and 0.035 for Positions 1 and 2,respectively,at the end of Scenario 2.

Fig.16.Degrading lining at(a)the end of EQ 7,(b)the end of Scenario 1,and(c)the end of Scenario 2(Positions P1 and P2):Magnitude of plastic equivalent tensile strains at the lining.
The cracking and spalling induced on the lining section due to the combined effect of corrosion and seismic loading lead to redistribution of soil pressures around the lining.The normal pressures acting on the outer surface of the most critical lining section (i.e.the invert and sidewalls) are plotted in Fig.17.The graphs compare the distribution of pressures (CPRESS) at the beginning and the end of Scenario 2, indicating a concentration of stresses near the damaged area of the sidewall for the deeper tunnel,with a subsequent increase in maximum normal pressures equal to 60 kPa.The picture is different for the shallow tunnel:cracking on the sidewalls results in a redistribution of stresses around the damaged area,yet the total normal pressure is reduced compared to the initial condition due to the overall uplift of the section during seismic loading.

Fig.17.Degrading lining under Scenario 2:Normal pressures(CPRESS)on the outer surface of the critical lining section at the beginning and the end loading for(a)Position 1,and(b) Position 2.
4.3.2.Damage-induced changes in the system’s frequency characteristics
Combination of corrosion damage with long-term seismic loading was expected to induce changes in the modal parameters of the soil-tunnel system, i.e.decrease the system’s dominant frequencies due to the damage-induced stiffness reduction.However,the 1st natural frequency of the system,measured via the transfer function S for the degrading structures after Scenario 2, does not reflect such a trend; it remains around its initial value for both Positions 1 and 2 (Fig.18).The observed behaviour may be merely explained by the fact that the first mode is primarily controlled by the soil stratum,rather than the structural response of the lining.Tothis end,the small decrease of(mean)lining stiffness attributed to the developed cracks may not be contributing much to the change in the overall stiffness of the system.At the same time,however,the maximum shear strains of the order of γ=10-3develop within the clay layers during shaking.In particular, in the case of Position 2,these are observed to an extended area around the tunnel.Based on the G-γ curves for those layers (Fig.6), such strain levels are expected to decrease the soil’s shear stiffness by more than 50% for the areas of interest.However, the system’s dominant frequency seems insensitive to that amount of developed soil degradation as well.
It is interesting to observe that the shape of the transfer function has significantly changed after the applied earthquake sequence.Two distinct peaks appear on the graph,close in frequency content to the initial frequency value at both sides.The plotted transfer function visually resembles that of an SDOF system equipped with a tuned mass damper (Den Hartog, 1940), indicating the energy exchanging interaction of two masses.A possible assumption regarding this response would be that the extended cracking generated at the tunnel slab turned it to an independently moving damping mass.Yet, the magnitude of the overall effect on the transfer function may well signify that this is rather a soil-mass related effect.
Although the findings in terms of natural frequency are rather inconclusive,a significant change in modal damping is observed for the 1st vibration mode,reflected in the maximum amplitude of the S-f curves.The latter experiences a decrease of approximately 80%and 75% for Positions 1 and 2, respectively, associated with the energy dissipation within system.A large part of the seismic excitation force inserted into the system is entrapped and dissipatedthrough the cracks/plastic points developed onto the lining and the surrounding soil.

Fig.18.White noise excitation:comparison of transfer function S between the illustrated reference point(RP)and the model base,at the initial system state and after Scenario 2 for the degrading tunnel structure (Positions 1 and 2).
5.Limitations
The present study is the first to offer insights into the response of non-degrading and degrading tunnel structures under cumulative seismic shaking.Nevertheless, the following study limitations are recognized and are outlined here as recommendations for future work:
(1) Considering the metro traffic loads could add value to the analyses (e.g.as in Dikmen, 2016), offering a complete representation of the long-term structural loads.
(2) The effects of consolidation due to the dissipation of excess pore pressures in clay after subsequent seismic events should be accounted for, as this will probably affect the overall seismic response of the system.
(3) Modelling of the corrosion-induced degradation of the RC lining calls for further improvements.The study employs a conservative model for the simulation of the concrete cover degradation, while it neglects the concrete-rebar bond deterioration, which might lead to higher overall percentages of damage.Moreover, the spatial variability of pitting corrosion should be further explored.
(4) Long-term concrete behaviour phenomena such as creep,shrinkage,or tension-stiffening could be considered in future developments, along with the potential deterioration of concrete mechanical properties due to sulfate attack.A detailed investigation of the latter is presented in the recent study of Showkati et al.(2021), albeit not considering the simultaneous effect of life-cycle seismic loading.
(5) The selection of a representative earthquake load sequence could become more realistic using appropriate machine learning techniques based on historical data assembled from international earthquake catalogues.
(6) The employed sequence of low to moderate amplitude events is not shown to induce critical deformation to the examined RC lining.However, this conclusion cannot be generalised.Further analyses would be required for tunnels in variable soil profiles.Moreover, the effect of higher intensity records should be investigated (e.g.for structures located closer to a seismogenic source), along with the characteristics of the seismic motion, such as the frequency content or the earthquake duration.
6.Conclusions
The study presents the combined effects of chloride-induced corrosion and cumulative seismic shaking on the long-term performance of an actual RC metro tunnel in Santiago, Chile.The estimation of seismic demand (i.e.of the selected earthquake scenarios)is based on local seismicity data and the soil characteristics at the location of interest.The employed seismic sequences are applied in a deterministic manner to the tunnel structure using transient, nonlinear FE analysis.Two different tunnel embedment depths are investigated.The effects of corrosion deterioration are demonstrated in the form of time-dependent loss of rebar area and cover concrete stiffness and strength.The study highlights the influence of ageing and sequential shaking on cumulative lining deformation, the development of cracks, and the modal characteristics of the intact and degrading systems.
Considering cumulative seismicity, initial results indicate that multiple, low-amplitude events (with maximum accelerations of the order of 0.05g-0.07g at the tunnel level) drive the nondegrading RC tunnel beyond its elastic regime (Scenario 1).Small-amplitude, permanent deformation develops towards the end of long-term shaking, followed by microcracking at the horizontal tunnel slab.A subsequent single event of increased intensity(maximum acceleration of 0.15g at the tunnel level) can induce comparable total damage to the system(Scenario 2).The co-seismic vertical tunnel movement differs between the two tunnel positions.The invert and crown of the shallow tunnel (Position 2)systematically uplift throughout seismic shaking due to the lower overburden pressure and developed shear strains at the sides and bottom of the structure,which form circular loops around the sides,forcing the entire structure to uplift.However, this is not the case for the deeper tunnel (Position 1), where the higher overburden pressures cause the tunnel crown to settle under each successive seismic event, leading to larger co-seismic section convergence.Despite that, the deep tunnel performs slightly better under successive earthquake loading.The latter is evident by the reported RC lining cracks at the end of shaking and is explained by the deeperlining being subjected to lower kinematic stressing during the applied earthquakes, owing to its proximity to the quite stiff bottom gravel layer.This special response feature may differ in other tunnel locations, where stiffer ground lays deeper.Overall, the horizontal slab and outer part of the sidewalls are considered the most vulnerable parts of the RC tunnel in the examined configuration.The slab acts as a fuse,attracting damage,which favours the rest of the tunnel lining.
A comparison of seismic damage between the intact and the ageing tunnel reveals a non-trivial impact of corrosion deterioration on the structure’s seismic performance.The percentage difference between the corroded and non-corroded cases is 9% and 16% for the deep and shallow tunnels, respectively, at the end of Scenario 2, indicating increasing trends with the number and intensity of earthquake events.Due to the corrosion-induced cracking and spalling of the concrete cover, deeper and more extended cracks appear at the tunnel sidewalls, where visual inspection detection is impossible,which has implications for tunnel maintenance.Efforts to estimate structural damage at the end of the seismic sequence based on changes in the modal characteristics of the system indicated that modal damping significantly increases due to cumulative shaking,owing to the development of cracks and plastic points within the soil-structure assembly that absorb part of the applied seismic energy.On the other hand, modal testing proved inconclusive in determining the system’s altered natural frequency since the radical change in the shape of the transfer function did not allow for easy comparisons.Still, such changes could serve as effective indicators of damage and possible ageingrelated couplings.
The analysis shows no catastrophic consequences of the applied load combination on tunnel performance.However, increased serviceability problems are observed, which could affect the operational capacity of the tunnel.Despite being seemingly casespecific, the study offers significant added value in the seismic damage assessment of tunnel structures under the (until recently neglected)combination of long-term seismic shaking and corrosion deterioration via the proposed methodological framework.The presented results may not be directly generalizable, of course.However, they highlight the importance of considering both longterm effects in the seismic assessment of tunnel structures and provide several unique observations that do not match currently established engineering intuition on structural damage assessment.At the same time,the presented methodology could well be employed for different soil-tunnel layouts and different corrosion/seismic environments to predict the extent and location of lining damage stemming from complex combinations of realistic lifetime loading.To this end, the present study paves the way for further works and monitoring endeavours, which shall allow the community to fully understand the problem,investigate the generality of the presented results and approve/disprove the generality of any of the observations made herein.
Declaration of competing interest
The authors declare that they have no known competing financial interests or personal relationships that could have appeared to influence the work reported in this paper.
Acknowledgments
This paper is part of the Shaking Tunnel Vision project supported by the Newton Fund: EPSRC, UK & CONICYT, Chile (EPSRC Grant No.EP/N03435X/1)and the Extending Shaking Tunnel Vision project funded jointly by the Global Challenge Research Fund(GCRF) and the Higher Education Funding Council for England(HEFCE) under account number 95541229, both led by the University of Leeds.The authors would also like to thank Edgardo González Lizama of Metro de Santiago S.A.,Chile,for his continuous support and the provision of important local information.
Appendix A.Supplementary data
Supplementary data to this article can be found online at https://doi.org/10.1016/j.jrmge.2022.10.003.
 Journal of Rock Mechanics and Geotechnical Engineering2023年3期
- Journal of Rock Mechanics and Geotechnical Engineering的其它文章
- Development of mathematically motivated hybrid soft computing models for improved predictions of ultimate bearing capacity of shallow foundations
- A post-peak dilatancy model for soft rock and its application in deep tunnel excavation
- Numerical simulation of fatigue crack propagation in heterogeneous geomaterials under varied loads using displacement discontinuity method
- Combined load bearing capacity of rigid piles embedded in a crossanisotropic clay deposit using 3D finite element lower bound
- Long-term decay of the water pressure in the osmotic tensiometer
- Predicting and validating the load-settlement behavior of large-scale geosynthetic-reinforced soil abutments using hybrid intelligent modeling
