Patterns of species diversity and its determinants in a temperate deciduous broad-leaved forest
Rui He,Mn Hu,Hng Shi,Qun Zhou,Xio Shu,Kerong Zhng,Qunf Zhng,Hishn Dng,*
a Key Laboratory of Aquatic Botany and Watershed Ecology,Wuhan Botanical Garden,Chinese Academy of Sciences,Wuhan,430074,China
b University of Chinese Academy of Sciences,Beijing,100049,China
Keywords:Alpha-diversity Beta-diversity Vertical strata Multivariate linear regression
A B S T R A C T Biodiversity conservation has long been a subject of extreme interest to community ecologists,with a particular focus on exploring the underlying causes of species diversity based on niche and neutral theories.This study aims to identify the potential determinants of species diversity in a deciduous broad-leaved forest in the transitional region from subtropical to temperate climate in China.We collected woody plant data and environmental variables in a fully mapped 25-ha permanent forest plot,partitioned the beta-diversity into local contributions(LCBD)and species contributions(SCBD),and then applied multivariate linear regression analysis to test the effects of biotic and abiotic factors on alpha-diversity,LCBD,and SCBD.We used variation partitioning in combination with environmental variables and spatial distance to determine the contribution of environment-related variations versus spatial variations.Our results showed that the indices of alpha-diversity(i.e.,species abundance and richness)were positively correlated with soil available phosphorus(P)and negatively with slope.For the betadiversity,environment and space together explained nearly half of the variations in community composition.Approximately 60% of the variation of LCBD in the understory layer,40% in the substory layer,and 29% in the canopy layer were jointly explained by topographic,soil and biological variables,with biotic factors playing a dominant role in determining the beta-diversity.Species abundance accounted for a large proportion of the variations in SCBD in each vertical stratum,and niche position(NP)was the ecological trait that significantly affected the variations in SCBD in the substory and canopy layers.Our findings help to gain better understanding on how species diversity in forest ecosystem responds to environmental conditions and how it is influenced by biotic factors and ecological traits of species.
1.Introduction
Understanding the mechanisms of species coexistence has long been of concern in community ecology(Wright,2002),which is central to strategies for forest biodiversity conservation(Pimm et al.,1995;Socolar et al.,2016).It has been increasingly recognized that neutral and niche theories(Whitfield,2002;Chave,2004),which propose different processes contributing to the maintenance of biodiversity,are essential for comprehending the patterns of species diversity at community level(Holyoak et al.,2006;Rominger et al.,2009).
According to the neutral theory,dispersal limitation emphasizing the importance of spatial distance is the main process that governs species composition,which implies that the closer geographic proximity plant communities have,the more common species they share(Hubbell et al.,1999;Adler et al.,2007;Chisholm and Lichstein,2009).Contrarily,the niche theory argues that community assembly is primarily controlled by the processes of environmental filtering or species interactions,implying that the more semblable habitats would harbor the more similar species(Grubb,1976;Gilbert et al.,2004).Over the past decades,a great variety of empirical studies have demonstrated that structures of community are shaped by both neutral and niche processes either independently or simultaneously(Wright,2002;Tuomisto et al.,2003;Cottenie,2005;Kraft et al.,2008;Qian,2009;De C′aceres et al.,2012;Wang et al.,2012).For instance,dispersal limitation generally exerts a significant influence on tropical forests,whereas environmental filtering plays a crucial role in temperate forests(Myers et al.,2013).Although most of the previous findings were drawn from sketchy data of factors(e.g.,coarse climatic data,including annual precipitation or average wind speed,etc.)influencing species diversity over large regional scales(Chust et al.,2006;Shi et al.,2021),a growing number of investigations have been now focusing on the potential effects of the specific environmental conditions and species’ecological traits associated with patterns of diversity(Chang et al.,2013;Qiao et al.,2015).
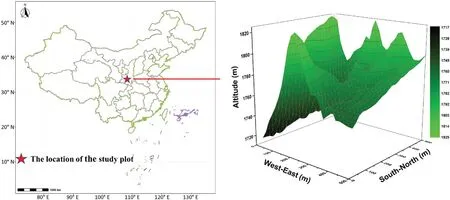
Fig.1.The location and topographic map of the studied 25-ha permanent forest plot in the Qinling Mountains,north-central China.
In recent years,with the establishments of large permanent forest plots,quantitative estimations of species diversity in woody plant communities have profoundly advanced the comprehension of the process creating and maintaining biodiversity(Whittaker,1960;Anderson et al.,2011)with a special focus of local environmental factors(John et al.,2007;Kraft et al.,2011;De C′aceres et al.,2012;Xing and He,2019).In particular,as a link between alpha(α)-diversity and gamma(γ)-diversity,beta(β)-diversity has been developed to describe the spatial organization of species composition within a given geographical area(Anderson et al.,2011)and has received widespread attention(L′opez-Martínez et al.,2013;Wang et al.,2013).Theoretically,each sampling unit among different species clusters and each species among various biological groups can both contribute to the variance of species compositions(i.e.,beta-diversity)(Legendre and De C′aceres,2013).In other words,the uniqueness of sampling units and the relative importance of each species in influencing the patterns of beta-diversity can be quantified.
However,studies conducted to explore the patterns of beta-diversity in relation to the contributions of sampling units and species have mainly focused on the horizontal structure of forest community,neglecting the variations in the vertical structure.The vertical stratification of forests is the essentially fundamental structural characteristics of woody plant communities,which can provide specific ecological conditions for the survival of various species,and can reflect the adaptation process of woody plants in different vertical strata to the heterogeneity of the community environment(Mori et al.,2013).Hence,it is of vital importance to probe into how complex the vertical structure in a stable forest community affects species composition,especially when linked to the partitioning of beta-diversity.
The Qinling Mountains,which run east-west and serve as the geographical boundary between the northern and southern China as well as the climatic demarcation line between the subtropical and warm temperate zones in China,have been of ecological significance in biodiversity research.Considering that at the level of vertical stratification in a forest community,there have been scarce direct assessments of multiple potential factors on the contribution of sampling unit to betadiversity or direct examinations of various latent causes of species contribution to beta-diversity.Thus,the aim of this study was to identify the potential determinants of species diversity in the temperate deciduous broad-leaved forest.We collected data of woody plants and habitatrelevant variables from a fully mapped 25-ha permanent forest plot in the Qinling Mountains of north-central China and calculated alpha-diversity and beta-diversity,and partitioned the beta-diversity into local contributions(LCBD)and species contributions(SCBD).We then examined alpha-diversity,LCBD,and SCBD by regressing on the related explanatory variables.
The specific objectives of our study were to address the following issues:(a)what was the alpha-diversity pattern of the temperate deciduous broad-leaved forest?(b)how did the pattern of beta-diversity vary across different forest vertical strata?(c)why did the sampling unit and species contribute to the beta-diversity in the forest community?and(d)what was the relationship of environmental variables versus spatial variables to the beta-diversity at the scale of the entire forest plot and the forest vertical stratum?We hypothesized that the differences of environmental conditions and intra-community competitions,which can determine the processes of colonization and local extinction(Pitman et al.,2001;Boulangeat et al.,2012),might be the important drivers of LCBD;while the ecological and biological traits,which can indicate the environmental fitness and competitive ability of species(Geertsema and Sprangers,2002),were the potentially important drivers of SCBD.Additionally,we assumed that the species diversity of the forest in the permanent plot was governed by both neutral and niche processes.Under the exploration of the potential influencing factors of species diversity from the perspective of vertical stratification of forest community,our study may provide novelty for the protection of forest biodiversity and the revelation of the mechanism of species coexistence.
2.Materials and methods
2.1.Field measurements and data collection
The study area is located in the Qinling Mountains,a temperatesubtropical climate transition zone in China.Average annual temperature in the study area is about 13°C and average annual precipitation ranges from 950 to 1,200 mm.The soil in the study area is typically identified as brown forest soil with depth ranging from 20 to 100 cm.The woody plants in the forest mainly consist of Rosaceae,Fagaceae,Cornaceae,Symplocaceae and Betulaceae.Major tree species include deciduous broad-leaved species such asSymplocos paniculata(Thunb.)Miq.,
Dendrobenthamia japonica(DC.)Fang,Quercus alienaBlume,Meliosma cuneifoliaFranch.andQuercus spinosaDavid ex Franch.
In the summer of 2014,a 25-ha(500 m×500 m;33°41′24′′N,107°49′12′′E)permanent forest plot was established in the deciduous broad-leaved forest in the Qinling Mountains(Fig.1).The range ofelevation within the 25-ha plot varies from 1,717.1 to 1,824.0 m a.s.l.with a maximum elevation difference of 106.9 m a.s.l.Following the construction standard of CTFS(Centre for Tropical Forest Science)(Condit,1998),the entire forest plot was divided into 625 subplots(20 m×20 m),and each subplot was further subdivided into 16 quadrats of 5 m×5 m.Within each quadrat,all woody plant individuals with a diameter at breast height(DBH)≥1 cm were measured,tagged,geo-referenced and identified.
A total number of 73,932 woody individuals belonging to 38 families,72 genera,and 125 species were recorded and analyzed in this study.Using the classification method suggested by Barruffol et al.(2013)and He et al.(2022),forest vertical stratum was divided into sub-layers with 10-cm DBH intervals to ensure the presence of at least one tree species in each subplot.Thus,the woody plants were categorized into three forest vertical strata:understory layer(0–10 cm in DBH),substory layer(10–20 cm in DBH),and canopy layer(>20 cm in DBH)(Table 1,Fig.S1,Fig.S2).
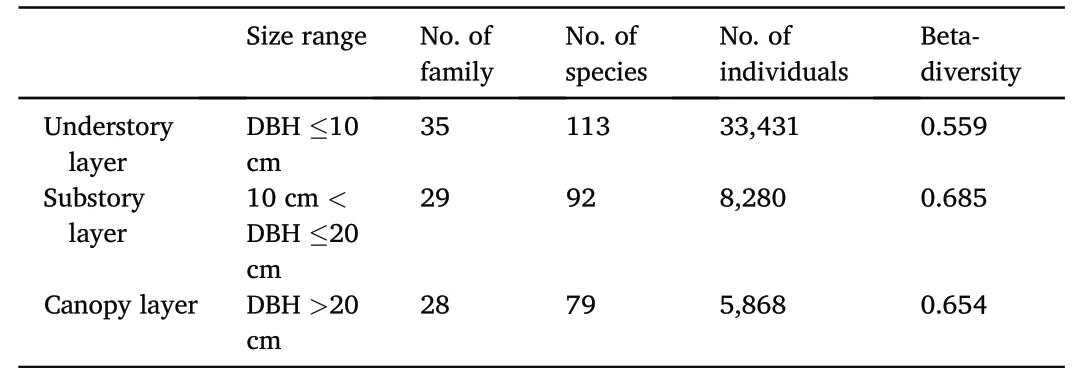
Table 1Forest strata division and statistical results in the deciduous broad-leaved forest in the Qinling Mountains of north-central China.
Additionally,to assess the influence of environmental factors on species diversity across the entire permanent forest plot,four traits(including aspect,convexity,elevation and slope)were calculated for each subplot as indicators of topographic variables(Harms et al.,2001).Meanwhile,a total of six soil characteristics(including pH value,water content,bulk density and available carbon(C),nitrogen(N)and phosphorus(P))for each subplot(20 m×20 m)were measured.Indicators of soil properties for each subplot were obtained by interpolation using the ordinary Kriging method based on a semi-variance function(Cressie,1990;Diggle et al.,1998),which was carried out in R(version 4.1.2)by applying the‘gstat’package(Pebesma,2004).
2.2.Measures of alpha-diversity
The alpha-diversity of woody plant species in each subplot across the permanent forest plot was calculated using six indices:species abundance,species richness(S),Shannon entropy(H),the exponential of Shannon entropy exp(H),Gini-Simpson index(GS),and Pielou evenness index(JSW)(Pielou,1975;Ma and Liu,1994;Jost,2006,2007,2010;Jost et al.,2010).Species abundance is defined as the number of all living individuals observed in each subplot,and species richness(S)represents the total number of species observed in each subplot.
Shannon entropy(H),the exponential of Shannon entropy exp(H),Gini-Simpson index(GS)and Pielou evenness index(JSW)were calculated as follows:

whereNirepresents the abundance of speciesi,andN0is the sum of the individual number of all species.


Calculations of alpha-diversity was carried out in R(version 4.1.2)using the“diversity”function(Hurlbert,1971)which is available in the‘vegan’package(Oksanen,2013).
2.3.Measures of beta-diversity
We firstly obtained ann×p(subplot-by-species)data tableY(Y=[yij])by counting the number of living individuals of speciesp(column vectorsy1,y2,∙∙∙,yp)observed innsubplots(row vectorsx1,x2,∙∙∙,xn)in the permanent plot.Indicesi,j,andyijrepresent subplot,species,and abundance values of speciesjin subplotiinY,respectively.Considering that using raw species abundances directly is not an appropriate approach for determining beta-diversity(Legendre and De C′aceres,2013),we transformed the community composition matrixYby using the Hellinger transformation(Legendre and Gallagher,2001)into a corresponding matrixYHel.The main beta-diversity statistic(BDTotal)was calculated as the total variance of the Hellinger-transformed community composition matrixYHel(Var(YHel))(Legendre,2005):

where SSTotalrefers to the total sum of the squared deviations from the column means of the wholeYHelmatrix,and BDTotalrepresents the unbiased form of the total variance.
Beta-diversity was further partitioned into Local Contribution to Beta Diversity(LCBD)and Species Contribution to Beta Diversity(SCBD)(Legendre and De C′aceres,2013)as follows:

where SSirepresents the sum of squares corresponding to theithsubplot(i.e.,the contribution of subplotito the overall beta-diversity),and SSjrepresents the sum of squares corresponding to thejthspecies(i.e.,the contribution of speciesjto the overall beta-diversity).LCBDiis the reflection of the degree of the compositional uniqueness of the subplots which can be compared with each other,and SCBDjis also a comparative indicator that reflects the degree of variation of speciesjin the 25-ha forest plot.
Computing of beta-diversity was carried out in R(version 4.1.2)using the“beta.div”function in the‘adespatial’package(Legendre and De C′aceres,2013;Dray et al.,2017).
2.4.Sets of explanatory variables
Topographic variables(i.e.,aspect,convexity,elevation and slope)and soil features(i.e.,pH,water content,bulk density,C,N and P)were chosen for explaining the variability of alpha-diversity among the 625 subplots.In addition,a wide range of biological factors were considered to facilitate better interpretation of beta-diversity.
To explain the variations of LCBD,a range of biological-related variables such as the indices of alpha-diversity(including species richness,the exponential of Shannon entropy,and Gini-Simpson index)and the indicators of DBH(including maximum value of DBH(MaxDBH),mean value of DBH(MeanDBH),and coefficient of variation of DBH(VarDBH))of all the living individuals within each subplot were selected.
To account for the variations of SCBD,species abundance,niche characteristics(i.e.,niche position and niche breadth)and mean value of DBH(MeanDBH)of each species in each forest vertical stratum were chosen as explanatory variables.Outlying mean index(OMI)(Dol′edec et al.,2000)was applied to measure niche position(NP)and niche breadth(NB),which was carried out in R(version 4.1.2)by using the“niche”function in‘ade4’package(Dol′edec et al.,2000;Dray and Dufour,2007).

Fig.2.The distribution of the alpha-diversity among the 625 subplots(20 m×20 m)within the 25-ha forest plot in the Qinling Mountains.X-and Y-axes are the length and width of the plot,respectively(unit:m).
Distance-based Moran's eigenvectors maps(dbMEM),which was derived from spectral decomposition of the spatial relationships among subplots,was used to represent spatial structure(Legendre et al.,2009).Eigenfunctions were computed across the 625 subplots to describe all spatial scales accommodated by the sampling design and the forward selection method was used to identify significant dbMEM eigenfunctions from all eigenvectors.The dbMEMs eigenvectors with positive Moran indices model positive spatial correlation.For parsimony,only those positive eigenvectors were selected to serve as spatial variables(Borcard and Legendre,2002).
2.5.Statistical analysis
Multivariate linear regression(MLR)analysis was used to examine the relationships between potential explanatory variables(i.e.,topographic variables,soil features,niche traits,and biological factors)and response variables(i.e.,alpha-diversity,LCBD,and SCBD)(Fox,2015).To avoid flawed selections of prediction factors in MLR models caused by multicollinearity(Dormann et al.,2013),variance inflation factors(VIF)were applied to quantify the multicollinearity among candidate predictors in the dataset prior to including all of them into the subsequent regression analysis.A threshold of 4 was used to ensure that there was no collinearity among the remaining explanatory variables after excluding the variables with VIF greater than 10(Myers,1986;Gray and Fox,1997;Chatterjee et al.,2000).Multi-model selection based on minimizing corrected Akaike's information criterion(AICc)(Burnham and Anderson,2002)was applied to determine the optimal set of predictors of multifunctionality.The procedure of model selection was carried out in R(version 4.1.2)by using the“Dredge”function,which is available in the‘MuMIn’package(Barto′n,2013).All selected models(ΔAICc<2)were averaged based on the model weights to estimate parameters and associatedPvalues by using the“model.Avg”function in the‘MuMIn’package(Barto′n,2013).Prior to analysis,all explanatory variables and response variables were standardized using theZ-score to interpret parameter estimates on a comparable scale.
Variance partitioning(Borcard et al.,1992)was performed using canonical redundancy analysis(RDA)to decompose the variations in community composition of the permanent forest plot into fractions explained by environmental(including topographic and soil)and spatial explanatory variables(Borcard and Legendre,2002).We used the Hellinger-transformed community composition matrixYHelas the response variables.We adjusted the proportion of variations explained(R2values)as the unadjustedR2values are biased(Jones et al.,2008),and recorded the adjusted values(Adj.R2)in RDA analyses by either the significant spatial(dbMEM)or the significant environmental variables,or both simultaneously.Following this method,we partitioned the variations of beta-diversity into four components:pure environmental variation fitted by environmental variables independent of spatial variables(fraction[a]),spatially-structured environmental variation fitted by both environmental and spatial variables(fraction[b]),pure spatial variation fitted by spatial variables only(fraction[c]),and unexplained variation(fraction[d])(Borcard et al.,1992).We incorporated fraction[a]and[b](i.e.,fraction[a+b])as the variation explained by environmental variables(signifying niche processes)and interpreted fraction[c]as the variation explained by spatial variables(signifying neutral processes)(Legendre et al.,2009).We reported Adj.R2values throughout to represent the explanatory power of each component and tested the significance of the pure spatial and pure environmental fractions by the means of 999 permutations under the reduced model(Jones et al.,2008).The packages‘adespatial’and‘vegan’in R(version 4.1.2)were used to conduct the dbMEM,forward selection,RDA and variation partitioning(Dray et al.,2006).

Fig.3.Pearson correlation analysis between indices of alpha-diversity and environmental variables within each subplot;P values of each correlation coefficient are given as:*P<0.05;**P<0.01.
3.Results
3.1.Variations of alpha-diversity and its determinants
Across the permanent forest plot,the spatial distributions of the representative indices values of alpha-diversity for each subplot were mapped(Fig.2).The observed species abundance of each subplot ranged greatly from 14 to 199 with a high coefficient of variation(CV)of about 40.50%(Fig.2),showing a relatively strong correlation with slope(R2=0.35,P<0.01),pH(R2=0.33,P<0.01),and soil available phosphorus(P)(R2=0.32,P<0.01)(Fig.3).The range of species richness of each subplot varied between 5 and 37 with a relatively low value of CV of about 25.80%(Fig.2),which was also significantly associated with P(R2=0.32,P<0.01)and slope(R2=0.30,P<0.01)(Fig.3).The range of the exponential of Shannon entropy of each subplot varying from 5.77 to 101.55(Fig.2)was positively correlated with P(R2=0.29,P<0.01)(Fig.3),while the variation of Pielou evenness index of each subplot ranging from 0.56 to 0.97(Fig.2)had a negative correlation with elevation(R2=0.20,P<0.01)(Fig.3).Moreover,values of CV of the exponential of Shannon entropy and Pielou evenness index were relatively high at about 39.71%,and were relatively low at 6.71%,respectively.
Further analysis by multivariate linear regression(MLR)was used to determine the dominant factors influencing the variations of alphadiversity among subplots across the entire 25-ha plot.The regression results showed that environmental variables(i.e.,topography variables and soil features)collectively exhibited relatively high explanatory power for species abundance(Adj.R2=0.29)and for species richness(Adj.R2=0.16),compared with the relatively low power of interpretation for the exponential of Shannon entropy(Adj.R2=0.09)and for Pielou evenness index(Adj.R2=0.05)(Fig.4).In terms of variations in species abundance,the proportional contributions of soil features and topographic variables to the explanatory rates were essentially comparable(59.73% versus 40.27%),and a similar explanatory pattern was also observed with regard to species richness variation(60.12% versus 39.88%).Besides,the results indicated that P was the most influential environmental factor on these two indices of alpha-diversity(P<0.001)(Fig.4).
3.2.Variations of beta-diversity and its determinants
Our results showed that there was greater variation of the species composition in the substory layer than in the other two forest layers of the deciduous broad-leaved temperate forest,corresponding to the observed higher beta-diversity value in the substory layer(0.685)when compared with that in the canopy layer(0.654)and in the understory layer(0.559)(Table 1).The lowest beta-diversity value for the understory layer reflected the least compositional dissimilarities between its sampling subplots.
Highly predictable patterns provided by the local and species contributions to beta-diversity had also been found in our results.Local contributions to beta-diversity(i.e.,LCBDund,LCBDsub,and LCBDcan)varied in the three forest vertical strata with the value of 7.05×10⁻⁴to 3.65×10⁻³in the understory layer,8.03×10-4to 2.88×10⁻³in the substory layer,and 7.76×10⁻⁴to 3.15×10⁻³in the canopy layer(Fig.S3).The results of MLR analysis showed that almost 60% of the variation of LCBDundcould be explained(Adj.R2=0.60)(Fig.5).Two biological factors had significant effects on LCBDund,i.e.,species richness(P<0.001)and coefficient of variation in DBH(VarDBH)(P<0.001)(Table 2,Fig.5).LCBDundwas also significantly correlated with two topographic variables,i.e.,aspect(P<0.001)and elevation(P<0.001).Soil available carbon(C)and phosphorus(P)as well as water content had significant effects on LCBDund(P<0.001 for C,P<0.01 for water content,andP<0.05 for P).The results of the MLR analysis also demonstrated that approximately 40% of the variation of LCBDsub(Adj.R2=0.40)could be explained,while only 29% of the variation of LCBDcan(Adj.R2=0.29)could be interpreted(Fig.5).MaxDBH,Gini-Simpson index,species richness,MeanDBH,and VarDBH were the biological factors which significantly affected LCBDsub(P<0.001 for both MaxDBH and Gini-Simpson index,P<0.01 for both species richness and MeanDBH,andP<0.05 for VarDBH),while only the biological factors of species richness and Gini-Simpson index had significant influence on LCBDcan(P<0.001 for both species richness and Gini-Simpson index)(Table 2,Fig.5).In addition,all of the topographic variables were significantly correlated with LCBDsuband LCBDcan(P<0.001 for aspect,convexity and slope,andP<0.05 for elevation in the substory layer;P<0.001 for both aspect and convexity,P<0.01 for elevation,andP<0.05 for slope in the canopy layer).Among a variety of soil features,pH and C showed positive relationships with the variation of LCBDsub(P<0.01 for C andP<0.05 for pH),whereas the increasing P significantly decreased the variation of LCBDsub(P<0.001).Soil pH also had a strongly positive effect on the variation of LCBDcan(P<0.001)(Table 2,Fig.5).

Fig.4.Effects of environmental factors on the indices of alpha-diversity.Bar charts represent the ratio between the standardized coefficient of a given predictor and the sum of absolute values of coefficients of all predictors in the multivariate liner regression models(expressed in %).Pie charts represent the contributions of topographic variables and soil features to model R2.The adjusted(adj.)R2 of the averaged model is showed and the P values of each predictor are given as:*P<0.05;**P<0.01;***P<0.001.

Fig.5.Average parameter estimates(standardized regression coefficients)of model predictors associated 95% confidence intervals and relative importance of biological factors,soil features,and topographic variables(expressed as the percentage of explained variance).The adjusted(adj.)R2 of the averaged model is showed and the P values of each predictor are given as:*P<0.05;**P<0.01;***P<0.001.
The results of beta-diversity partitioning showed that SCBD values(i.e.,SCBDund,SCBDsub,and SCBDcan)of all species varied between 2.84×10⁻⁵and 6.83×10⁻²in the understory layer(Fig.S4),between 7.79×10⁻⁵and 8.14×10⁻²in the substory layer(Fig.S5),and between 1.00×10⁻⁴and 1.40×10⁻¹in the canopy layer(Fig.S6).The results of the MLR analysis showed that almost 83% of the variation of SCBDund(Adj.R2=0.83),94% of the variation of SCBDsub(Adj.R2=0.94),and 77% of the variation of SCBDcan(Adj.R2=0.77)could be interpreted(Table 3).Additionally,species abundance contributed the vast majority of interpretation of the variations of SCBD among the explanatory variables for each vertical stratum of the forest(P<0.001).The variations of SCBD showed a positive response to the increases in abundance,regardless of the forest vertical strata.Niche position(NP)also had a strongly positive effect on the variations of SCBDsub(P<0.01)and SCBDcan(P<0.01).However,the correlation between niche breadth(NB)and SCBD and the correlation between the mean value of DBH(MeanDBH)and SCBD were not significant in the three vertical strata(Table 3).
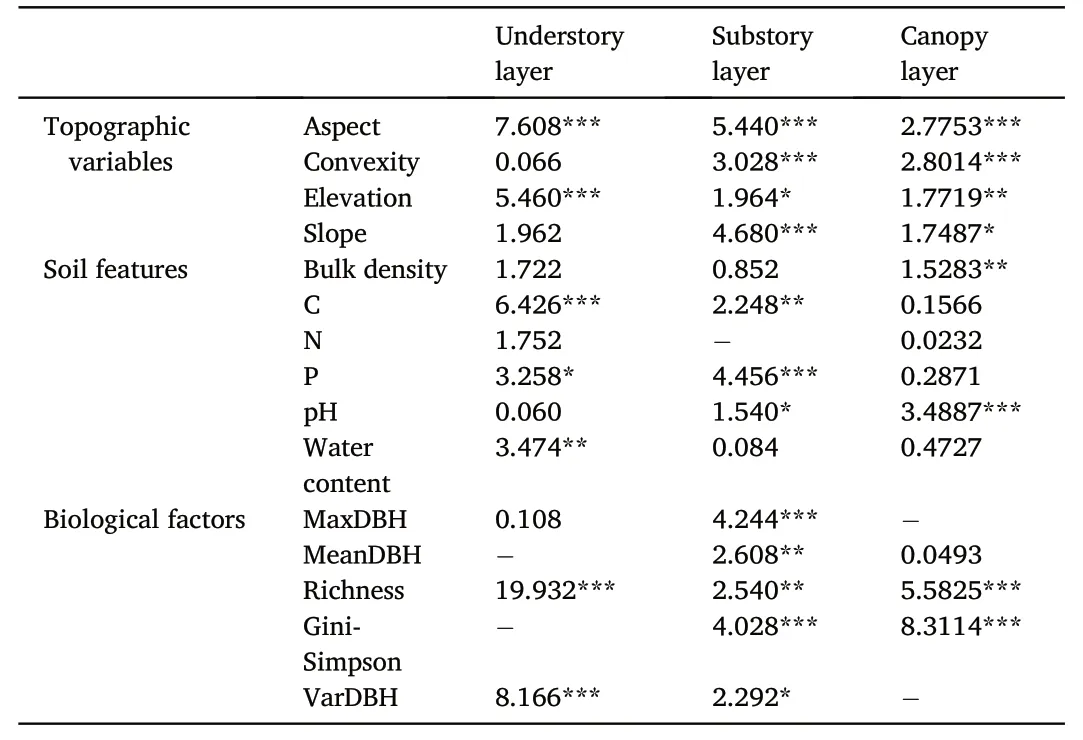
Table 2Multivariate liner regression(MLR)results of the contribution of single predictor variable to the explanation of LCBD(%)in the three vertical strata of the deciduous broad-leaved temperate forest.
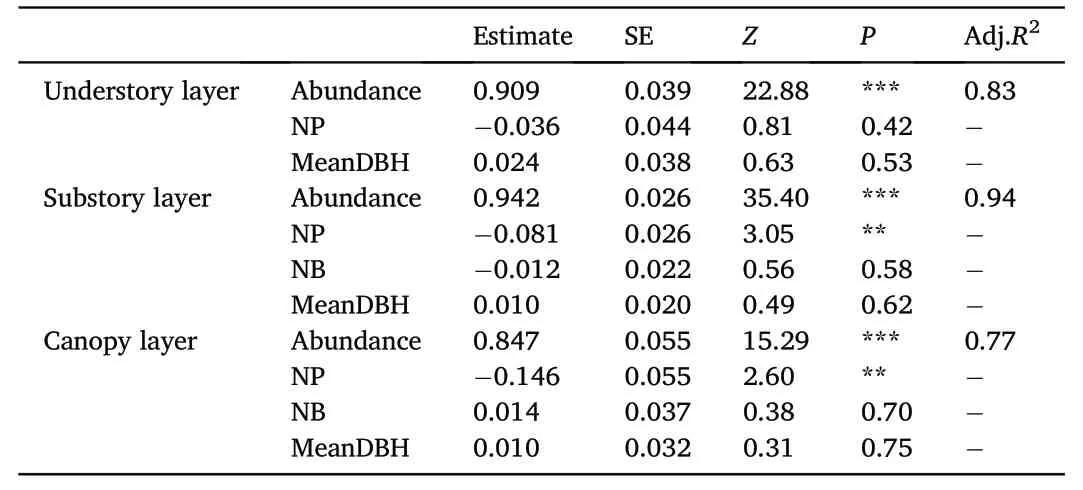
Table 3Results of regression analysis of SCBD in the three vertical strata of the deciduous broad-leaved temperate forest.
3.3.Variation partitioning of community composition
The variation partitioning results in the entire permanent plot showed that both environmental and spatial variables had a significant influence on the variations of beta-diversity.For all individuals,environmental(including topographic and soil)and spatial variables together explained 46%of the variation in community composition of the permanent forest plot(Fig.6).Topographic and soil variables together explained 15%and the pure spatial component explained 31%of the variation in community composition,respectively.However,environmental variables alone explained little of the variation in community composition(i.e.,most was spatially structured;Figs.6 and 7).The rest results of variation partitioning for the individuals in the different forest layers also showed the substantial weakness of explanatory strength of the environmental variables alone(Figs.6 and 7).Specifically,individuals in the understory layer had the highest total variation explained by spatial and environmental variables together(45% vs.30% for substory layer and 27% for canopy layer)and were more related to environmental variables(14%vs.11% for substory layer and 9% for canopy layer).Among the three categories,pure spatial effects explained more variations than environment for the individuals in the understory layer(30%vs.14%),substory layer(18%vs.11%)and canopy layer(17%vs.9%),which was consistent with the results for all the individuals(31% vs.15%)(Fig.6).For further comparison,we calculated the relative percentage of total explained variations of environment and space for different forest layers,and the results showed that the relative importance of environmental effect was the highest for the individuals in the substory layer(37.9%),followed by in the canopy layer(34.6%)and in the understory layer(31.8%)(Fig.7).
4.Discussion
The primary focus of our study was to reveal the patterns of alphaand beta-diversity of the deciduous broad-leaved forest community and to partition the beta-diversity into local contributions(LCBD)and species contributions(SCBD)so as to determine the underlying causes of the variations of species diversity in the temperate forest.In addition,an attempt was also made to compare separately how the two underlying ecological processes,usually referred to as environmental filtering and dispersal limitation,play the influential role in the variations of community composition of various forest layers in the temperate deciduous broad-leaved forest.
With regard to alpha-diversity,our results showed that species abundance and the exponential of Shannon entropy within each 20 m×20 m subplot varied greatly across the permanent forest plot,as was evidenced by the relatively high coefficients of variation(CV)at about 40.50% and 39.71%,respectively(Fig.2).Among the multiple environmental factors,soil available phosphorus(P)had the highest interpretation power for the variations of species abundance and richness(P<0.001;Fig.4),implying that tree species in the deciduous broad-leaved forest were sensitive to the change of soil phosphorus availability and it is consistent with previous study by Laurance et al.(2010).However,several studies have indicated that low soil phosphorus availability was associated with high species diversity(Huston,1980;McCrea et al.,2001;Dorrough et al.,2006;Plue and Baeten,2021),which was contrary to our finding that P exhibited a significant positive correlation with species abundance and richness.That might be attributable to the fact that the survival of woody plants in our studied forest is generally phosphorus-limited(Campo et al.,1998;Grimm et al.,2003),being consistent with previous study which reported that species richness in plant community under low soil fertility was primarily driven by the competition for limited nutrient resources(Tilman et al.,1982).Moreover,our results were also in line with the previous study(Geertsema and Sprangers,2002),showing that species abundance and richness had a significant negative correlation with slope(P<0.001;Fig.4).It indicated that woody plant species in the deciduous broad-leaved forest had a tendency to be more abundant on gentle slope area.
Previous studies have reported that the processes of colonization and extinction in forest community are primarily determined by environmental heterogeneity and species competition(Pitman et al.,2001;Boulangeat et al.,2012).Therefore,the combination of soil features and topography variables is the essential representation of environmental heterogeneity,while the biological factors in our studied forest can represent the interspecific competition within the community.LCBD values in the studied forest held the information on the degree of the uniqueness of each sampling subplot,which varied among vertical strata of the forest(Fig.S3).The best-explained variation of LCBD was found in the understory layer,where nearly 60% of the variation was explained jointly by biological factors,soil features and topographic variables.In the substory and canopy layer,however,these variables explained only 40%and 29%variations of LCBD,respectively(Fig.5).Thus,it could be considered that the distributions of understory species were more dependent on the niche process(i.e.,the process of environmental filtering and species interactions)which is consistent with previous study(Duque et al.,2002).Several studies have demonstrated the strong relationship between species richness and LCBD value(Silva and Hern′andez,2014;Heino and Gr¨onroos,2016),which is consistent with our study showing that the species richness of biological factors had a significant negative effect on LCBD in each vertical stratum in the studied forest(P<0.001;Table 2,Fig.5).
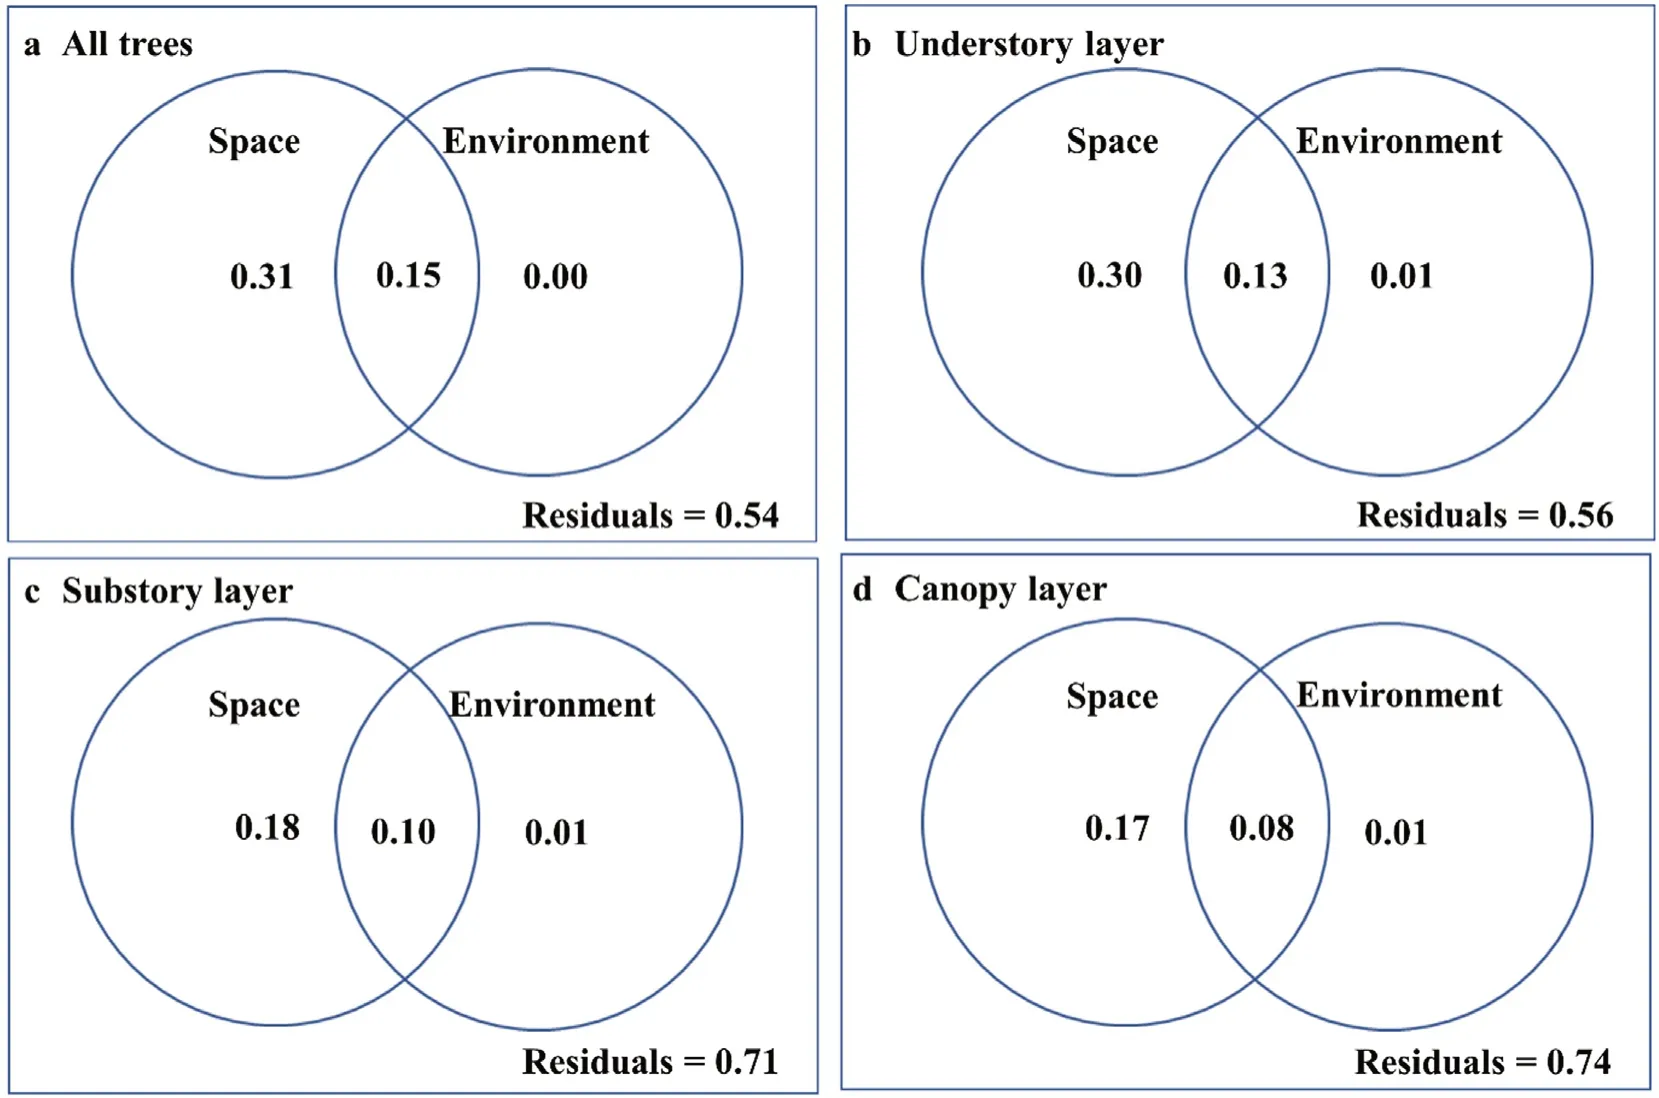
Fig.6.Variation partitioning of community composition using environmental and spatial data.The numbers in the circles within the box indicate the fraction of explained variations attributable to environmental and spatial data.All of the testable model fractions(i.e.the unique contributions)were significant,with P=0.001 after 999 permutations.
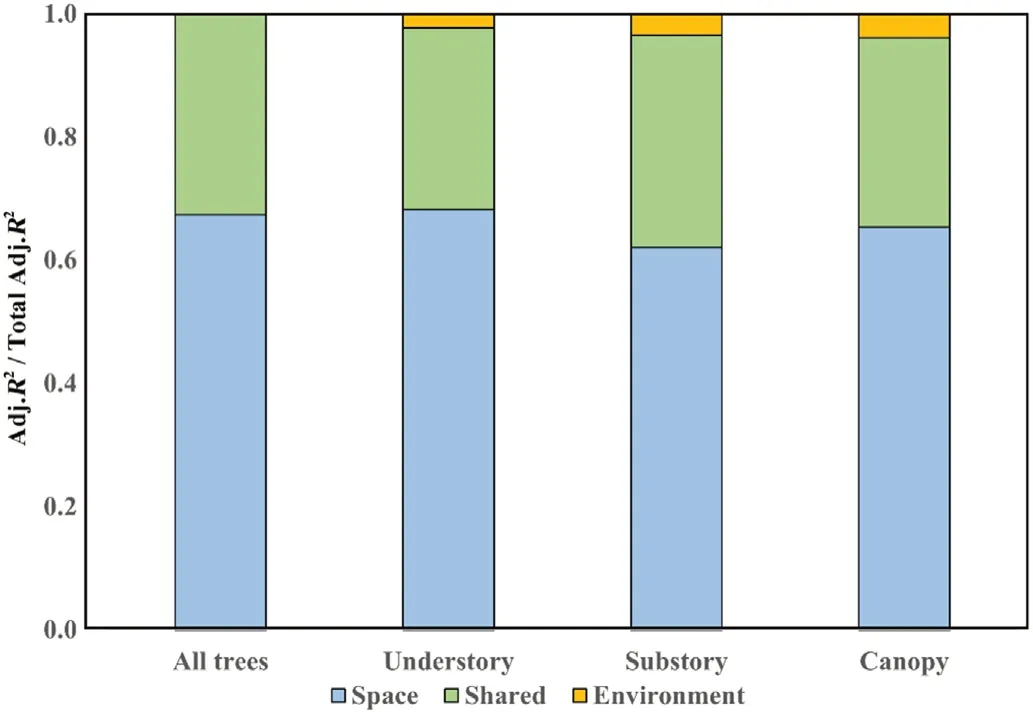
Fig.7.Variation partitioning of community composition into the relative fractions of variations explained by environment and space in relation to the total variations explained for all individuals and different forest layers.The reported fractions are Adj.R2.The orange bars(Environment)plus the green bars(Shared)indicate environmental effects(fraction[a+b]),and the blue bars(Space)indicate spatial effects(fraction[c]).(For interpretation of the references to colour in this figure legend,the reader is referred to the Web version of this article.)
In this study,a subplot with lower species richness was considered as an indication of strong competition due to the exclusion of noncompetitive species,thus increasing the uniqueness of the subplot.DBH values of all the living individuals can also represent the level of species community competition(D˘aNescu et al.,2016).Specifically,the coefficient of variation of DBH(VarDBH)is one of the most important structural predictors of species diversity,which can increase the complexity of structure through growth circulation and in turn drive variations in spatial resource availability to influence species diversity(Hakkenberg et al.,2016).Our results showed that VarDBH had significant effects on the variations of LCBD in the understory layer and in the substory layer(Table 2,Fig.5),and that topographic variables captured significant positive variations of LCBD,implying that subplots with complex environmental conditions such as high elevation or steep slope would increase the uniqueness of the species composition.
The relative importance of a species in influencing the overall betadiversity can be indicated by its SCBD value(Legendre and De C′aceres,2013),which allows us to identify which species show the greatest variation across the forest community.In our study,we found generally higher species contributions to beta-diversity in the canopy layer than in the other two layers,suggesting that tree species in the canopy layer exhibited a larger variation across the 25-ha forest plot.Additionally,we found that high species abundance was associated with high SCBD values regardless of forest vertical strata in our study(P<0.001;Table 3),which is in line with previous studies(Silva and Hern′andez,2014;Heino and Gr¨onroos,2016)displaying that species with high abundance contribute great not only to beta-diversity but also to variations across sampling subplots.Ecological traits are the indication of the competitive capacity and environmental suitability of species and thereby influence species distribution(Geertsema and Sprangers,2002).Typically,niche position for a particular tree species in a forest community refers to the distance between the average habitat conditions used by the tree species and the average habitat conditions of the sampling area,while niche breadth of a specific tree species measures the amplitude in distributions of the tree species across the topographic gradients of the entire study area(Dol′edec et al.,2000).In this study,niche position(NP)significantly affected the variations of SCBD in the substory layer and in the canopy layer,whereas niche breadth(NB)had no effects on the variations of SCBD in the forest vertical strata(Table 3).Therefore,significantly negative association of the variations of SCBD with niche position implied that species with marginal niche position contributed less to the variation of species composition.It is probably due to the low abundance of the marginal species with a high degree of environmental preference,which limited their variations in distribution among sampling subplots(Tan et al.,2019).Furthermore,although no clear effects of niche breadth on beta-diversity were identified in our study,species with high niche breadth are able to widely distribute across different environmental conditions and are usually considered to contribute more to beta-diversity(Heino and Gr¨onroos,2016).In addition,the effect of the mean value of DBH(MeanDBH)of each species was constantly weak at each forest vertical stratum(Table 3).This suggests that biological traits considered in our analysis were less correlated with the variations of SCBD than niche position and species abundance.However,it cannot be arbitrarily assumed that there is no relationship between the biological traits and SCBD,as our study did not take other biological factors(such as tree height and crown size)into account due to the limitations of the survey data.Therefore,further research is needed to assess the effects of other potential biological characteristics of species on the variations of SCBD.
By partitioning beta-diversity into different components,we compared separately how the spatial and environmental factors play the influential role in the variations of beta-diversity in the 25-ha permanent forest plot.As shown in Figs.6 and 7,the higher effect of spatial variables than environmental variables in each of the forest layers indicated that the strong explanatory power of spatial effect remained highly consistent among different forest layers,with species aggregation being less filtered by soil and topographic properties(Legendre et al.,2009).Environmental filtering is associated with species-specific resource demands,which determines the survival and development of species in a particular habitat;while dispersal limitation is independent of environmental variables and reflects the autocorrelation of spatial structure induced by pure spatial effects(Tan et al.,2017).Our results indicated that habitat heterogeneity captured less of the spatial variation in species composition for all species in the entire permanent plot compared to dispersal limitation(Figs.6 and 7).Meanwhile,none of the forest layers were able to well capture species specialization to environment,as less than 15%of the variations were explained by environmental variables in each layer(Figs.6 and 7).From the results showing that spatial variables had a higher proportion of explanatory strength,we may assume that there is a high proportion of dispersal-limited species(e.g.,D.japonica,Q.aliena,andCorylus heterophyllaFisch.ex Trautv.)carrying heavy seeds that propagate by gravity in our 25-ha plot.In addition,species that carry light seeds in our permanent plot(e.g.,Acer monoMaxim.,Fraxinus chinensisRoxb.,andPinus armandiiFranch.)may be prevented from regenerating further away due to the frequently severe shading effect of the dense forest(Tan et al.,2017).Furthermore,it is necessary to note that the undetermined variation was about 54%in our study,illustrating that the effects of local stochastic processes(Legendre et al.,2009;Qiao et al.,2015)and unmeasured environmental and spatial variables are also likely to play important roles in the temperate deciduous broad-leaved forest(Borcard et al.,2004).
CRediT authorship contribution statement
Rui He:Conceptualization,Data curation,Formal analysis,Methodology,Visualization,Writing-original draft.Man Hu:Writing-review&editing.Hang Shi:Data curation,Investigation.Quan Zhou:Data curation,Investigation.Xiao Shu:Investigation.Kerong Zhang:Investigation.Quanfa Zhang:Funding acquisition,Project administration,Supervision.Haishan Dang:Funding acquisition,Investigation,Project administration,Supervision,Writing-review& editing.
Declaration of competing interest
The authors declare that they have no known competing financial interests or personal relationships that could have appeared to influence the work reported in this paper.
Acknowledgements
This work was supported by the National Natural Science Foundation of China(Nos.31971491,31770517)and the Meituan Qingshan Special Commonweal Fund of China Environmental Protection Foundation(CEPFQS202169-20).We would like to thank Mr.Zhenhai Wu and Mr.Gaodi Dang for species identification.We thank many field workers for their contributions to the establishment and census of the 25-ha permanent forest plot.We thank the Foping National Nature Reserve for logistical support during the field work.We would also like to thank the two anonymous reviewers for their constructive comments on an early version of the manuscript.
Appendix A.Supplementary data
Supplementary data to this article can be found online at https://doi.i.org/10.1016/j.fecs.2022.100062.
- Forest Ecosystems的其它文章
- Multiple forest structural elements are needed to promote beetle biomass,diversity and abundance
- Diversity of click beetles in managed nonnative coniferous and native beech stands:Consequences of changes in the structural and species composition of tree stands in Central Europe
- Environmental and canopy conditions regulate the forest floor evapotranspiration of larch plantations
- Allometry-based estimation of forest aboveground biomass combining LiDAR canopy height attributes and optical spectral indexes
- Examining approaches for modeling individual tree growth response to thinning in Norway spruce
- Influence of soil and elevation on roadside cryptogam diversity in the tropical Andes

