Isolating QTL controlling sugarcane leaf blight resistance using a two-way pseudo-testcross strategy
Zhouto Wng, Guilong Lu, Qiin Wu, Aitin Li, Youxiong Que, Liping Xu,
a Key Laboratory of Sugarcane Biology and Genetic Breeding, Ministry of Agriculture and Rural Affairs, National Engineering Research Center for Sugarcane, Fujian Agriculture and Forestry University, Fuzhou 350002, Fujian, China
b Dehong Sugarcane Science Institute, Dehong 678400, Yunnan, China
Keywords:Sugarcane Genetic map Leaf blight QTL mapping Causal gene
A B S T R A C T Sugarcane leaf blight (SLB), caused by Stagonospora tainanensis, is one of the most harmful fungal diseases, threatening the sugarcane industry and causing high losses of cane yield and sugar in susceptible cultivars. Using a two-way pseudo-testcross mapping strategy in combination with array genotyping,two high-density genetic maps were constructed for sugarcane cultivars YT93-159 and ROC22 with mean densities of respectively 3.0 and 3.5 cM per marker, and covering respectively 4485 and 2720 cM of genetic distance.The maps showed highly conserved colinearity with the genome of the ancestral species Saccharum officinarum, supporting the reliability of the linkage configurations of the maps. Quantitative trait loci(QTL)analysis of SLB resistance revealed six QTL(qSLB-1-qSLB-6).The major QTL qSLB-1 explaining 16.4%of phenotypic variance was assigned as the main QTL,and the total percentages of phenotypic variance explained in YT93-159 and ROC22 were 37.9%and 17.6%,respectively.Nine transcription factor and seven pathogen receptor genes lying in the qSLB-1 interval were highly expressed and are proposed as candidate causal genes for SLB resistance.
1. Introduction
Sugarcane(Saccharumspp.hybrids,2n=100-130)accounts for 80%of table sugar and 60%of bioethanol production worldwide[1].The stability of the sugarcane industry in the face of disease and adversity depends largely on the intrinsic traits of cultivars. In China,about one million seedlings per year are generated for selection in sugarcane breeding programs. The huge number of seedlings makes agronomic trait assessment difficult unless DNA marker-assisted selection (MAS) is adopted [2]. Most agronomic traits are quantitatively inherited (making them quantitative traits)and are controlled by several genes or quantitative trait loci(QTL),each with a relatively minor effect[3].Continuous variation of quantitative traits results mainly from polygene-byenvironment interaction. Identification of agronomically valuable QTL or genes or linked markers is necessary for MAS and for dissecting gene functions influencing traits.
Genetic mapping of QTL inSaccharumspecies, especially in modern sugarcane cultivars derived from interspecific hybridization between the domesticated speciesS. officinarum(2n= 80)and the wild speciesS. spontaneum(2n= 40-128), has been hindered, owing to the presence of simplex and multiplex alleles and uneven polyploidy among homo(eo)logous groups (HGs), or aneuploidy [4]. Despite these disadvantages, several projects involving QTL mapping of agronomic traits in sugarcane based on simplex markers have been completed, mostly involving disease resistance [5-7], yield [8], and sugar content [9]. In a successful case,eight amplified fragment-length polymorphism(AFLP)markers distally flanking a gene for resistance to brown rust caused byPuccinia melanocephalawere identified [5], and two closely linked markers (R12H16 and 9020-F4) were developed based on the flanking AFLP markers[10]and have been widely used for screening sugarcane germplasm and/or new breeding lines [11].
In mapping studies [8,9] using genetic maps inSaccharum, the corresponding genotyping processes were low-throughput and time-consuming.With the rapid advance of high-throughput genotyping techniques based mainly on next-generation sequencing(NGS) and arrays, the relatively cumbersome markers of the pre-NGS era such as restriction fragment length polymorphism(RFLP),simple sequence repeat (SSR), and AFLP, were frequently replaced by single-nucleotide polymorphism (SNP) in QTL mapping, especially in fine mapping or gene clone-targeted mapping[12].Several hybrid cultivars with excellent performance,such as POJ2878,have been used repeatedly for cross breeding, resulting in a narrow genetic base and making genetic variation mining among modern sugarcane cultivars using these markers more difficult. A highthroughput genotyping platform is urgently needed in sugarcane population research. A genotype-by-sequencing (GBS)-based simplex marker genetic map was constructed by Balsalobre et al.[13] and used to map seven QTL for four agronomic traits, including sucrose content of cane, soluble solids content, stalk diameter,and fiber content. Similarly, Yang et al. [1] identified three QTL associated with resistance to sugarcane orange rust caused byP.kuehniiin a CP95-1039×CP88-1762 segregating population using GBS. However, a targeted array genotyping technology, which relies on previously identified and selected SNP derived from genomic DNA variants at orthologous sites within or between individuals, is more convenient for data analysis. Array genotyping has been successfully applied to QTL mapping in sugarcane. A 100 K SNP array derived from more than four million SNPs was developed and used to detect QTL linked to resistance to two dangerous sugarcane diseases: yellow leaf syndrome and ratoon stunting[2,14].
Sugarcane leaf blight(SLB),one of the most harmful fungal diseases and caused byStagonospora tainanensis, a necrotrophic fungal pathogen [15,16], threatens the sugarcane industry and causes high sugar losses in susceptible cultivars[17].It is prevalent in the main sugarcane planting areas of China, including Guangxi,Yunnan, and Guangdong provinces. The occurrence, development,and prevalence of SLB are strongly affected by environmental humidity [17]. At the early stage, white and translucent dots appear in part infected byS. tainanensis, and subsequently expand to form fusiform leaf lesions (1-50 mm long by 1-5 mm wide)accompanied by various colors of lesions from light yellow with a reddish tint to bright red or reddish-brown, finally leading to complete loss of photosynthetic capacity and leaf wilt[17].To date,research on SLB has been limited to pathogen isolation and identification [17] and disease epidemic regularity [18]. The molecular mechanisms involved in infection and host resistance have not been reported,nor have SLB resistance-associated QTL been identified, making it difficult to improve SLB resistance in sugarcane breeding programs. Because the occurrence and prevalence of SLB are uncertain owing to the influences of both host genotype and environmental conditions, it is desirable for breeding programs to identify DNA markers linked to SLB resistance.
The objectives of this study were to construct genetic maps in two leading sugarcane cultivars and elite hybrid parent based on a two-way pseudo-testcross strategy and array genotyping, and to identify QTL associated with SLB resistance and candidate genes underlying the QTL.
2. Materials and methods
2.1. Construction of F1 population and disease scoring
A cross of female YT93-159 (SLB-susceptible, 2n= 108) × male ROC22 (SLB-resistant, 2n= 110) was made in 2014 in Sanya, Hainan, China, and a biparental clonal F1population of 285 hybrid plants was used for evaluation of SLB resistance and genotyping by array. Propagation of sugarcane lines was performed by exclusively vegetative means. From 2015 to 2020, a randomized complete block design with three biological replicates was adopted in each year, and 20 buds of each sugarcane line were planted in a 1.3-m2plot to establish a dense population favorable to the occurrence of SLB. All lines and two parents were planted in the field in Dehong, Yunan, China (24°15’N, 97°53’E), one of the main sugarcane-producing regions.It is the most suitable ecological site for annual occurrence and prevalence of sugarcane leaf fungal diseases,especially for SLB,owing to its climatic conditions,in particular a thick fog, which usually starts in early morning (about 3:00 AM) and ends in late morning around 8:00 AM, providing enough humidity forS. tainanensisspores to infect sugarcane leaves. The severity of SLB for each line in each plot was investigated at the peak of the epidemic by scoring on the following scale: 1 = no or sporadic lesions in a few plants; 2 = up to 50% of plants infested with a few lesions; 3 = 50%-90% infestation with more obvious lesions; and 4 = many lesions appearing on the leaf surfaces of almost all plants, possibly with leaf wilting. The final resistance value for each tested line was determined as the highest score in four years of testing, including plant cane and ratoon, each for two crops. This disease-scoring method is commonly used in sugarcane breeding and new cultivar testing. Broad-sense heritability(H2) was estimated as follows [14]:
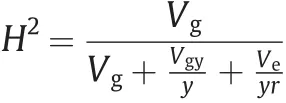
whereVgandVeare estimates of the genotype and error variances,respectively;Vgyis the estimate of interaction effect variance between genotype and year; andyandrare the numbers of years and biological replicates,respectively.All variances were calculated based on best linear unbiased prediction(BLUP)using the R package lme4 1.1-27 (https://mran.microsoft.com/web/packages/lme4/index.html).
2.2. SNP array genotyping and simplex marker selection
A SNP array containing 100K probes was adopted[2].The genomic DNA of the two parents and 285 progeny lines was extracted using the TianGen Plant Genomic DNA Isolation Kit (Tiangen Biotech, Beijing,China) and adjusted to a concentration of 15 ng μL-1for array genotyping by Thermo Fisher Scientific (Guangzhou,China) using the GeneTitan Multi-Channel Instrument System(Affymetrix, Santa Clara, CA, USA). According to the results of genotyping, probes were assigned to six categories using Axiom Analysis Suite 5.1 (https://downloads.thermofisher.com/Axiom_Analysis/Axiom_Analysis_Suite_v5.1_User_Guide.pdf), including poly high resolution (PHR, SNPs with well-separated genotype clusters and three alleles in the genotypes),no minor homozygote(NMH, SNPs with well-separated sample clusters; one cluster is homozygous and one is heterozygous for biallelic SNPs), monohigh resolution (MHR, SNPs with one well-formed sample cluster but monomorphic across all samples), call rate below threshold(CRBT,SNPs with a very low call rate),off-target variant(OTV,SNPs with low-intensity cluster resulting from mismatches between probes and genomic sequences for that sample cluster)and others(SNPs with more than one problematic issue)[2,19].Each cluster in a category contained at least four samples.
After genotyping,samples with call rate(CR)(the proportion of probes detected) lower than the threshold of 97.0% were filtered out[14].Then,in the NMH category,according to the coding criteria in the GACD software [20], the male- (category A = B) and female-polymorphic (C = D) markers with missing rate less than 20% in the population of 285 individuals were selected. The male-polymorphic markers were heterozygous in ROC22 and homozygous in YT93-159 (AB × BB), and the female-polymorphic markers were the contrary (AA × AB). In autopolyploid species,codominant markers can fall into multiple classes (about half the ploidy levels) in the heterozygous loci, usually called ‘‘marker dosages”. Because the dosage of each marker was still unknown,the chi-squared (χ2) test was used to correctly allocate marker dosages. Simplex markers should be present in one parent and absent in the other under the pseudo-testcross strategy[21].Thus,in the absence of segregation distortion in the F1population, the expected segregation ratio for simplex markers is 1:1 (presence:absence), irrespective of the pattern (bivalent or multivalent) of chromosome pairing[4,21].χ2-tests were fitted atPless than 0.01 and markers showing highly significant deviation from a 1:1 segregation ratio were dropped.
2.3. Linkage map construction and colinearity analysis
A two-way pseudo-testcross [22] mapping strategy was used,and all retained high-quality simplex male and female polymorphisms were used to construct genetic maps of respectively YT93-159 and ROC22 using GACD 1.2.The Kosambi mapping function was specified and used to transform recombination frequency to mapping distance before genetic map construction. Then, three essential steps were implemented in turn, and the corresponding parameters were set as follows [2,20]: logarithm of odds (LOD)value of 10.0 for grouping, nnTwoOpt algorithm for ordering, and sum of adjacent recombination frequency (SARF) for rippling.Finally, linkage groups (LGs) containing only one marker were dropped, and the remaining LGs were used for QTL mapping. The R package LinkageMapView 2.1.2 [23] was used to visualize the linkage maps, including the display of marker density.
To assign LGs to HGs, BLAST 2.11 (https://ftp.ncbi.nlm.nih.gov/blast/executables/blast+/LATEST/) was used to search for the positions of the probe sequences of markers in all LGs in chromosomescaleS. officinarum(LA Purple) genome (http://sugarcane.zhangjisenlab.cn/sgd/html/index.html). TheS. officinarumgenome was preferred because approximately 85% of chromosomes in modern sugarcane cultivars originated fromS. officinarumand the remaining were derived fromS. spontaneum, whose genome is highly colinear with that ofS. officinarum[24]. The LGs derived from the same chromosome were classified as a single HG [2].All LGs with more than 30 markers were selected for characterizing synteny and colinearity with the ancestral speciesS. officinarumand the related speciesSorghum bicolor. To improve the reliability of synteny and colinearity analysis, only probe sequences that showed unique alignments in bothS. officinarumandS. bicolorchromosomes were selected. Synteny and colinearity were visualized with Strudel 1.15 [25].
2.4. QTL analysis and gene annotations
All markers mapped to LGs were used as genotypic data and the highest resistance score of each effective line during four years of SLB resistance testing was taken as its phenotypic value. In an effective line, no score was missing from the four-year data set,given that a missing score may lead to the misjudgment of resistance values. Using inclusive composite interval mapping (ICIM)[26], GACD performed QTL analysis with a default LOD threshold of 3.0, which indicates that the likelihood of the presence of a QTL at the given locus is 1000 times more likely than that of no QTL. After QTL mapping, left and right markers of the main QTL were anchored to theS.officinarumgenome using BLAST.All genes in the interval between flanking markers of the main effect QTL were extracted using an in-house Perl script, and their structures and functions were identified with PlantTFDB 5.0 (http://planttfdb.gao-lab.org/) and DRAGO2-API pipeline [27].
2.5. Expression analyses of candidate causal genes
A highly susceptible hybrid line 47 (FN12-047, score = 4),together with its resistant male parent ROC22, were selected for transcriptional expression analysis[28].They were grown at Fujian Agriculture and Forestry University, Fuzhou, China. After the appearance of SLB symptoms visible to the naked eye,observation was performed daily to identify the development of disease symptoms,and at the medium to late disease stage,infected leaves were collected for pathogen inspection.Three biologically repeated samples totalling 12 were collected from healthy and infected leaves of ROC22 and FN12-047, respectively. For each sugarcane line, two plants with similar growth vigor were selected for sampling and leaves located at the same position were pooled for each sample.The process of RNA isolation and sequencing is described in our previous report[28].Quality control for the RNA-seq data was performed with fastqc 0.11.9 (Babraham Bioinformatics), and the quality-checked data was processed for trimming with fastp 0.20[29]. As an efficient and time-saving transcriptome readalignment tool, STAR was used as the aligner [30,31]. Compared with softwares TopHat and HiSAT2, STAR has an advantage due to its higher output of unique mappers [31]. For multiple alignments of a read, just one alignment with the highest score was retained to improve the accuracy of quantitative expression among homologous genes. Then, Featurecounts [32] was used to quantify gene expression.
3. Results
3.1. Determination of SLB resistance value
The occurrence and prevalence of plant leaf fungal diseases are readily affected by environmental factors such as temperature,humidity, and wind speed, because the pathogenic spores are directly exposed to the air in the process of infection.Even in areas suitable for occurrence of SLB,it is inevitable that some lines experience insufficient challenges by the pathogen in a given year,resulting in disparity between observed and actual resistance values.For this reason,we spent six years(2015-2020)to observe the resistance scores of 285 lines. However, we discarded two sets of scores obtained in 2017 and 2019 because the mean scores of the susceptible parent YT93-159 were less than 3.0, probably in consequence of the unsuitable environmental conditions,and four sets of scores collected from 2015, 2016, 2018, and 2020 were retained. For the final determination of resistance value for each line,we chose the highest score instead of the mean.Lines showing resistance in all four years’ tests were confidently accepted as resistant.With the aim of ensuring the reliability of the phenotypic score of each line, of the 285, 208 effective lines without missing phenotypic score in any year were selected, including 18 resistant(score=1),84 moderately resistant(score=2),83 moderately susceptible (score = 3) and 23 susceptible (score = 4) lines (Fig. S1).The heritability of SLB resistance in this population was 0.70, estimated from the four years’ data.
3.2. Inheritance analysis of simplex and multiplex markers
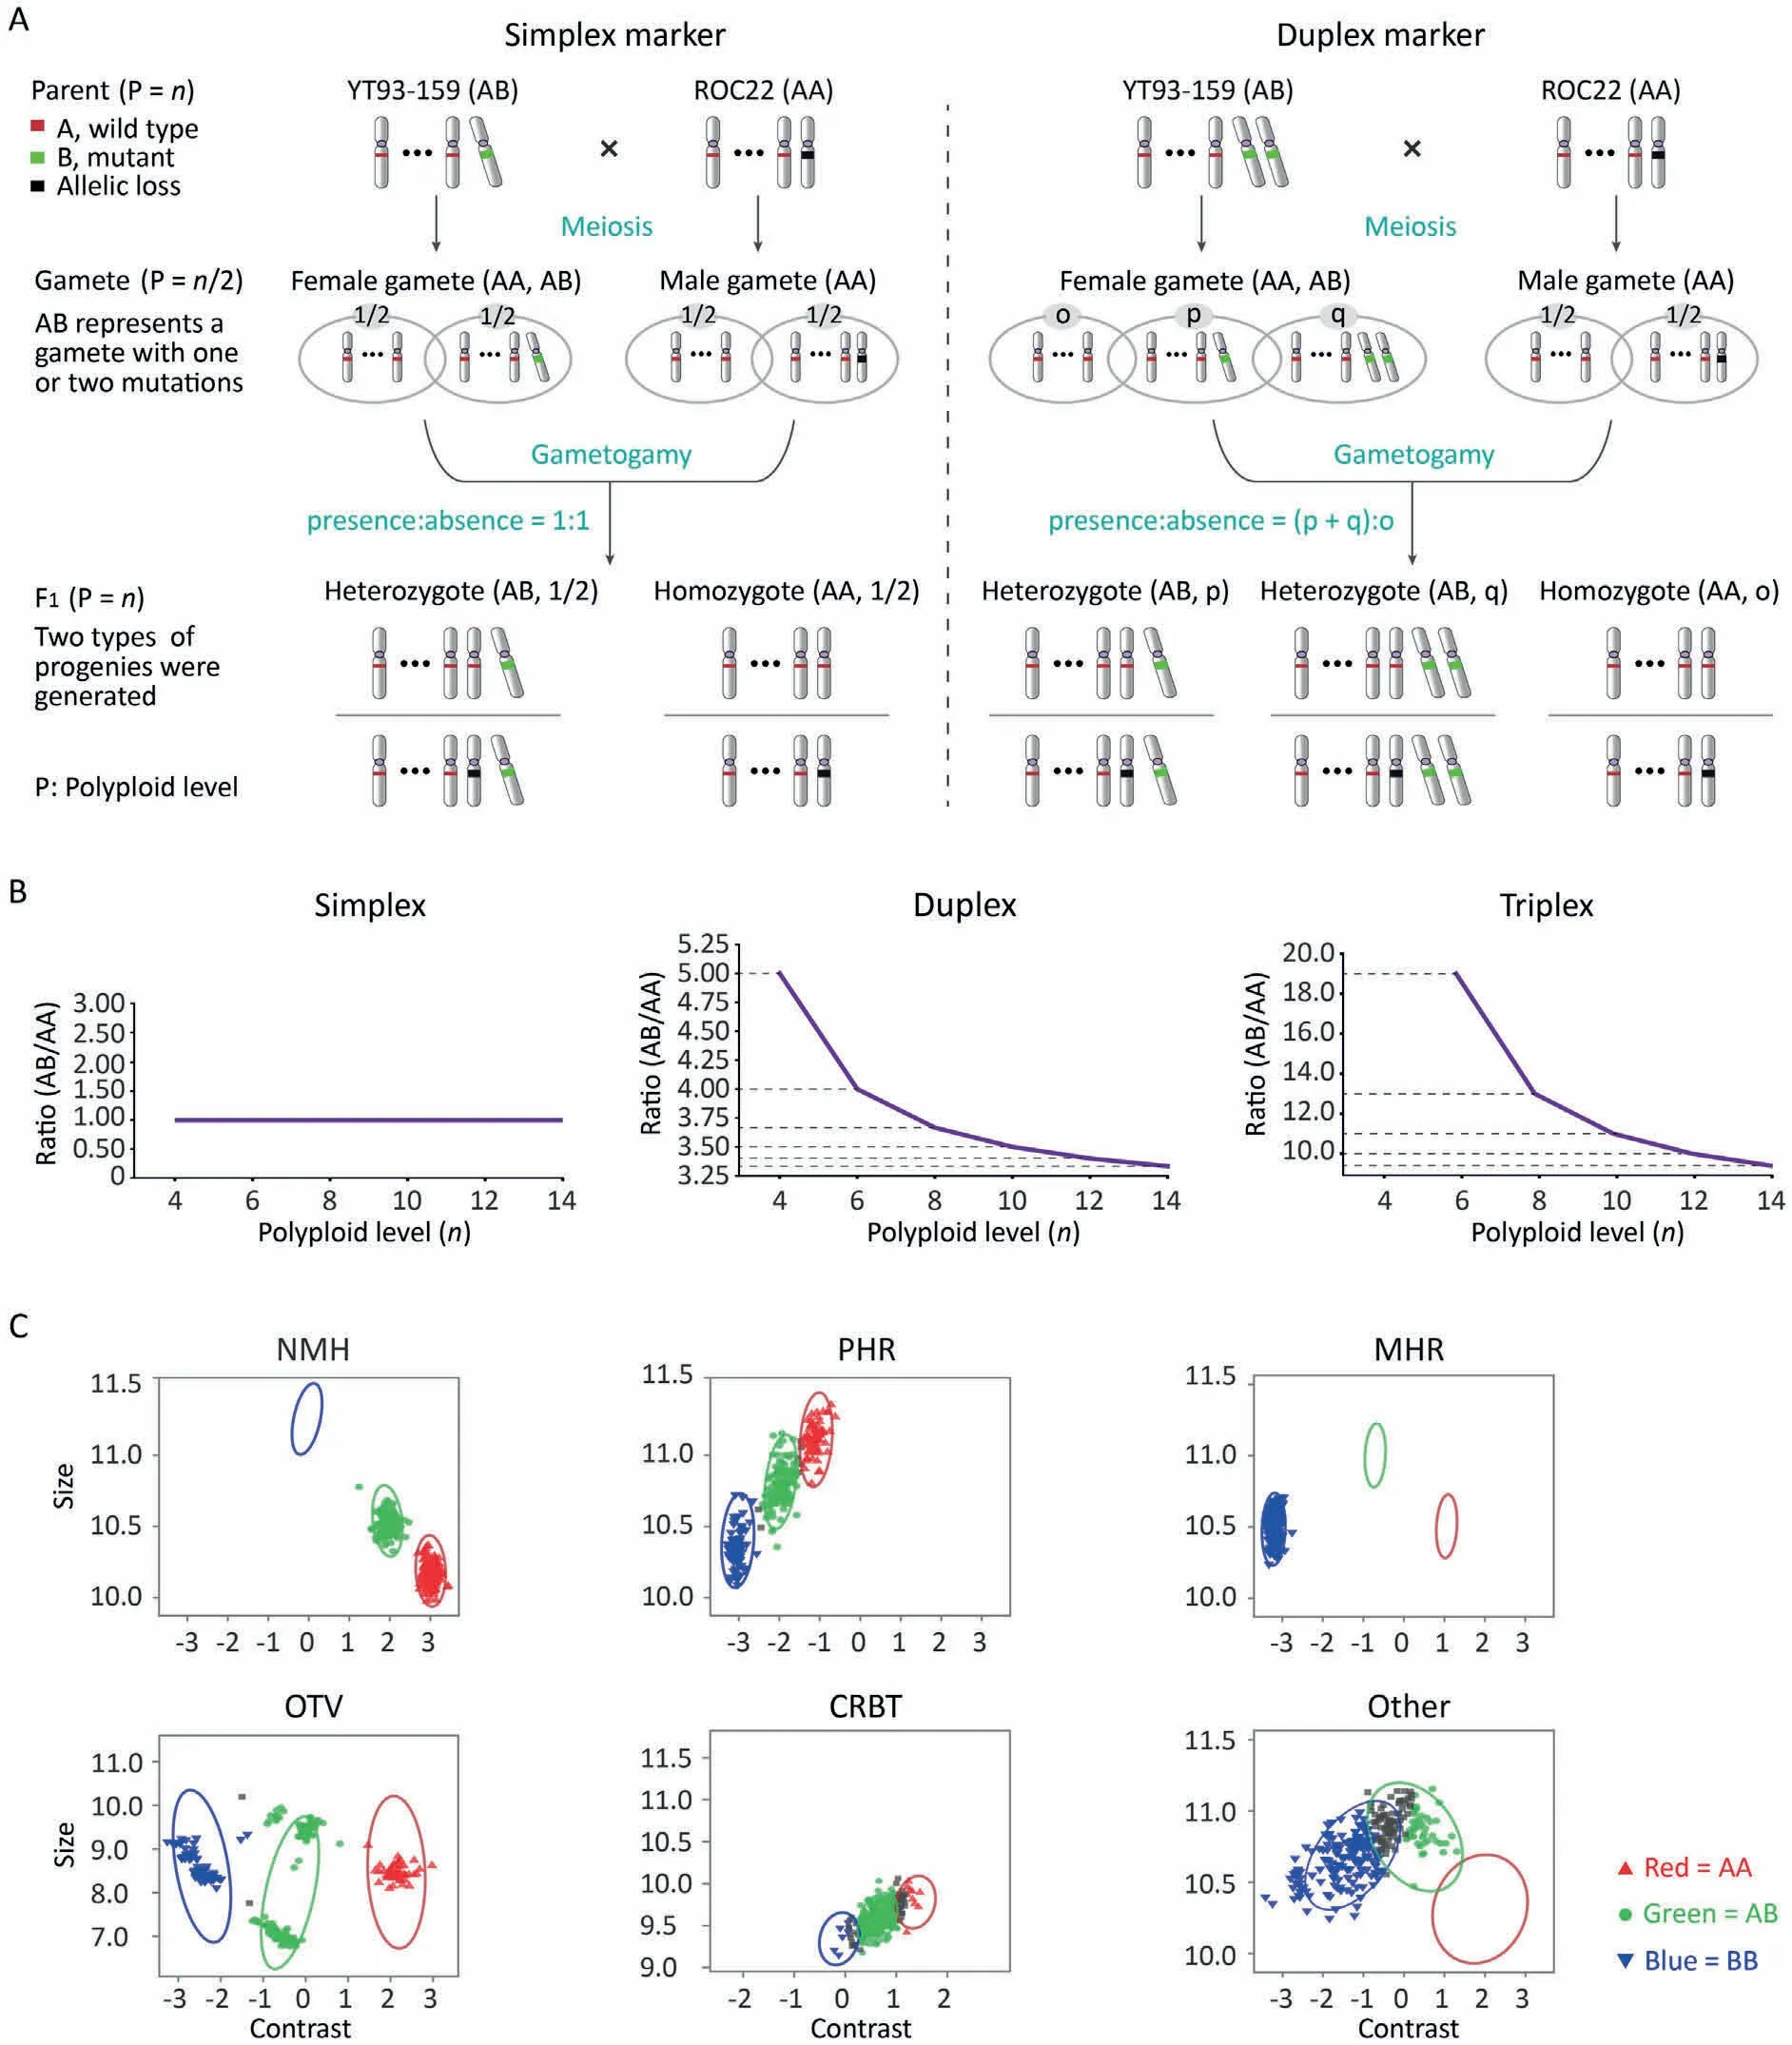
Fig.1. Identification of simplex markers from the SNP array genotyping results.(A)The separation and recombination of simplex and duplex markers in the autopolyploid F1 population.The segregation ratio of simplex markers in the F1 was 1:1,irrespective of ploidy and allelic loss;however,for duplex markers,the segregation ratio of(p+q):o would be affected by ploidy. (B)The segregation ratios of simplex,duplex, and triplex markers are variable across ploidy levels of the donor parent in the F1 created by the pseudo-testcross strategy. (C) All the probe sets were sorted into six classification categories. The no minor homozygote (NMH) containing two genotypes was the main category for simplex marker screening. The X dimension is called ‘‘contrast” and the Y dimension is called ‘‘size”. They are log-linear combinations of the two allele signal intensities.For alleles A and B,contrast is log2(A/B)and size is[log2(A)+log2(B)]/2.NMH,no minor homozygote,which passed all quality control(QC)and two clusters were observed;PHR,poly high resolution,which passed all quality control three clusters were observed;MHR,mono high resolution,which passed all QC but were monomorphic;OTV,off-target variant,which had low intensity cluster resulting from slight mismatches between the probe and the sequences for that group of individuals;CRBT,call rate below threshold, where genotype call rate was under 97%; Other, where the resultant SNP cluster pattern did not fall into any of the previous categories.
In euploid autopolyploid species, multiplex markers, such as duplex and triplex markers, can be integrated into a genetic map together with simplex markers[33,34].We can select reliable simplex markers according to the expected 1:1 (presence:absence)segregation ratio in a full-sib population, irrespective of ploidy level, however, for duplex markers, the segregation ratio of(p+q):o is affected by ploidy(Fig.1A,B).Saccharumspp.hybrids,including the two parents, are aneuploid and the ploidy levels among HGs are inconsistent [35]. The segregation ratios of multiplex markers vary with ploidy level and increase with the decrease of ploidy levels (Fig. 1A, B). For this reason, genotyping multiplex markers accurately in sugarcane hybrids is difficult and simplex markers are preferred for map construction. For marker mapping and QTL linkage analysis, allelic loci containing simplex markers can be treated like heterozygous genotypes in diploids,and several methods for diploids are readily available [36]. For femalepolymorphic simplex markers, the female parent YT93-159 can produce two gamete genotypes (AA and AB) at meiosis, while the nulliplex male parent ROC22 can produce only one gamete genotype (AA) (Fig. 1A), and vice versa for male-polymorphic simplex markers. The recombination of gametophytes (gametogamy) produces two types of individuals, whose genotypes are consistent with the parents. In autopolyploids, loss of alleles frequently occurs, so that the copy number of many alleles is not consistent with the corresponding chromosome ploidy, but the inheritance mode of simplex and duplex markers will not be affected(Fig. 1A). Because the loss of alleles does not change the number of chromosomes or the ploidy of a given HG, whether simplex or multiplex markers,both segregation and recombination still follow the process of biparental crossing under the given ploidy level.Although we obtained the results of six types of classification categories (Fig. 1C), we discarded the unqualified OTV (0.1%), CRBT(3.0%) and Other (13.6%), and from the remaining three highquality categories NMH (26.9%), PHR (6.4%) and MHR (50.1%), we chose only the NMH as the screening range of simplex markers,because it contains only two clusters/genotypes (Fig. 1C). After the χ2-test atP<0.01, non-simplex markers were excluded and respectively 1814 and 929 simplex markers with CR ≥97.0%from female YT93-159 and male ROC22 were retained.
3.3. Linkage map construction and homologous group division
For the sake of quality and accuracy, linkage analysis and map construction were performed only with simplex markers. In the female YT93-159,1814 simplex markers were identified,of which 1497(82.5%)were mapped to 93 LGs,which covered 4485.2 cM of genetic distance at a density of 3.0 cM per marker(Figs.2,S2),and 317 markers remained unlinked (17.5%). The numbers of markers among the 93 LGs vary significantly, with the largest, LG42 containing 88 markers and 13 LGs containing only two markers each.However, in each LG, the genetic distance between any pair of adjacent markers was less than 35.0 cM (the maximum interval was 33.6 cM). For the male ROC22, 776 (83.5%) of 929 identified simplex markers formed 92 LGs with marker numbers ranging from 2 to 80 and with a cumulative map length of 2720.0 cM(Fig. S3), and 153 (16.5%) markers remained unlinked. The mean marker density for the male map was 3.5 cM per marker (Fig. 2)and the maximum interval was 34.2 cM.With respect to both marker numbers contained and cumulative map length of the LGs assembled in the maps,YT93-159’s values were about twice those of ROC22.However,the LG numbers of the two parents were both close to their known chromosome numbers, suggesting that both maps would be useful for QTL mapping.
Because modern sugarcane cultivars are aneuploid and the ploidy of each group of homologous chromosomes is unknown,we cannot accurately genotype multiplex markers to construct HGs [37]. Using the homology between LGs and chromosomes of sugarcane relatives, we can theoretically divide the LGs into ten HGs,and the LGs belonging to one HG may be distributed on different chromosomes. Using BLAST, 1537 (67.6%) of the 2273 simplex markers from the two parents were anchored to the monoploid genome ofS. officinarumwith a strict E-value threshold of <1 × 10-20. According to the BLAST results, the LGs belonging to the same chromosome were classified as a single HG (Fig. 2).Finally,10 HGs(corresponding to 10 chromosomes)were obtained from each of the two parents,and 183 of 185 LGs from the two parents were divided into their respective HGs(Figs.S2,S3).Whether in ROC22 or YT93-159,the distribution features of LGs in HGs were consistent, and most LGs were distributed in HGs 01, 02, 03, and 04. The LG number varied widely among HGs. LG numbers varied widely in the two parents with one (HG08) to 17 (HG03 and HG04) in ROC22 and five (HG05) to 16 (HG04) in YT93-159.HG05 and HG08 both in ROC22 and YT93-159, corresponding to chromosomes 5 and 8 (Chr. 5 and Chr. 8), contained the fewest LGs and markers.
3.4. Synteny and colinearity between sugarcane cultivars and their close relatives
To assess the quality of the two maps,we investigated whether the synteny and colinearity between the longest 16 LGs andS.officinarumgenome were conserved,and whether there were frequent inter- and intrachromosomal rearrangements. Based on the 16 LGs each with more than 30 SNP markers,the mapped markers of LGs provide 492 anchor points to the chromosomes of the ancestral speciesS. officinarumand related speciesS. bicolor(the two species have an identical monoploid number:x= 10) (Fig. 3A).We used the anchored markers of LGs for subsequent analysis of colinearity and synteny between the two parents and the two mentioned close species, which displayed extensive conservation of synteny and colinearity among homologous chromosomes. The colinearity between the modern sugarcane cultivars andS. officinarumwas almost the same as that between the cultivars andS. bicolor, indicating thatS. bicolorandSaccharumhave highly conserved colinearity as previously reported [24,38]. A few interand intrachromosomal rearrangements were observed, supported by more than two consecutive markers in LG42 and LG04 of YT93-159 and LG45 of ROC22(Fig.3B,C).In summary,the linkage maps showed highly conserved synteny and colinearity with the ancestral speciesS.officinarum,indicating that the marker ordering of the two genetic maps were credible and that it would be reasonable to divide all LGs in the two parents into 10 HGs according to theS. officinarumgenome.
3.5. QTL analysis of SLB resistance and expression of candidate causal genes
Three major QTL (qSLB-1,qSLB-2andqSLB-5) and three minor QTL (qSLB-3,qSLB-4andqSLB-6) for SLB resistance were identified in YT93-159 (four) and ROC22 (two) with a LOD threshold >3.0,and the percentage of phenotypic variance explained (PVE) of those QTL ranged from 4.4% to 16.4%. Among them,qSLB-1was the main QTL with 16.4% of the PVE in YT93-159 (Table 1;Fig. 4A), and the percentage of PVE in YT93-159 and ROC22 reached 37.9% and 17.6%, respectively. The distances between the flanking markers ofqSLB-1andqSLB-3, both lying on LG69, were the largest, reaching 33.5 and 28.7 cM, respectively (Table 1). It is plausible that the causal genes underlying the QTL are expressed and that their expression can be used to suggest candidate genes,especially those with special functional domains. Accordingly,transcriptome sequencing was used to measure the expression of genes in the interval around the mainqSLB-1in leaf tissue before and after infection byS.tainanensisin resistant ROC22 and susceptible FN12-047,in particular transcription factors(TFs)and pathogen receptor genes (PRGs). Nine TFs and seven PRGs in theqSLB-1interval were highly expressed (Fig. 4B). The seven PRGs included six leucine-rich repeat receptor-like kinases/proteins and one wall-associated kinase (WAK).

Table 1Quantitative trait loci (QTL) associated with sugarcane leaf blight resistance in an F1 population from the cross of sugarcane YT93-159 (susceptible) and ROC22 (resistant).
4. Discussion
Owing to their high ploidy levels, genetic studies in sugarcane lag behind those in major diploid crops.DNA markers are essential tools for generating genetic linkage maps and advance genetic knowledge of plant species [39]. In addition, DNA markers can aid in breeding, germplasm conservation and utilization efforts.We obtained more than 2700 reliable simplex SNP markers using a high-throughput SNP array genotyping platform, using them to construct two high-density genetic maps for sugarcane leading cultivars and elite hybrid parents YT93-159 and ROC22. These two maps were used to identify six QTL associated with SLB resistance, and 16 candidate causal genes for the main QTL were identified.
4.1. Single-dose marker strategy
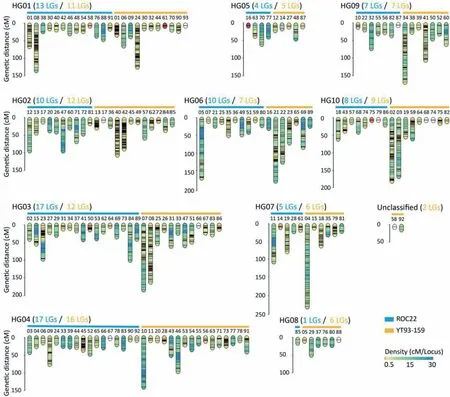
Fig.2. Construction and classification of linkage maps.Respectively 93 and 92 linkage groups(LGs)were constructed in YT93-159(orange)and ROC22(blue)and the marker densities in LGs are labeled in gradient color. LGs 58 and 92 of YT93-159 were not classified.
The concept ‘‘dosage” denoting the minor-allele count of a marker a a given ploidy level is applied to most polyploid genetic studies[40].If a minor allele is considered as the marker at a given locus, a species with ploidymshowsm/2 distinct dosage levels in the range 1 tom/2. In modern polyploid and aneuploid sugarcane cultivars with complex genetic background and more than 100 chromosomes, the construction of high-density genetic maps is more expensive than in diploid species, mainly because priority must be given to simplex markers [2,13,14], which account for about 50% of all dosages inSaccharum[41]. QTL-mapping approaches designed for diploids cannot be directly applied to autopolyploids. A suitable solution for this problem is using Mendelian markers: Simplex × Nullplex and Simplex × Simplex[42]. The simplex marker can represent a simplex allele in autopolyploids or an allele at one heterozygous locus in a diploid genome or in allopolyploids, whose segregation pattern corresponds to a simplex or a heterozygous allele in the gametes: half of gametes will contain it and the other half will not (Fig. 1A)[21]. These gamete types can be detected in F1progeny from a cross of two heterozygous parents, in which one parent carries the simplex marker while the other one does not, and the gamete types of the simplex markers can be used for construction of linkage maps [21]. The above hereditary mode in autopolyploids depends on coupling-phase simplex markers. Repulsion-phase recombination frequency estimates vary across ploidy levels, but lead to negligible distortions in map construction owing to low LOD scores [40].
4.2. Array genotyping helps to construct high-density genetic maps
The advanced high-throughput genotyping platform accelerates the detection of simplex markers,making the construction of sugarcane genetic maps rapid [2,13]. In comparison with highthroughput sequencing, a SNP array genotyping platform has the advantages of low cost and accurate genotyping [2,14]. Using SNP array genotyping, we quickly obtained more than 2700 simplex markers with segregation ratios tested by the chi-squared test. Identifying QTL in a plant genome is like looking for a needle in a haystack,and each marker is like an eye.The more eyes maps have, the wider the region that is likely to be covered by the genome linkage map. The genetic lengths of the two maps, especially the YT93-159 map(with 4485.2 cM),exceed those of most existing genetic maps in sugarcane [14,33,39,43,44]. Although a few previous studies [4,37,45] resulted in genetic lengths of 5000 cM, the mean marker intervals of our maps (respectively 3.0 cM and 3.5 cM per marker) are lower than those in previous studies, facilitating the fine mapping of QTL in the genome covered by the maps.Our maps were based on leading cultivars and elite hybrid parents,making them more directly and conveniently applicable to sugarcane breeding. Generally speaking, the utility of our maps, especially the map from YT93-159, is excellent at present. However,the coverages of Chr. 5 and Chr. 8 on these two maps were low and should be increased in future.
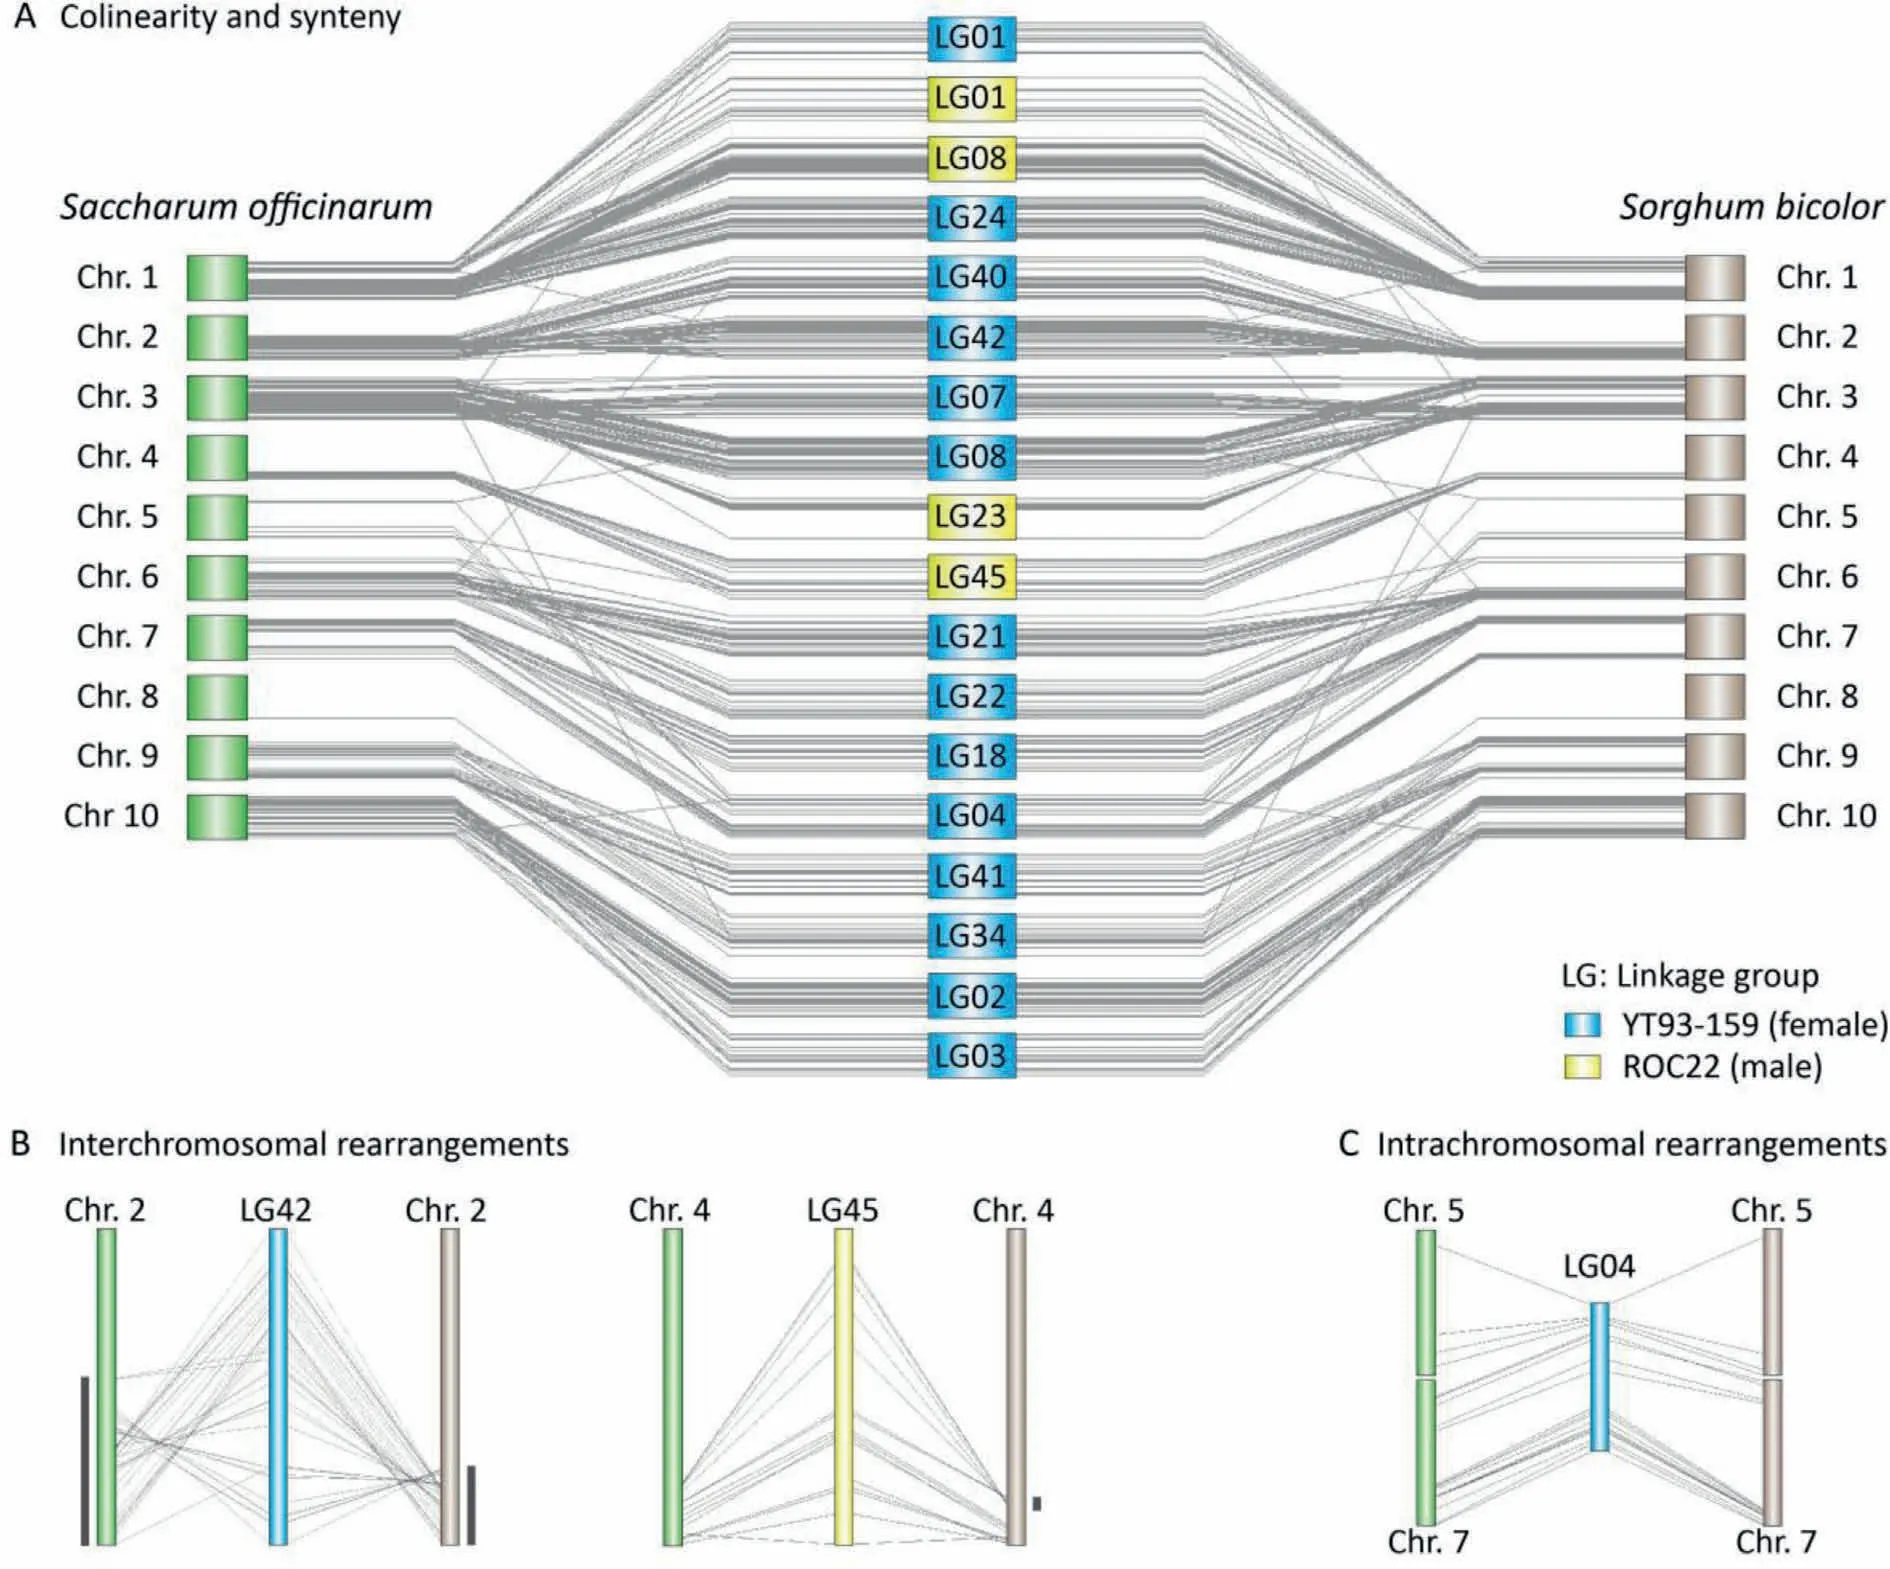
Fig.3. Colinearities and synteny among Sorghum bicolor,Saccharum officinarum,and Saccharum spp.hybrids.(A)The overview of colinearities and synteny among S.bicolor,S.officinarum, and 16 linkage groups (LGs) with the largest marker numbers indicates that the three species have highly conserved colinearity and synteny. (B)Interchromosomal rearrangements were observed in LG42 and chromosome 4(Chr.4)of S.bicolor.(C)LG04 of YT93-159 may have arisen from rearrangement of Chr.5 and Chr. 7 of S. officinarum.
4.3.Two-way pseudo-testcross design for genetic map construction in outcrossing species
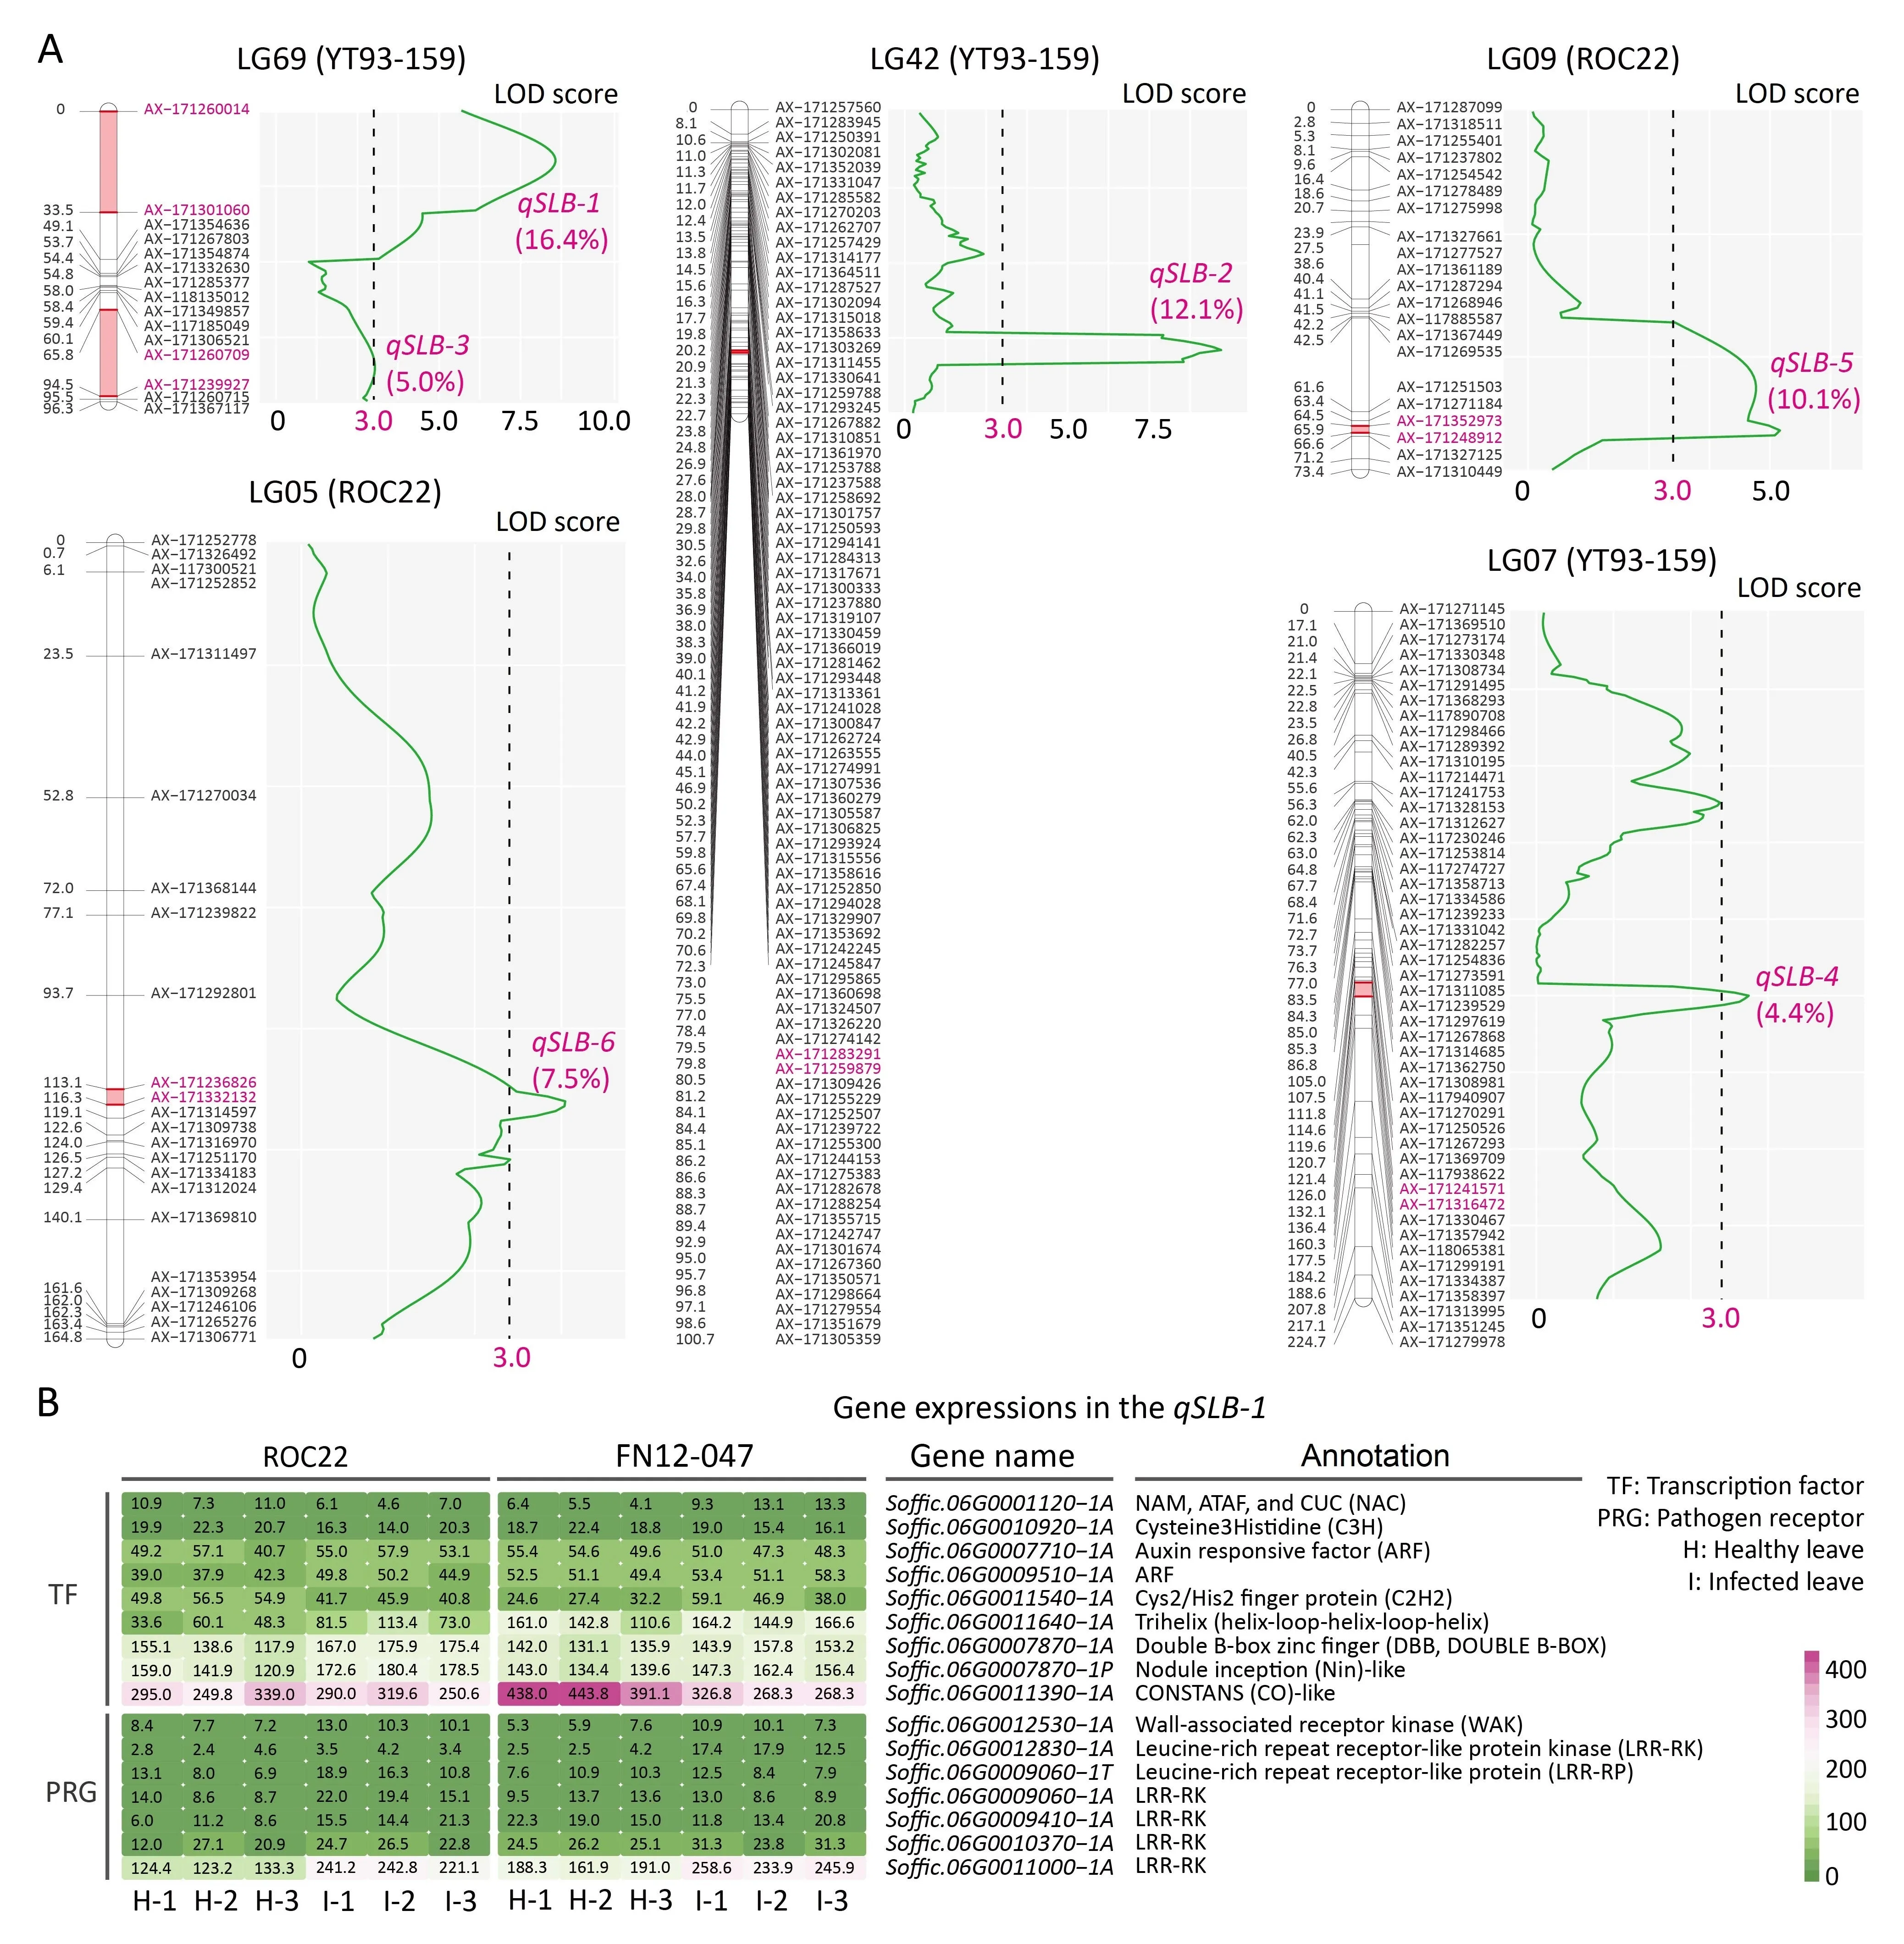
Fig.4. Six mapped quantitative trait loci(QTL)and candidate causal gene expression associated with the main QTL qSLB-1.(A)Four QTL(qSLB-1-qSLB-4)were from YT93-159 and two (qSLB-5 and qSLB-6) from ROC22, among which qSLB-1, qSLB-2 and qSLB-5 were the major QTL. (B) Nine transcription factors and seven pathogen receptor genes associated with qSLB-1 were highly expressed and were treated as candidate causal genes.
Artificially crossed segregating populations have been the most successful resources used to decipher the genetic bases of plant traits, and linkage mapping in plants can be implemented using diverse genetic designs [46]. In cross-pollinated and highly heterozygous species,several genetic maps have been constructed[34,47,48] using F1and backcross progenies, where heterozygous parents rather than inbred lines were hybridized.These hybridizations are analogous to test crosses,as one parent can be treated as the other’s tester and vice versa, even if the actual mating configurations of the two parents are unknown[49].Because one or both parents are highly heterozygous, genetic variation in the F1population is usually abundant. For sexually propagated species, it is difficult to determine the phenotype of the F1population for many years.However,sugarcane can be propagated indefinitely by canes,and F1progenies can be maintained permanently and phenotyped repeatedly.The population size used in this study is relatively large in sugarcane genetic mapping studies [1,14,44]. No study has yielded the ideal size of an F1population required for establishing an accurate genetic map. But the precision of calculated genetic distance between any two markers in a genetic map is directly related to the number of individuals that constitute the mapping population [50]. The results of an assessment [51] of impact of population size on QTL show that the size of an F1population strongly influenced estimates of PVE in tea plants,and a large population should be used for precise estimation.By virtue of the population size,our genetic map may be more accurate than previous maps.
4.4. Genome sequences assist in the division of HGs
According to previous studies [4,37], multiple-dose and repulsion-phase markers can be used as references for HG assignment. However, these two methods were not suitable for our F1population from aneuploid sugarcane hybrid cultivars. Because the ploidy level of each HG in sugarcane hybrid cultivars is difficult to determine,the segregation ratios of multiple-dose markers in F1and BC populations vary across ploidy levels (Fig. 1B, C). In addition, the population size of most studies cannot meet the requirement of accurately screening repulsion-phase linkage markers in autopolyploids with ploidy greater than 10,according to a previous study [49]. Fortunately, we have the latest chromosome-scale assembly ofS. officinarum. One of the ancestral species of cultivated sugarcane was selected as a reference for HG division.Compared to the sorghum genome as the reference [14],S. officinarumcan provide high classification accuracy.The analysis of colinearity between LGs and chromosomes indicated that sugarcane hybrid cultivars and its ancestor species(S.officinarum)maintained a high degree of colinearity,and a few rearrangements between or within chromosomes occurred (Fig. 3B, C).
4.5. The main QTL was detected in the susceptible parent
S.tainanensisis a plant-pathogenic species of Dothideomycetes,necrotrophic fungal pathogens [15,16]. Necrotrophic pathogens interact with their hosts in an ‘‘inverse gene-for-gene” manner,in which necrotrophic effectors are recognized by specific dominant genes in the host, leading to host-mediated programmed cell death (PCD) at the infection site [52]. For necrotrophic pathogens,cell death enables them to absorb nutrients and proliferate continuously, rather than preventing them from continuing to invade,thus causing more plant tissues to be infected. In this manner,plant genes and the pathogen molecules with which they interact confer susceptibility to necrotrophic pathogens, and plant genes are hijacked by necrotrophic fungal pathogens [52]. In wheat(Triticum aestivumL.) a WAK gene,Snn1, interacts withParastagonospora nodorum, a necrotrophic fungal pathogen also belonging to Dothideomycetes, which induces PCD and further promotes the development of the disease[53].We speculate that susceptibility to leaf blight arises from the interaction of susceptibility genes withS. tainanensisinfecting the susceptible parent, so that it is reasonable to find the main effect QTL in the susceptible parent YT93-159. One of the major QTLqSLB-1with 16.4% of PVE was identified in YT93-159,in which several TFs and PRGs were highly expressed(Fig.4).The receptors highly expressed inqSLB-1may be considered candidate genes for further investigation. The expressed genes also included a WAK gene,Soffic.06G0012530-1A.Given that bothS. tainanensisandP. nodorumbelong to Pleosporales, Dothideomycetes, we suspect that the most likely candidate gene interacting withS. tainanensisisSoffic.06G0012530-1A.
4.6. Two limitations of the study
Six QTL were identified: four from the female parent YT93-159 explaining 37.9% of phenotypic variation and two from the male parent ROC22 explaining 17.6%.The linkage analysis may underestimate QTL number [54] and that even though the number of markers in our maps exceeded 2000, they fell short of covering the large (10 Gb) sugarcane genome. For this reason, some QTL may have not been identified. In addition, although we callqSLB-1the main QTL, its PVE was still less than 20%. Among known QTL for other traits of sugarcane, the PVE of a QTL for resistance to sugarcane orange rust reached 58% [1]. The effect of a QTL can be overestimated in populations with size less than 500 owing to the Beavis effect [54]. QTL with higher PVE were not identified or genes for resistance to sugarcane leaf blight were all of minor effect.The best way to remove these two limitations is to increase the number of markers and improve the genome coverage of a genetic map, a costly and time-consuming task.
5. Conclusions
Two high-density genetic maps were constructed in the leading sugarcane cultivars and elite hybrid parents YT93-159 and ROC22 using the two-way pseudo-testcross mapping strategy. They covered respectively 4485 and 2720 cM of genetic distance and contained 1497 and 776 simplex SNP markers. Conserved colinearity and synteny between the two hybrid cultivars and their ancestral speciesS. officinarumwere observed, providing a reliable basis for QTL mapping of the two cultivars. Based on the two genetic maps, six (three major and three minor) QTL associated with sugarcane leaf blight resistance were identified, of which three QTL,includingqSLB-1andqSLB-2from YT93-159 andqSLB-5from ROC22, were the major QTL. Sixteen candidate causal genes in the main QTLqSLB-1interval, including nine transcription factors and seven pathogen receptor genes, were identified by transcriptome sequencing.
CRediT authorship contribution statement
Zhoutao Wang:Methodology,Writing- original draft, Investigation,Visualization.Guilong Lu:Investigation.Qibin Wu:Investigation.Aitian Li:Investigation.Youxiong Que:Project administration.Liping Xu:Conceptualization, Resources, Writing- review & editing, Investigation, Supervision.
Declaration of competing interest
The authors declare that they have no known competing financial interests or personal relationships that could have appeared to influence the work reported in this paper.
Acknowledgments
This research was funded by the National Natural Science Foundation of China(31971992,31571732),China Agriculture Research System(CARS-17)and the Science and Technology Innovation Project of FAFU (KFA17513A). The probe sequences of the array were provided by Prof. Jianping Wang of University of Florida, Gainesville, FL, USA. The reference genome used for analysis was kindly provided by Prof.Ray Ming and Prof.Jisen Zhang of Fujian Agriculture and Forestry University,Fuzhou,Fujian,China.We appreciate the support of Yunlei Zhou and Luhao Huang, Thermo Fisher Scientific.
Appendix A. Supplementary data
Supplementary data for this article can be found online at https://doi.org/10.1016/j.cj.2021.11.009.
- The Crop Journal的其它文章
- Research progress on the divergence and genetic basis of agronomic traits in xian and geng rice
- From model to alfalfa: Gene editing to obtain semidwarf and prostrate growth habits
- The chloroplast-localized protein LTA1 regulates tiller angle and yield of rice
- Genome-wide association study and transcriptome analysis reveal new QTL and candidate genes for nitrogen-deficiency tolerance in rice
- Advances in the functional study of glutamine synthetase in plant abiotic stress tolerance response
- Identification of microRNAs regulating grain filling of rice inferior spikelets in response to moderate soil drying post-anthesis

