Genome-wide association study and transcriptome analysis reveal new QTL and candidate genes for nitrogen-deficiency tolerance in rice
Qing Li, Xueli Lu, Changjian Wang, Lan Shen, Liping Dai, Jinli He, Long Yang, Peiyuan Li, Yifeng Hong,Qiang Zhang, Guojun Dong, Jiang Hu, Guangheng Zhang, Deyong Ren, Zhenyu Gao, Longbiao Guo,Qian Qian, Li Zhu, Dali Zeng
State Key Laboratory of Rice Biology, China National Rice Research Institute, Chinese Academy of Agricultural Sciences, Hangzhou 311401, Zhejiang, China
Keywords:Nitrogen NUE Rice GWAS RNA-seq
A B S T R A C T The development of rice cultivars with improved nitrogen use efficiency (NUE) is desirable for sustainable agriculture. Achieving this goal depends in part on understanding how rice responds to low soil nitrogen (N) and identifying causative genes underlying this trait. To identify quantitative trait loci(QTL) or genes associated with low N response, we conducted a genome-wide association study(GWAS)using a diverse panel of 230 rice accessions and performed a transcriptomic investigation of rice accessions with differential responses to low N stress at two N levels.We detected 411 GWAS-associated genes in 5 QTL and 2722 differentially expressed genes in response to low N,of which 24 were identified by both methods and ranked according to gene annotations, literature queries, gene expression, and genetic diversity analysis. The large-scale datasets obtained from this study reveal low N-responsive characteristics and provide insights towards understanding the regulatory mechanisms of N-deficiency tolerance in rice, and the candidate genes or QTL would be valuable resources for increasing rice NUE via molecular biotechnology.
1. Introduction
Nitrogen (N), an essential macronutrient throughout plant growth and development, is critical to crop production. Available N resources in soil are limited and N-deficiency seriously reduces crop yields. To sustain the high crop productivity demanded by modern agriculture,chemical N-fertilizer is often applied in excess.Total global N-fertilizer consumption in 2013/14 was estimated at 110.4 teragrams, and this amount is expected to grow at 1.2% per year driven by the growing population and food demand,reaching 117.1 teragrams in 2020/21[1].However,only 25%-50%of applied N-fertilizer is taken up by plants. The other 50% or more is dissipated into the surrounding environment by leaching, surface runoff,denitrification,and volatilization,resulting in serious pollution to agricultural and ecological environments [2-4]. Reducing Nfertilizer use while maintaining crop productivity is thus an urgent challenge.
Increasing crop nitrogen use efficiency(NUE)is regarded as one of the most effective ways to cope with the above dilemma. NUE,an indicator of the internal N-utilization by plants to externally supplied N,can be simply defined as grain yield per unit of applied N for cereals. The scope of NUE covers the overall processes involved in N uptake, transport, assimilation, redistribution, and signaling in plants, and each of these steps is indispensable to the improvement of NUE.
Rice (Oryza sativaL.), as the staple food of more than half the world’s population,accounts for 15%-18%of total N-fertilizer consumption worldwide [1], but its NUE is only about 30%-40% [5].The identification and breeding of rice cultivars with N-deficiency tolerance(NDT) and high NUE for non-optimized N conditions are thus critical for sustainable rice production. NDT refers to plants’capacity to maintain normal growth and good yield under low N content. Thus, NDT is a selection criterion for the improvement of NUE. Many quantitative trait loci (QTL) for NDT have been identified by QTL mapping using populations such as backcross introgression lines, recombinant inbred lines, and chromosome segment substitution lines under low N stress or diverse N levels [6-8].Using a set of introgression lines,Zhang et al.[9]identified a major QTL/gene,Tolerance of Nitrogen Deficiency 1(TOND1),that conferred NDT in theindicacultivar Teqing. Overexpression ofTOND1increased tolerance to N-deficiency inTOND1-deficient rice cultivars.In addition,several key components involved in rice NUE have been identified, including nitrate transporters OsNRT1s, OsNRT2s,and OsNAR2s,ammonium transporters OsAMTs,nitrate reductases OsNIAs, glutamine synthetases OsGS1s, and transcription factors(TFs)OsMADS,OsBT,and OsGRF4[10-12].
Despite the aforementioned genes that contribute to NDT or NUE in rice having been characterized, our understanding of the regulatory network of N-utilization remains limited.Better knowledge of the mechanisms underlying these traits is urgently needed for both the selection and well-directed breeding of N-efficient rice cultivars,especially when N is limited in the soil.Over the past ten years, Genome-wide association study (GWAS) has proved to be a powerful approach for dissecting complex traits and been used to identify corresponding loci or candidate genes[13-16].GWAS uses statistical methods to find associations between sequence polymorphisms and phenotypic variation among accessions.Compared with conventional QTL mapping using bi-parental populations,GWAS offers two major advantages. First, the genetic materials used for GWAS populations include more natural variation than the two parental lines used for segregation populations. Second,most GWAS can achieve relatively high mapping resolution owing to the presence of diverse historical recombination events [17].Moreover, Genome-wide transcriptome analysis has also been used to identify N-deficiency- or N-supplementation-responsive genes in rice seedlings[18-20].These two approaches can be combined to identify regulatory mechanisms of N-utilization in rice.
The objective of the present study was to apply GWAS and transcriptome analysis to identify low-N-responsive QTL or genes in rice at the reproductive stage.A set of 411 GWAS-associated genes in 5 QTL and 2722 differentially expressed genes(DEGs)responsive to low N were identified,among whichOsNIGT1,LOC_Os05g45020,andLOC_Os06g43090were three novel strong candidates for NDT or NUE. Our results identify potential QTL or genes controlling Nutilization in rice, and the candidate genes or QTL lay the foundation for further cloning and functional analysis.
2. Materials and methods
2.1. Plant material and genotyping
The GWAS panel of 230 accessions comprised 111indicaand 119japonicarice accessions collected from the 19 provinces of China and 17 other countries (Table S1). Total genomic DNA was isolated from leaf tissues for each accession using the CTAB method,and a library of each accession was constructed following the manufacturer’s instructions (Illumina, San Diego, CA, USA). All rice accessions were sequenced using the Illumina Nova 6000 platform at BerryGenomics Company (http://www.berrygenomics.com/, Beijing, China). The paired-end reads were mapped to the rice Nipponbare reference genome (IRGSP-1.0) with BWA[21]. SNP calling for each accession was performed with GATK[22]. The 3,180,471 SNPs with minor-allele frequency >5% and a missing data rate <10% were used for subsequent GWAS.
2.2. Nitrogen treatments and SPAD measurements
The 230 rice accessions were cultivated in the experimental field of China National Rice Research Institute (Hangzhou, Zhejiang,China).At the four-leaf phase,seedlings of uniform size were transplanted to hydroponic culture in conventional Kimura B medium.After two weeks of recovery growth, the seedlings were divided into two groups and transferred into new Kimura B medium containing low N(LN,47 μmol L-1NH4NO3)or normal N(NN,188 μmol L-1NH4NO3).Dicyandiamides(0.2 mg L-1)was added as a nitrification inhibitor to prevent the conversion of ammonium to nitrate in the nutrient solution.The nutrient solution was renewed every six days and its pH was maintained at 5.5 ± 0.5 by addition of diluted NaOH or HCl every three days.The soil plant analysis development(SPAD)values in flag leaves for each rice accession were measured at the full heading stage with a Soil-Plant Analysis Development chlorophyll meter-502 (Minolta, Japan). Each leaf’s SPAD value was recorded as the mean of three SPAD readings in the upper,middle, and lower parts of the blade. Finally, the mean SPAD value of five randomly selected plants was used to represent the SPAD reading for each rice accession.
2.3. Population structure analysis
The population structure of the 230 rice accessions was calculated with ADMIXTURE based on their SNP data [23]. TheKvalue with the lowest cross-validation (CV) error was assigned as the number of subgroups. A pairwise distance matrix derived from the simple matching distance for all SNPs was calculated to construct a neighbor-joining phylogenetic tree using PHYLIP[24].iTOL(https://itol.embl.de/)was used to optimize the exported phylogenetic tree.
2.4. GWAS analysis
GWAS was performed with EMMAX using a mixed linear model method [25]. The SPAD values of the rice accessions were used as input values for GWAS under NN and LN conditions. For the NN vs. LN condition, the input values of the rice accessions for GWAS were the SPAD differences between NN and LN treatments.Considering the population size and number of SNPs in association analysis, the whole-genome significance cutoff was defined asP=1 × 10⁻⁸. Manhattan and quantile-quantile (Q-Q) plots were drawn with GAPIT in R. Given that the genome-wide linkage disequilibrium(LD)decay rate in cultivated rice is 100-200 kb[13],the 200-kb interval around a significant SNP site was defined as a QTL region, and adjacent significant SNP within a distance less than 200 kb was merged into a single QTL. The SNP with the lowestPvalue in a QTL region was defined as the lead SNP.
2.5. RNA-seq analysis
Five LN-responsive and 5 LN-unresponsive rice accessions were selected from 230 accessions according to the changes of SPAD values and chlorophyll contents in their flag leaves responsive to low N (Table S1). Their total RNAs were extracted from the leaves and roots of the rice plants used for the above SPAD detection using the Trizol reagent(Invitrogen).Equal amounts of isolated RNAs of five LN-responsive or 5 LN-unresponsive rice accessions with the same tissue and N treatment were bulked separately and designed as LNRL(leaves of LN-responsiveindicaunder LN),NN-RL(leaves of LNresponsiveindicaunder NN), LN-TL (leaves of LN-toleratedindicaunder LN), NN-TL (leaves of LN-toleratedindicaunder NN), LN-RR(roots of LN-responsiveindicaunder LN), NN-RR (roots of LNresponsiveindicaunder NN), LN-TR (roots of LN-toleratedindicaunder LN) and NN-TR (roots of LN-toleratedindicaunder NN) for RNA-seq.
In total, 16 samples (two types of rice × two tissues × two N treatments × two biological replicates) were sequenced. An Illumina library was constructed according to the manufacturer’s instructions (Illumina, San Diego, CA, USA). High-throughput RNA sequencing was performed using the Illumina HiSeq 2500 platform at BerryGenomics Company (http://www.berrygenomics.com/Beijing, China). Clean reads were aligned to the rice Nipponbare reference genome (IRGSP-1.0) with HISAT2 [26]. To calculate the readcount value of each gene in each sample, a quantitative analysis of gene expression was performed with featureCounts [27].Gene expression was quantified as mean fragments per kilobase of exon per million fragments mapped (FPKM) of two biological replicates. Gene differential expression analysis was performed using edgeR software with the readcount values as input data.The screening criteria for DEGs distinguishing two samples were|log2fold change| >1 and adjustedP-value (Padj) <0.05.
2.6. qRT-PCR analysis
First, two LN-responsive and two LN-unresponsive rice accessions were grown in Yoshida solution for 7 days after germination.Seedlings of uniform size were then transplanted to fresh Yoshida solution with various N concentrations (LN, 14.3 μmol L-1NH4-NO3; NN, 1.43 mmol L-1NH4NO3; HN, 5.72 mmol L-1NH4NO3)and grown for seven days.Finally,their total RNAs were extracted from leaves and roots using the AxyPrep Multisource Total RNA kit(Axygen).
cDNA synthesis was performed with the kit of ReverTra Ace quantitative PCR RT Master Mix (Toyobo). Quantitative real time PCR (qRT-PCR) was performed using the ABI 7900 Real-Time PCR system and Applied Biosystems SYBR Green Kit following the manufacturers’ instructions. The relative gene expression level ofOsNIGT1was calculated using the 2-ΔΔCT method with a reference geneOsACT2. The primers used forOsNIGT1were qOsNIGT1-F (5′-CCGATGATGACACGGAGAAACA-3′) and qOsNIGT1-R (5′-CTTGGGC GTCGCTACATGG-3′). The primers used forOsACT2were qOsACT2-F(5′-ATCAATCCTTGCATCTCTGAGC-3′)and qOsACT2-R(5′-TAGAAG CACTTCCTGTGGACGA-3′).
3. Results
3.1. Phenotypic variation of 230 rice accessions in response to low N
N is the component of chlorophyll, and nearly 80% of leaf N is allocated to chloroplasts [28]. Accordingly, leaf N concentration is positively correlated with chlorophyll content, which can be inferred from leaf greenness [29]. The handheld SPAD chlorophyll meter has proven to be a useful tool for rapid, nondestructive assessment of chlorophyll and N-utilization status(N accumulated relative to its supply), and SPAD readings partly indicate N uptake efficiency in rice [30]. Therefore, the SPAD values in flag leaves of the 230 rice accessions at two N levels were used to assess their NDT (Table S1). The SPAD values ranged from 25.34 to 44.97 in LN and 27.80 to 43.70 in NN, while their mean SPAD scores for LN and NN were 35.32 ± 5.20 and 36.66 ± 3.61 respectively(Fig. 1A, B). Mean SPAD values varied significantly between LN and NN treatments (Fig. 1C). We further analyzed the changes of SPAD values inindicaandjaponicasubpopulations.It revealed that the SPAD values ofindicaaccessions changed from 25.34 to 43.47 in LN and 27.80 to 40.92 in NN,whereas those of thejaponicasubpopulation varied between 26.46 and 44.97 in LN and 28.70 and 43.70 in NN (Fig. 1A, B). The mean SPAD value of theindicasubpopulation was significantly decreased in the LN condition(Fig.1C).In contrast,the mean SPAD value of thejaponicasubpopulation in LN was similar to that in NN (Fig. 1C). Taken together,the SPAD values for each population showed continuous distributions in both LN and NN treatments, a finding consistent with the presence of a quantitative trait and beneficial for subsequent GWAS mapping.
3.2. Identification of significant loci for SPAD value using GWAS
The 230 resequencing rice accessions were divided into two subgroups according to ADMIXTURE analysis (Fig. 2A). Similarly,the phylogenetic tree also indicated that these 230 rice accessions diverged primarily betweenindicaandjaponicasubpopulations(Fig. 2B). Thus, the 230 rice accessions could be divided into two subgroups,indicaandjaponica, and the classification was broadly consistent with the previous classification.
To identify loci associated with the measured SPAD values,GWAS was performed for the full panel of 230 rice accessions under NN, LN, and NN vs. LN conditions. However, except for one significant SNP found on chromosome 8 for the NN vs. LN condition, no significant SNP with the threshold (-log10(P)) above 8 was identified under NN or LN treatment (Figs. 2C, S1; Table 1).The full population was further divided into two subpanels for GWAS,given that the SPAD values ofindicaandjaponicaaccessions showed different responses to LN treatment. A total of 24 associated SNPs distributed on chromosomes 3, 5, and 6 were detected in theindicasubpanel under LN treatment (Figs. 2D, S1; Tables 1,S2).However,no significant SNP was identified in thejaponicasubpanel. All 25 significant SNPs were confined to only five genomic regions,which were assigned as QTL regions.For each QTL,the significant SNP number ranged from 1 to 16,with the largest number of SNPs found in q5 (Table 1).
The genes in the five QTL regions were scanned based on the Nipponbare reference genome to search for known or putative genes involved in N-utilization or chlorophyll metabolism. A total of 411 annotated genes were identified, including 61, 61, 137, 57,and 95 in q1, q2, q3, q4, and q5 respectively (Fig. 2D; Table S3).Among them, 53 genes harbored SNPs with aP-value less than 10E-7 (Table S3). In QTL region q3,LOC_Os05g44950,LOC_Os05g44970, andLOC_Os05g45000were annotated as senescence-induced receptor-like serine/threonine-protein kinase precursors. In QTL region q5,LOC_Os06g44900was predicted to be associated with leaf senescence,LOC_Os06g44230(OsRpoTp)[31] andLOC_Os06g44460were known to be involved in chloroplast genesis.However,QTL regions q1,q2,and q4 did not contain any promising candidates according to the gene annotations.

Fig. 1. SPAD variation in 230 rice accessions. (A) Distribution of SPAD values under NN. (B) Distribution of SPAD values under LN. (C) Comparison of SPAD values of two subpopulations under NN and LN conditions. Different letters above the box plots represent significant differences among different groups (P <0.05) based on Tukey’s multiple comparison test.
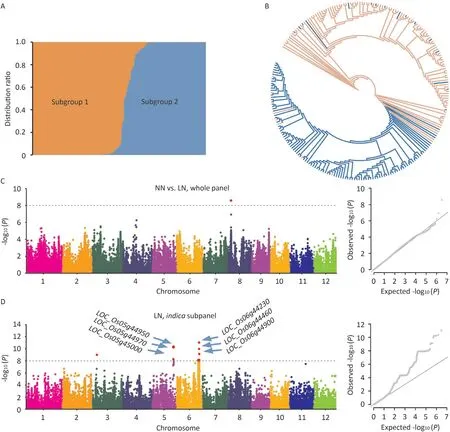
Fig.2. GWAS for SPAD in 230 rice accessions.(A)Subgroups(K=2)inferred using ADMIXTURE software.(B)Neighbor-joining tree of 230 rice accessions.Colors of pink and blue represent indica and japonica accessions in Table S1,respectively.(C and D)Manhattan and quantile-quantile(Q-Q)plots of GWAS for SPAD under NN vs.LN in the whole panel (C), and under LN in the indica subpanel (D), respectively.

Table 1Five GWAS regions associated with N-utilization or chlorophyll metabolism.
3.3. Gene differentially expressed analysis of LN-responsive and LNunresponsive indica accessions
Genome-wide investigation of gene expression by RNA-seq represents an effective approach for dissecting the gene regulatory networks of the complex agronomic trait.We used this technology to identify N-deficiency-responsive genes in rice. Considering the greater SPAD variation inindicathan injaponicaunder Ndeficiency and the large genetic difference between the two subpopulations, we chose five LN-responsive and 5 LN-unresponsiveindicaaccessions as experimental materials.
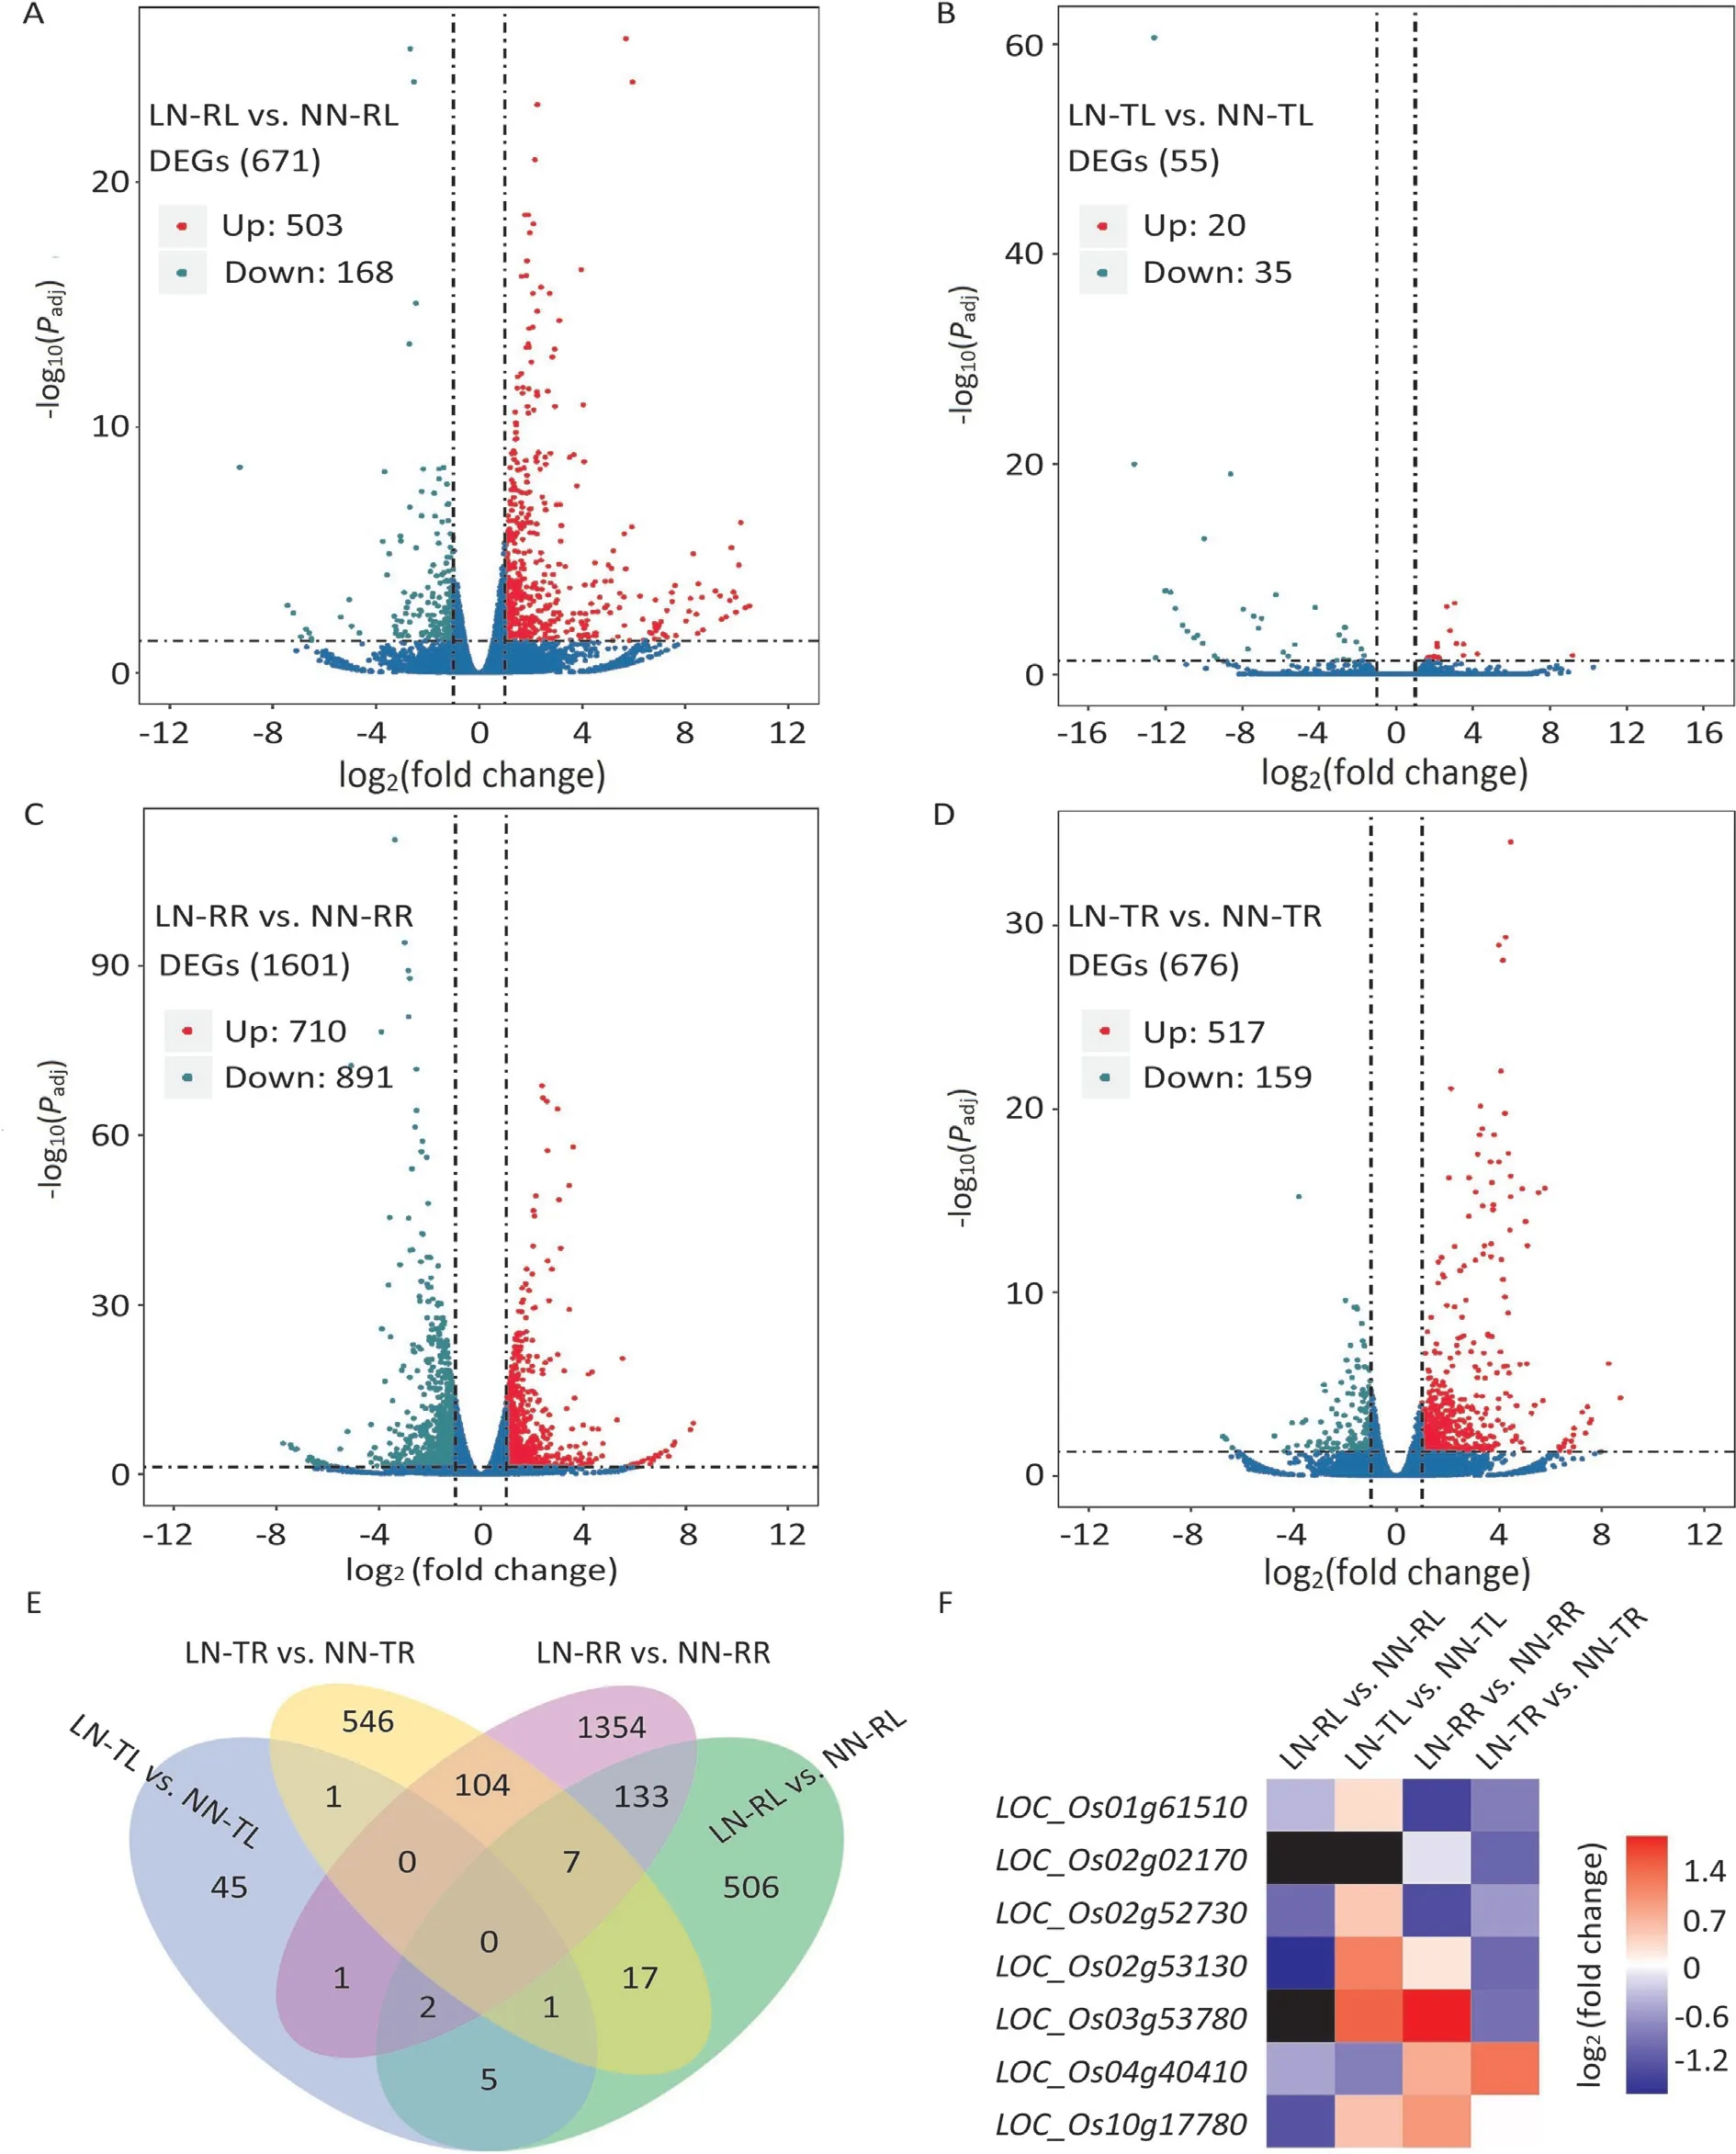
Fig.3. DEGs in leaf and root from LN-responsive and LN-unresponsive rice accessions under N-deficiency.(A-D)Summary of DEGs for LN-RL vs.NN-RL(A),LN-TL vs.NN-TL(B), LN-RR vs. NN-RR (C), and LN-TR vs. NN-TR (D), respectively. The volcano plots show the overall distribution of DEGs. Up-regulated and down-regulated DEGs are indicated by red dots and green dots, respectively. (E) Overlapping numbers of DEGs in multiple comparisons. (F) Fold change of DEGs involved in N-utilization. The black square in the heat map indicates that at least one of the two samples has a FPKM value of 0.
When the LN were compared with the NN transcripts, 2722 DEGs were identified: 671 (503 up-regulated and 168 downregulated), 55 (20 up-regulated and 35 down-regulated), 1601(710 up-regulated and 891 down-regulated), and 676 (517 upregulated and 159 down-regulated) for LN-RL vs. NN-RL, LN-TL vs. NN-TL, LN-RR vs. NN-RR, and LN-TR vs. NN-TR, respectively(Fig. 3A-D; Tables S4-S7). The LN-responsive rice showed respectively 12.2 times and 2.4 times more DEGs in leaves and roots than LN-unresponsive rice.Roots also contained more DEGs than leaves,which is not surprising considering the direct uptake and use of Nfertilizer by roots. Among these DEGs, there were respectively 8 and 111 commonly expressed DEGs in (LN-RL vs. NN-RL) ∩(LNTL vs. NN-TL) and (LN-RR vs. NN-RR) ∩ (LN-TR vs. NN-TR)(Fig. 3E; Table S8). Of the 8 common DEGs, 7 were up-regulated and one was down-regulated owing to a deficient N supply in both LN-RL and LN-TL.Among the 111 common DEGs,19 were simultaneously induced, 27 were co-inhibited, and the others showed opposite regulatory patterns in LN-RR and LN-TR (Table S8). In addition, we also found two and 142 common DEGs in (LN-TL vs.NN-TL) ∩(LN-TR vs. NN-TR) and (LN-RL vs. NN-RL) ∩(LN-RR vs.NN-RR),respectively(Fig.3E;Table S8).For the two common DEGs,one was co-suppressed and the other showed an opposite regulatory pattern under N-deficiency. Of the 142 common DEGs in LNresponsive rice, 34 were simultaneously up-regulated, 18 were down-regulated together,and the remaining 90 showed the opposite regulatory types (Table S8).
We further investigated whether these 2722 DEGs contain some known or putative genes involved in N-utilization. Based on the gene annotations in the Rice Genome Annotation Project(http://rice.plantbiology.msu.edu/), we found seven DEGs associated with N-utilization:LOC_Os01g61510(encoding putative ammonium transporter),LOC_Os02g02170(OsNRT2.1, encoding a high-affinity nitrate transporter),LOC_Os02g52730(encoding ferredoxin-nitrite reductase),LOC_Os02g53130(OsNR2, encoding nitrate reductase),LOC_Os03g53780(OsAMT4, encoding a putative ammonium transporter),LOC_Os04g40410(OsNAR2.2, encoding a putative high-affinity nitrate transporter), andLOC_Os10g17780(encoding a putative nitrate reductase) (Tables S4-S7). Among them,OsNRT2.1is highly expressed throughout roots and functions mainly in nitrate uptake under low nitrate concentrations [32,33].OsNR2, encoding an NADH/NADPH-dependent nitrate reductase,confers differences in nitrate assimilation and NUE betweenindicaandjaponicaby allelic variation [34].OsNRT2.1was downregulated about twofold in LN-TR, but not significantly changed in LN-RR.As forOsNR2,it was up-regulated in LN-TL,but decreased in LN-RL and LN-TR (Fig. 3F). We also identified dozens of DEGs that may be involved in chlorophyll metabolism or chloroplast development, includingLOC_Os01g17170(YGL8, encoding magnesium-protoporphyrin IX monomethyl ester cyclase),LOC_Os02g54980(encoding putative pheophorbide a oxygenase),LOC_Os03g20700(OsCHLH, encoding magnesium-chelatase),LOC_Os03g59120(encoding putative pheophorbide a oxygenase),LOC_Os04g58200(OsPORA,encoding protochlorophyllide reductase A),LOC_Os01g64960(PsbS1,encoding chlorophyll A-B binding protein),LOC_Os04g59440(PsbS2, encoding chlorophyll A-B binding protein), andLOC_Os11g13890(OsLHCB5, encoding chlorophyll AB binding protein) (Tables S4-S7). Most of these genes were upregulated in LN-TR (Fig. S2).
Transcription factors (TFs) play a critical role in controlling plant growth and development via the regulation of gene expression. Here, a total of 123 differentially expressed rice TFs were identified, encompassing 15 families of TFs (Table S9). The TFs ofAP2,MYB,WRKY,zinc finger,andNACwere relatively large TF families responsive to low N,accounting for 23.6%,21.1%,17.9%,13.0%,and 4.9% respectively. Overall, most TFs were increased in LN-RL and LN-TL,while the up-regulated and down-regulated genes were evenly split in LN-RR and LN-TR (Table S9).LOC_Os02g22020(OsNIGT1) may be involved in N-utilization and was downregulated 2.5-fold in LN-TR and 1.9-fold in LN-RR. Four homologs inArabidopsis, i.e.,NIGT1.1,NIGT1.2,NIGT1.3, andNIGT1.4, redundantly regulate both nitrate response and N starvation response and function in optimizing N acquisition and utilization under fluctuating N conditions [35,36]. To further confirm the response ofOsNIGT1expression to the supply of an N source, we performed qRT-PCR using seedlings of two LN-responsive and two LNunresponsive rice accessions treated with various N concentrations.OsNIGT1expression increased significantly with the increase of N concentration in both LN-responsive and LN-unresponsive rice accessions, a finding consistent with the transcriptome results(Fig. S3).
3.4. Candidate gene screening by integration of GWAS and RNA-seq
To narrow the range of candidate genes, we integrated the results of GWAS and RNA-seq. In total, 24 DEGs were obtained in the GWAS-associated regions,including 4,4,6,5,and 5 distributed in the QTL of q1, q2, q3, q4, and q5, respectively (Table 2). Strikingly,LOC_Os03g11190,LOC_Os05g45020, andLOC_Os06g43090were derived from the DEGs of (LN-TR vs. NN-TR) ∩(LN-RR vs.NN-RR), (LN-RL vs. NN-RL) ∩(LN-RR vs. NN-RR), (LN-TL vs. NNTL) ∩(LN-RL vs. NN-RL) respectively, and exhibited simultaneous up-regulation or down-regulation patterns (Table S8). According to the functional annotations, we first ruled outLOC_Os06g43150andLOC_Os06g44690,given that they were predicted as retrotransposon and transposon, respectively (Table 2). Of the remaining 22 members,nine encode expressed proteins with unknown functions and the other annotated genes have not been found to be associated with N-utilization.
We further screened the candidates with high probability by referring to their expression profiles in Rice Expression Database(http://expression.ic4r.org/). As shown in Fig.S4,LOC_Os03g10980,LOC_Os03g11030,LOC_Os03g11190,LOC_Os05g45140,LOC_Os05g45380, andLOC_Os06g44360were expressed at low levels in roots, shoots, and leaves, implicating that they may not be involved in N transport or assimilation. In contrast,LOC_Os05g44900,LOC_Os05g45020,LOC_Os05g45030,LOC_Os06g43090,LOC_Os06g45020,andLOC_Os08g07010exhibited higher expression levels in at least one tissue of roots, shoots, and leaves, hinting that they are more likely candidates.
The allelic variations of these genes were also investigated in 583 resequencing rice accessions (Table S10), consisting of 391indica, 160japonica, and 32 intermediate accessions classified by resequencing data.LOC_Os06g43150contained the most nonsynonymous SNPs (30), which is not surprising given that it was a retrotransposon (Table 2). In contrast, no nonsynonymous mutation was found inLOC_Os03g11190,LOC_Os03g11250,LOC_Os05g45020,LOC_Os05g45410,LOC_Os06g43030,LOC_Os06g43090,LOC_Os06g44250,LOC_Os06g44690,LOC_Os06g44750, andLOC_Os08g07630, indicating that they are unlikely to affect N-utilization via the changes in the protein sequence (Table 2). Next, haplotypes of these genes were built based on the nonsynonymous SNPs after rare haplotypes with frequency lower than five were discarded.The haplotype numbers for these genes in 583 accessions ranged from 1 to 6 (Table 2). A further classification of the two major haplotypes of 14 genes with more than one haplotype revealed that they are diverged betweenindicaandjaponicaexcept forLOC_Os06g44360andLOC_Os08g07660(Fig. 4), suggesting that they might function inindicaandjaponicawith different strengths.
4. Discussion
4.1. NUE divergence between indica and japonica subspecies
Asian cultivated rice accounts for 95% of the world’s cultivated rice, and contains two distinct subspecies,indicaandjaponica.Besides differing in more than 40 characteristics, which include drought tolerance, cold sensitivity, germination, grain shape, and panicle architecture,indicaandjaponicaalso show differing NUE[37].In general,indicahas a much higher NUE thanjaponicaowing to its stronger N uptake and assimilation capacity [38,39]. Thesame phenomenon was also observed in our study, a finding that the SPAD ofindicawas more responsive to the change of N content thanjaponica(Fig. 1). But the molecular mechanisms underlying the gap of NUE between two subspecies remain abstruse. To date,only a few genes,OsNRT1.1B,OsNR2, andOsDNR1, have been identified to show functional divergence in NUE betweenindicaandjaponica[34,40,41].OsNRT1.1Bis a nitrate transceptor gene.OsNRT1.1B-indicavariation was associated with increased nitrate uptake and root-to-shoot transport, as well as up-regulated expression of nitrate-responsive genes. More importantly, the near-isogenic line (NIL) carrying theOsNRT1.1B-indicaallele showed 10%-30% increase in grain yield and NUE compared to the NIL with theOsNRT1.1B-japonicaallele [40]. OsNR2 regulates the NUE divergence betweenindicaandjaponica, withindicaOsNR2 showing stronger NR activity and nitrate uptake[34].More interestingly,there was a feed-forward interaction betweenOsNR2andOsNRT1.1B,withOsNR2-indicapromoting theOsNRT1.1B-indicafunction and vice versa, by which the grain yield and NUE were further improved following introgression of both theindica OsNRT1.1BandOsNR2alleles intojaponicaaccessions [34]. In contrast to the positive regulation ofOsNR2andOsNRT1.1B,OsDNR1has recently been identified as a negative regulator of NUE in rice by modulating auxin homeostasis, and contributes to the difference in nitrate uptake capacity betweenindicaandjaponica. Theindica OsDNR1variant conferred reducedOsDNR1mRNA abundance, and boosted auxin content, thereby improving nitrate uptake and assimilation by upregulating genes involved in nitrate metabolism (e.g.OsNRT1.1B,OsNRT2.3a,OsNPF2.4, andOsNIA2)[41].Given that the NUE ofindicais 30%-40%higher thanjaponica,more components responsible for the NUE divergence between these two subspecies need to be identified. In the present study,we acquired 24 candidate genes through the combined analysis of GWAS and RNA-seq(Table 2).Interestingly,many of these genes exhibited natural variations betweenindicaandjaponicabased on haplotype analysis (Fig. 4), implicating that they might contribute to the NUE divergence between these two subspecies.
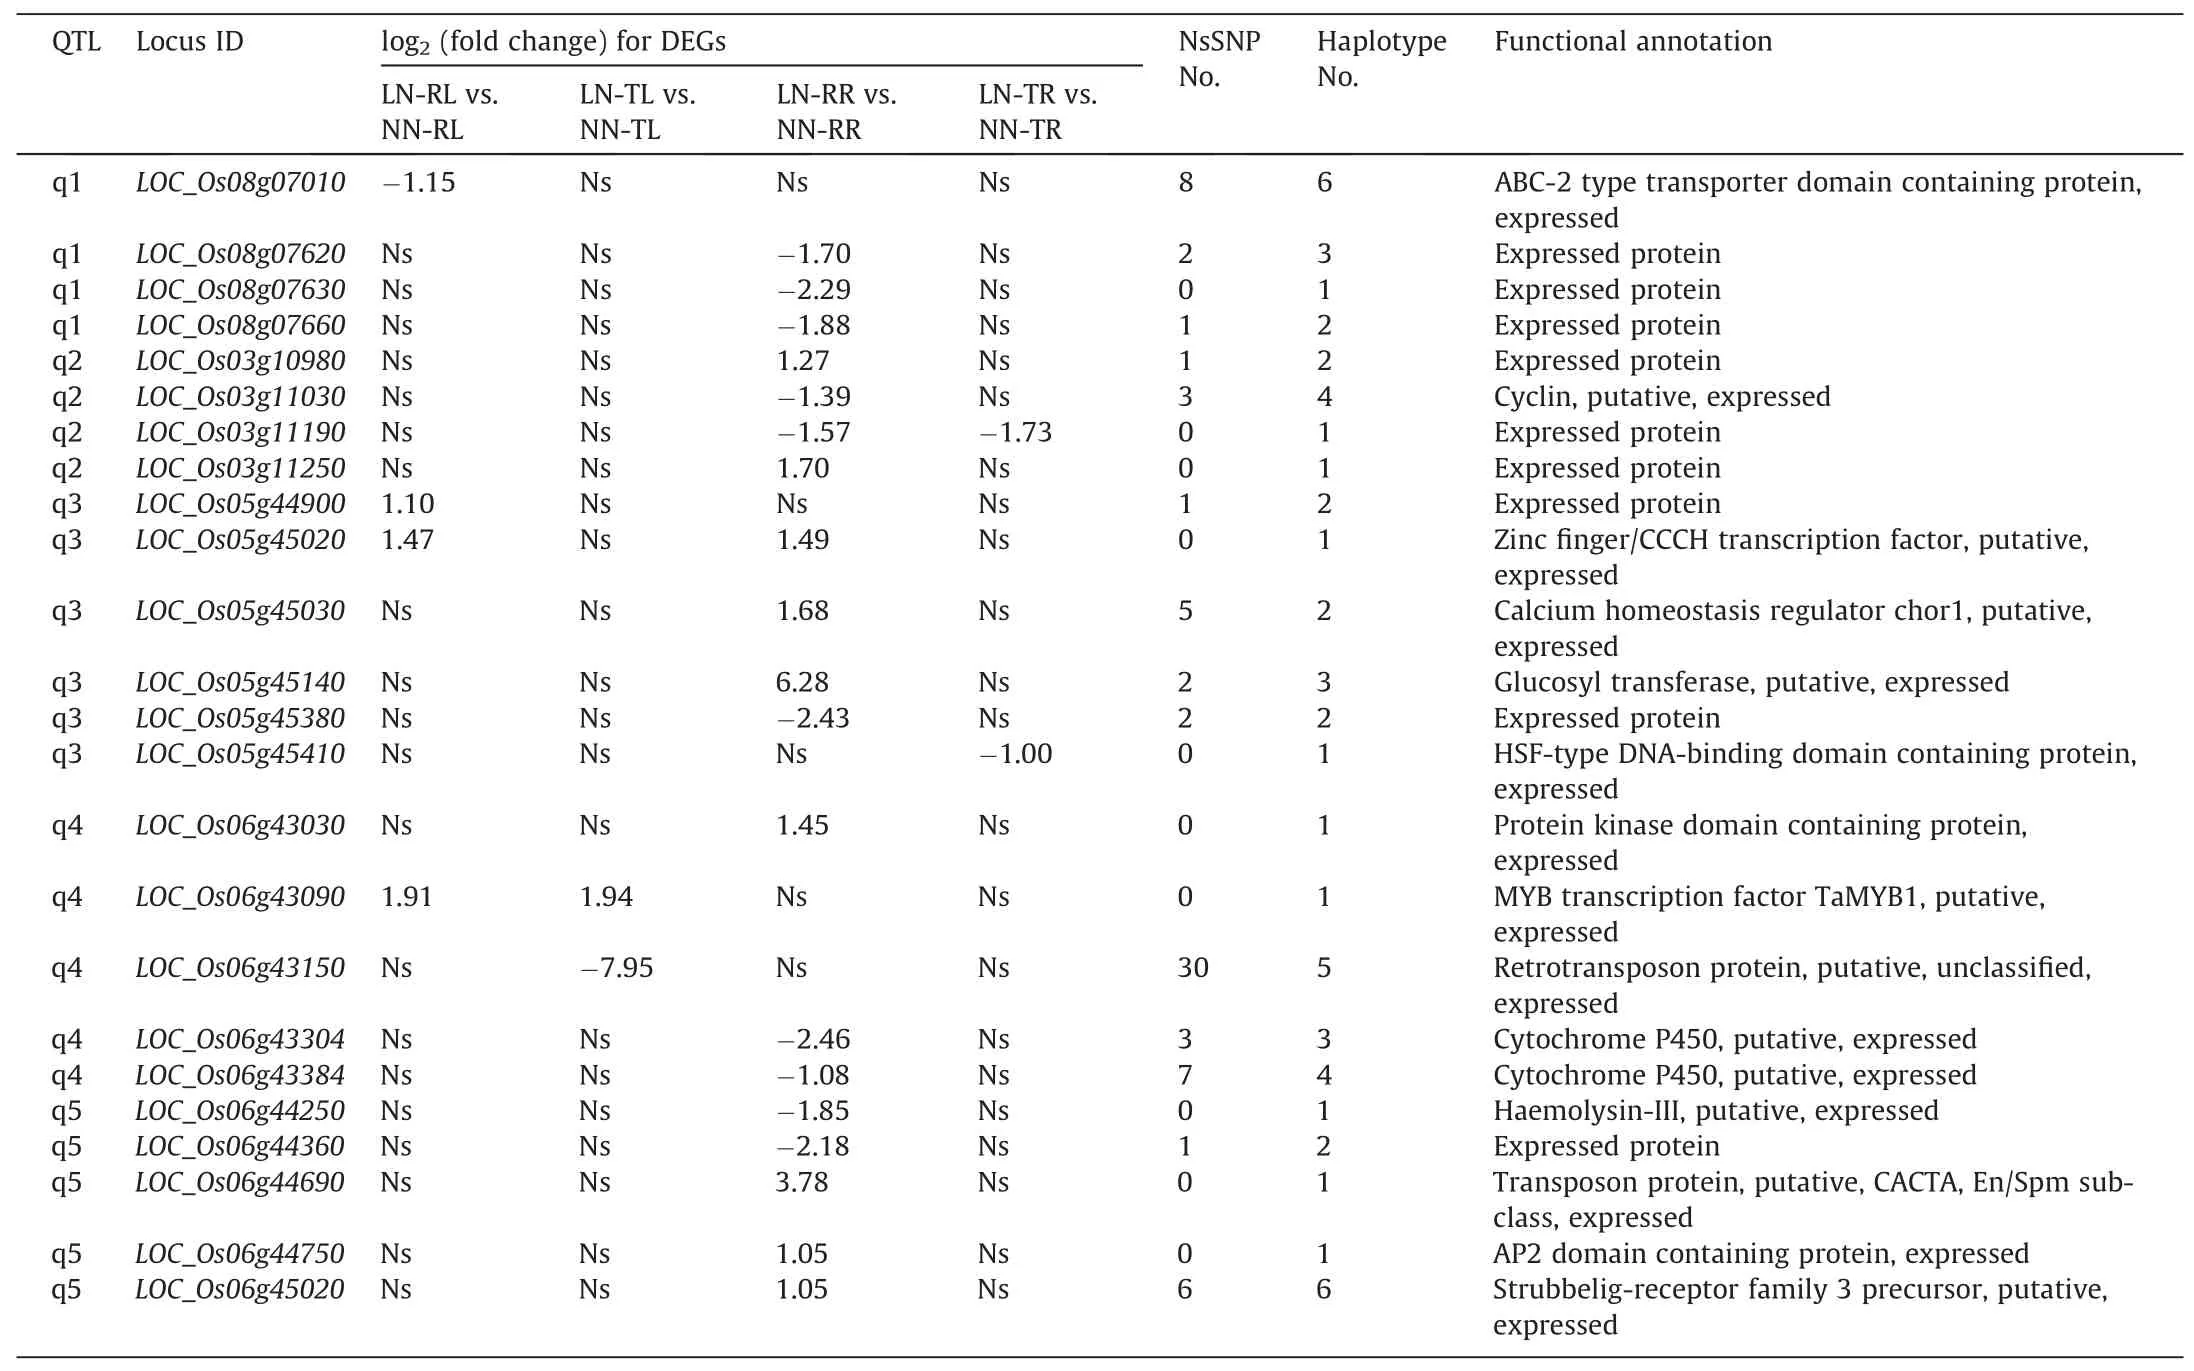
Table 2Details of DEGs in GWAS regions.
4.2. Comparison between GWAS regions and the previous QTL
GWAS is a relatively new method for investigating the genetic architecture of intricate traits in numerous accessions and identifying causative loci or genes underlying these traits.In the past decade, GWAS has been successfully used to detect the potential loci for dozens of traits in rice,and several critical genes were identified and further demonstrated by subsequent functional experiments[13,14,42-45]. However, few studies have taken advantage of GWAS to identify NDT or NUE-related loci or genes in rice [46-48]. Here, we surveyed the SPAD values in flag leaves of 230 rice accessions under NN and LN conditions to assess their Nutilization status,and performed GWAS to screen the loci or genes underlying this trait. A total of five GWAS regions were detected,and all were close to at least one known QTL:n-p8for plant weight under low N,qSdw8for shoot dry matter weight without Nfertilizer,n-r3for root weight under low N,qNCP-3-1for percent N content,Q6for tiller number,Q31for N concentration in sheaths plus stem,qRW6for root weight,qYd6for yield per plant, andqSdw6for shoot dry weight (Table 1), suggesting that the GWAS signals are reliable [8,49-52].
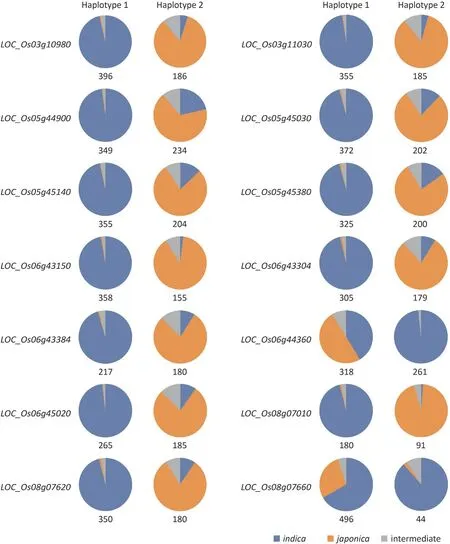
Fig.4.Distributionoftwomajor haplotypesin583rice accessions.Numbersof detected haplotypesaregivenbeloweach panel.
4.3. Transcription factors regulating N-deficiency responses in rice
Nitrate and ammonium are two major inorganic N forms available in the soil for plants. Although ammonium is generally regarded as the predominant N form for rice grown in the paddy field,as much as 40%of the total N absorbed by rice is in the form of nitrate derived by nitrification in the rhizosphere[37].As important regulatory components for gene expression, several rice TFs involved in nitrate or ammonium signaling have been identified.In nitrate signaling, the MADS-box TFsOsMADS25,OsMADS27,andOsMADS57promote nitrate accumulation and regulate root development [53-55]. In contrast,OsBT, an ortholog of twoArabidopsisBric-aBrac/Tramtrack/Broad family genes (BT1andBT2),acts as a negative regulator of nitrate uptake and NUE in rice[56]. In ammonium signaling,OsIDD10activates the transcription of ammonium uptake and N-assimilation genes, and participates in a regulatory circuit between ammonium and auxin signaling in rice roots [57].More importantly,OsGRF4, a transcription factor that improves grain size and yield in rice,has recently been shown to be involved in both nitrate and ammonium signaling[58].It promotes N uptake and assimilation by transcriptional activation of N metabolism genes. Although these TFs have been identified, they are far from enough to uncover N signaling in rice. In this study,we performed a deep transcriptomic investigation and identified 123 TFs differentially expressed in response to low N (Table S9).Based on gene annotations and literature queries, we identifiedOsNIGT1as a strong candidate gene for N-utilization because its four homologs inArabidopsisact as negative regulators of nitrate signaling[35,36].When N-fertilizer was abundant,the fourNIGT1swere rapidly induced and directly inhibited the expression of many N starvation-responsive genes, including the N transportassociated genesNRT2.1,NRT2.4,NRT2.5, andNAR2.1. In contrast,the decreasedNIGT1sexpression under N starvation allowed N starvation-inducible genes to be up-regulated, leading to attenuation of N starvation response.In rice,OsNIGT1was also induced by N-fertilizer (Fig. S3), but the mechanism underlying N-utilization remains unclear. In addition, two MADS-box TFsLOC_Os06g11330(OsMADS55),LOC_Os08g02070(OsMADS26) may also play a role in N-utilization, given that their three paralogs (OsMADS25,OsMADS27,andOsMADS57)modulated root development by affecting nitrate accumulation [53-55]. By combining GWAS and RNAseq, we identified four differentially expressed TFs in GWAS regions, includingLOC_Os05g45020(zinc finger/CCCHTF),LOC_Os05g45410(HSF-type TF),LOC_Os06g43090(MYBTF), andLOC_Os06g44750(AP2TF)(Table 2).What’s more,LOC_Os05g45020andLOC_Os06g43090were two common DEGs of(LN-RL vs.NN-RL)∩(LN-RR vs.NN-RR),(LN-TL vs.NN-TL)∩(LN-RL vs.NN-RL)respectively (Table S8), and showed higher expression levels in rice(Fig. S4), implying that they are strong candidates for NDT or NUE.But surprisingly,although there were many SNPs in their promoter (2 kb upstream 5′of the start codon) and genomic DNA sequences, none of the four differentially expressed TFs harbored nonsynonymous mutations in 583 rice accessions (Table 2), suggesting that they differ in function among rice accessions mainly by changes in gene expression rather than by changes in protein function.
CRediT authorship contribution statement
Dali Zeng:Conceptualization,Supervision,Resources,Writingreview& editing and Funding acquisition.Qian Qian:Supervision,Resources and Funding acquisition.Li Zhu:Supervision,Resources and Funding acquisition.Qing Li:Project administration,Investigation, Visualization, Writing - Original Draft, Writing - Review &Editing, and Funding acquisition.Xueli Lu:Investigation, Visualization and Writing - Original Draft.Changjian Wang:Investigation, Visualization and Writing - Original Draft.Lan Shen:Investigation,Resorces.Liping Dai:Investigation.Jinli He:Investigation.Long Yang:Investigation.Peiyuan Li:Investigation.Yifeng Hong:Investigation.Qiang Zhang:Resources,Funding acquisition.Guojun Dong:Resources.Jiang Hu:Resources.Guangheng Zhang:Resources.Deyong Ren:Resources.Zhenyu Gao:Resources.Longbiao Guo:Resources.
Declaration of competing interest
The authors declare that they have no known competing financial interests or personal relationships that could have appeared to influence the work reported in this paper.
Acknowledgments
This work was supported by the National Natural Science Foundation of China (31661143006, 32101755, 31971872, U2004204),the Key Research and Development Program of Zhejiang Province(2021C02056), the Central Public-interest Institution Basal Research Fund (CNRRI-202110, CNRRI-202111), the Ten-Thousand-Talent Program of Zhejiang Province (2019R52031),and the Agricultural Science and Technology Innovation Program of the Chinese Academy of Agriculture Sciences.
Appendix A. Supplementary data
Supplementary data for this article can be found online at https://doi.org/10.1016/j.cj.2021.12.006.
- The Crop Journal的其它文章
- Research progress on the divergence and genetic basis of agronomic traits in xian and geng rice
- From model to alfalfa: Gene editing to obtain semidwarf and prostrate growth habits
- The chloroplast-localized protein LTA1 regulates tiller angle and yield of rice
- Advances in the functional study of glutamine synthetase in plant abiotic stress tolerance response
- Identification of microRNAs regulating grain filling of rice inferior spikelets in response to moderate soil drying post-anthesis
- TaGW2L, a GW2-like RING finger E3 ligase, positively regulates heading date in common wheat (Triticum aestivum L.)

