TaNRT2.1-6B is a dual-affinity nitrate transporter contributing to nitrogen uptake in bread wheat under both nitrogen deficiency and sufficiency
Mengjio Li, Tin Wng, Hui Zhng, Shuo Liu, Wenhu Li, Slh F. Aou Elwf, Hui Tin,
a Key Laboratory of Plant Nutrition and Agri-environment in Northwest China, Ministry of Agriculture and Rural Affairs, College of Natural Resources and Environment, Northwest A&F University, Yangling 712100, Shaanxi, China
b Agronomy Department, Faculty of Agriculture, Assiut University, Assiut 71526, Egypt
Keywords:Candidate gene association study Wheat TaNRT2.1-6B Dual-affinity transporter Nitrogen use efficiency
A B S T R A C T Multiple nitrate transporter(NRT)genes exist in the genome of bread wheat,and it is of great importance to identify the elite NRT genes for N-efficient wheat cultivar breeding.A candidate gene association study(CGAS) of six N use efficiency (NUE) related traits (grain N concentration (GNC), straw N concentration(SNC), grain yield (GY), grain N accumulation (GNA), shoot total N accumulation (STN) and N harvest index (NHI)) was performed based on SNPs in 46 NRT2 genes using a panel composed of 286 wheat cultivars. CGAS identified TaNRT2.1-6B as an elite NRT gene that is significantly associated with four (NHI,SNC, GNA and GY) of the six NUE-related traits simultaneously. TaNRT2.1-6B is located on the plasma membrane and acts as a dual-affinity NRT. The overexpression of TaNRT2.1-6B increased the N influx and root growth of wheat,whereas gene silence lines resulted in the opposite effects.The overexpression of TaNRT2.1-6B also improved GY and N accumulation of wheat under either limited or sufficient N conditions. The data provide the TaNRT2.1-6B gene and the two associated SNP markers as promising powerful tools for breeding wheat cultivars with high N uptake ability and NUE.
1. Introduction
Bread wheat(Triticum aestivumL.)is a staple food crop for over one third of the world’s population[1]and wheat production needs to be increased by at least 50% by 2050 to meet the increasing population [2]. Grain yield (GY) of wheat per unit area has been globally increased from 2.97 Mg ha-1to 3.55 Mg ha-1during 2010-2019 [3] and the application of more nitrogen (N) fertilizer contributes tremendously to this increase. Nevertheless, N has been excessively applied in China and some other countries [4],and wheat N fertilizer use efficiency is only about 33%-50% [5].The overuse of N fertilizer also has led to higher environmental loads in wheat production systems [6]. Breeding wheat cultivars with a higher N uptake capacity from the soil is a promising option for improving N fertilizer use efficiency in wheat. Nitrate (NO3-) is the prior form of N source for wheat because the crop is mainly planted in aerobic soils [7]. In higher plants, nitrate is primarily transported by the proteins encoded by four gene families:
NITRATE TRANSPORTER 2(NRT2),NRT1 AND PEPTIDE TRANSPORTER FAMILY(NPF),CHLORIDE CHANNEL(CLC) andSLOW ANION CHANNELS(SLAC/SLAH)[8].In higher plants,SLAC/SLAHare characterized by NO3-/Cl-permeability and appear to be involved in regulating stomatal closure and CLC proteins are NO3-/H+antiporters involved in vacuolar nitrate storage [9].NPFandNRT2gene families play vital roles in mediating N transport from the soil to the plant roots,and thus have great potential for breeding wheat cultivars with higher N uptake ability [10].
There are at least three nitrate transport systems in plants, i.e.the low-affinity transport system (LATS), the high-affinity transport system(HATS)and the dual-affinity transport system(DATS).LATS and HATS mainly mediates nitrate transport under high (>1 mmol L-1NO3-) and low (<1 mmol L-1NO3-) nitrate concentration ranges, respectively; whereas the DATS could mediate nitrate transport under both low and high nitrate concentration ranges[11]. All of the three types of nitrate transporter proteins could be encoded by theNPFfamily genes because their variable affinities are partly determined through posttranslational regulation[12,13], and it is not reliable to predict the affinity of NRTs based on the homology of their amino acid sequences [14]. In addition,proteins encoded byNPFgenes can transport various substrates not only nitrate, such as auxin, peptide and abscisic acids [15].By contrast, proteins encoded by theNRT2gene family genes specifically transport nitrate. With some exceptions, such as AtNRT2.7[16]and OsNRT2.4[17], NRT2 proteins cannot transport nitrate without an auxiliary protein designated NAR2 (nitrate assimilation-related protein, also known as NRT3). One of the important goals for sustainable wheat production is to decrease N fertilizer input without reducing GY. Maintaining or even improving N uptake of wheat under low N fertilizer application is a key target to achieve this goal. Thus, compared to LATS, it seems that HATS has more potential in improving N uptake of wheat under low N supply conditions. The roles of NRT2 proteins in mediating N uptake of plants have been described in a number of previous studies. Overexpression ofOsNRT2.3bin rice enhanced GY and nitrogen use efficiency (NUE) by 40% under both low and high N supply. Moreover, the overexpression lines had improved the phloem sap pH homeostasis for balancing the uptake of NO3-and NH4+, increasing the uptake of N, phosphorus and iron [18].Compared with the wild type (WT), silencing theOsNRT2.3aby RNA interference (RNAi) in rice led to lower plant dry weight and shoot N concentration. Another study indicated thatOsNRT2.3ais involved in long-distance NO3-transport from root to shoot [19].It is common that multipleNRT2genes are found in each plant species, and they may play unequal roles in mediating N uptake.For example, there are sevenNRT2genes inArabidopsis thaliana,from whichAtNRT2.1contributes pivotally to HATS nitrate uptake into roots andAtNRT2.2is a complemental contributor for HATS nitrate uptake whenAtNRT2.1is lost[20].There are 46NRT2genes in the wheat genome [14], however, it is unknown whether multipleNRT2genes play equal roles in mediating N uptake of wheat, or if some dominate acquisition. Thus, it is of great importance to locate the eliteNRT2genes for N-efficient wheat cultivar breeding.
Recently, genome-wide association study (GWAS) has been used to identify QTL or key candidate genes for complex quantitative traits. A total of 333 genomic regions located on all the 21 wheat chromosomes associated with 28 NUE related traits such as harvest index(HI),N harvest index(NHI),plant height and thousand kernel weight were identified in a GWAS using 214 wheat varieties.A number of candidate genes,such as photoperiod sensitive genes, dwarfing genes, NADH-GOGAT genes were identified[21].Moreover,15 NUE-related traits of wheat such as grain N concentration (GNC), yield, N uptake efficiency, N remobilization efficiency associated with 16 genomic regions located on ten chromosomes were identified; andglutamine synthetaseandrubiscogenes were identified as candidate genes [22]. Nevertheless,NPForNRT2genes have been rarely identified during GWAS in wheat so far,and this may be because(1)GWAS typically selected the top-ranked markers according to the effect values possibly overlooking many biologically-significant SNPs or genes with small effects associated with the target traits [23]; and (2) the wheat populations used in GWAS usually differ greatly in their agronomical traits such as plant height, tiller and spike characteristics,which may also influence NUE in wheat. In rice, GWAS targeted on NUE-related traits identified a NPF transporter [24]. TheNPFandNRT2gene-related SNPs may have an important contribution to NUE in wheat although such SNPs have been rarely reported in wheat GWAS. Candidate gene association study (CGAS), which is based on polymorphisms in selected candidate genes related to target traits,reduces the target range and can identify target genes more effectively and accurately [25], and has an increased likelihood of finding meaningful trait associations [26]. CGAS method has been successfully applied to many plant species such as Arabidopsis [25], wheat [27], maize (Zea maysL.) [28] and rice (OryzasativaL.)[29].For wheat,based on 167 SNPs of 51 candidate genes related with wheat grain storage protein, the genesDREB1-B,NAC22-B,DOF19-B,FdGOGAT-BandMCB1-Aare found to be associated with grain N accumulation (GNA) and the quantity of grain storage protein[30].Another study found that 17 genes are associated with the pathogenicity ofFusariumand the production of mycotoxins in wheat [31]. Recently, we found that natural variations inNRT2genes led to significant differences in wheat NUE[14].Nevertheless,a CGAS has not been conducted on the polymorphisms ofNRT2genes in wheat,and eliteNRT2genes have not been identified.
In the present study, a CGAS was conducted based on SNP polymorphism of 46NRT2genes in the wheat genome by using a structured population composed of 286 wheat cultivars. Multiple NUE-related traits were simultaneously associated with two SNPs,which are located in the CDS and regulation region of the geneTraesCS6B02G044300. This gene was previously designated asTaNRT2.1-6B, and has been hypothesized as a high-affinity nitrate transporter gene [32]. This gene is mainly expressed in roots, and the expression can be induced by nitrate supply and can be regulated by a NAC transcription factor (TaNAC2-5A) [32]. However,the nitrate transport activity of TaNRT2.1-6B has not been fully characterized, and the roles of this gene in mediating N uptake of wheat are largely unknown.We characterized the nitrate transport activity of TaNRT2.1-6B via a heterologous expression system and complemented lines generated from the Arabidopsisatnpf6.3(also named asAtNRT1.1) mutant. We also investigated the influence of gene silencing and overexpression ofTaNRT2.1-6Bon N uptake in wheat. The present study tested three hypotheses: (1) eliteNRT2genes could be localized in the wheat genome via CGAS targeting on NUE related traits; (2) TaNRT2.1-6B is located on the plasma membrane, and acts as a high-affinity nitrate transporter, which mainly transports nitrate under low nitrate concentrations; and(3) the overexpression ofTaNRT2.1-6Bcould improve N uptake of wheat and silencing the gene decreases N uptake under Nlimited conditions.
2. Materials and methods
2.1. Plant materials and phenotypic evaluation
A panel of 286 diverse wheat cultivars and landraces was used for CGAS. In this panel, the wheat cultivars with different plant heights were released from the 1950s to 2010s, and originated from different wheat production regions of the world in particular Asia (Table S1). Wheat plants were grown in a chamber enclosed with a screen net in the Northwest A&F University(NWAFU), Yangling (34°27′N, 108°07′E), Shaanxi province, China,from October 2018 to June 2019. The soil was collected from an experimental station of the NWAFU in Yangling where N fertilizer has not been applied for many years. The basic physical and chemical characteristics of the experimental soil were given in Li et al. [33]. Ten wheat seeds were planted in a pot (about 2.5 L in volume) filled with approximately 2.5 kg soil. The plants were thinned to four plants per pot 10 days after germination.There were three biological replications for each variety. Wheat plants were watered when necessary. At maturation stage, grain,straw and glume were harvested separately. All the three parts were oven-dried and weighed. The oven-dried grain, shoot and glume were milled into powder using a grinding mill (MM410,Retsch, Haan, Germany), and were digested with H2SO4-H2O2[34]. Grain, straw and glume N concentration in the digestion solution was determined using the colorimetric method with a continuous flow analytical system (AA3, SEAL Company, Norderstedt, Germany) [35]. GY, GNC, GNA, straw N concentration(SNC), shoot total N accumulation (STN) and NHI (calculated as grain N content/shoot total N content) were measured or calculated for CGAS.
2.2. Candidate gene association analysis
Genotyping of the wheat panel was conducted with the wheat 660K Axiom Array[36]at CapitalBio.Technology, Beijing,China.A total number of 46NRT2genes were previously identified [14].SNPs located to the genomic region from 2000 bp upstream to 2000 bp downstream of eachNRT2gene were employed for CGAS.A total of 170 effective SNPs was finally employed for association analysis between SNP markers of the 46NRTgenes with six phenotypic traits (GNC, SNC, GY, GNA, STN and NHI) using the Tassel 5.0 software [37] with a general linear model and a kinship matrix (K) correction for relatedness. K was estimated using 16,043 markers in Tassel 5.0. The quantile-quantile (QQ) plots displayed the -log10(P-value) of each SNP and the expectedPvalue, and were constructed using CMplot software (https://github.com/YinLiLin/CMplot). The threshold value of the association analysis was set toP= 1/Ne, whereNeis the total SNPs(170 markers in the present study), with a corresponding -log10(P-value) of 2.23 [38].
2.3. Subcellular localization of TaNRT2.1-6B
The complete coding sequences ofTaNRT2.1-6Bwas amplified by reverse transcription polymerase chain reaction (RT-PCR)using the forward primer 5′-TACCATCAGCCCAGAGGATCATG GAGGTGGAGGCCAGC-3′and the reverse primer 5′-GCCCTTGCTC ACCATGGATCCTACGTGCTGGGGTGTGTTGTT-3′. The amplified cDNA was inserted into theBamHI site of the pGL486-GFP vector to construct a35S::TaNRT2.1-6B:eGFPfusion protein. The Arabidopsis protoplasts were isolated from leaves of 3-4-week-old plants by enzymatic treatment [39]. GFP-fused plasmids were transiently transformed to the Arabidopsis protoplasts by DNA-PEG-calcium transfection method. After transformation,protoplasts were incubated for 16 h at room temperature in W5 solution and then observed using a confocal laser scanning microscope (Leica TCS SP8, Weztlar, Germany). Protoplasts transformed with AtH+-ATPase were used as a plasma membrane marker [40].
2.4. Cloning and cRNA synthesis of TaNRT2.1-6B and nitrate uptake assay in the oocytes of Xenopus laevis
The coding sequence ofTaNRT2.1-6Bwas cloned and then subcloned into the oocyte expression vector pNB1 as described in[41].The constructed vectors were linearized with theNotI restriction endonuclease, and the corresponding cRNA was in vitro synthesized in vitro using a T7 RNA production kit (Promega, Madison,WI, USA). Oocytes preparation and injection were conducted as described previously [14,42,43]. The uptake of15NO3-by the oocytes was measured as described in [42]. Oocytes injected withAtNPF6.3cRNA were used as a positive control.
To evaluate the affinity of TaNRT2.1-6B for nitrate, N uptake kinetic experiments were conducted.TaNRT2.1-6BcRNAinjected oocytes were incubated in solutions containing different concentrations of15N-NO3-(ranging from 50 μmol L-1to 30 mmol L-1for the kinetic study) for 2.5 h at a pH of 5.5, dried at 65 °C for one week. The15N/14N ratio of the single dried oocytes was measured as described in [14]. The kinetic constants(Km) value was calculated by fitting to the Michaelis-Menten equation using a nonlinear least-squares method in the Origin 2021 software.
2.5. Nitrate uptake complementation of the Arabidopsis atnpf6.3 mutant
The coding sequence ofTaNRT2.1-6Bwas amplified as described above. Considering the heterologous expression experiments indicated that TaNRT2.1-6B acts as a dual-affinity nitrate transporter,the Arabidopsis T-DNA mutantnpf6.3(SALK_097431) obtained from the Arabidopsis Biological Resource Center was employed for complementation analysis. This mutant is loss of function of AtNPF6.3, which is a dual-affinity nitrate transporter in Arabidopsis. Transgenic plants were constructed by introducingTaNRT2.1-6Bdriven by theCauliflower mosaic virus(CaMV)35S promoter into theatnpf6.3mutant using theAgrobacterium tumefaciens(strain GV3101)-mediated floral dip method [44].
Homozygote seeds of transgenic Arabidopsis were surface sterilized and sown on solid half-strength MS medium at 23 °C under long-day conditions of 16 h light/8h dark for four weeks. After 4 days starvation on N-free MS medium, seedlings were transferred into 0.25 mmol L-1or 5 mmol L-115N-NO3-solution for 15 min. The plants were five times washed with a 0.2 mmol L-1CaSO4and then dried at 65 °C to a constant weight. The15N/14N ratio of tissue was measured using an isotope ratio mass spectrometer(DELTA V Advantage,Bremen,Germany).Five biological replications were used.15N influx rate was calculated as total15N uptake/plant root dry weight.
To investigate the influence of the overexpression of the gene on the development of plant roots,seeds of transgenic Arabidopsis were surface sterilized and sown on a solid medium containing 0.25 mmol L-1NO3-or 5 mmol L-1NO3-and the plates were vertically incubated in a growth chamber at 23°C under long-day conditions of 16 h light/8h dark for three weeks. Seedling roots were scanned with EPSON Flatbed Scanner Epson Perfection V700/V750 (Seiko Epson, Tokyo, Japan) and analyzed with WinRHIZO software (Regent Instruments Inc., Québec, Canada).
2.6. Virus-induced gene silencing (VIGS) assay
Total RNA was extracted from wheat root tissues using the RNAprep pure Plant Kit (Tiangen Biotech (Beijing) Co., Ltd.,Beijing, China). siRNA was designed using si-Fi software [45], and a 392 bp fragment ofTaNRT2.1-6Bwhich targets all the three homologous genes (TaNRT2.1-6B,TraesCS6A02G030900, andTraesCS6D02G035800) in the A, B and D subgenome of wheat was amplified by PCR using the forward primer 5′-TTAATTAATCAG CACCCACTGTGTTTTG-3′and the reverse primer 5′-GCGGCCGCAA TTTGTCCTTGGCCATGTC-3′from the cDNA of wheat.PacI andNotI restriction sites were introduced to the forward and reverse primers, respectively, into each primer. The amplified fragment was cloned into the γ-subunit of aBarley stripe mosaic virus(BSMV)vector. Mixture ofAgrobacteriumcontaining BSMV-γ-TaNRT2.1-6B, BSMV-α and BSMV-β vectors was injected into the 30-daysold tobacco (Nicotiana benthamiana) seedling leaves. After infiltration,the tobacco plants were cultured in a growth chamber for 15 days (23 °C and 18 h light). The infiltrated leaves were harvested and stored under -80 °C until be used for inoculation [46].
To investigate the influence of VIGS on N uptake in wheat plants, a hydroponic experiment was designed. Two VIGS treatments were established:(1) empty vector(EV), the BSMV without the siRNA fragment was inoculated; and (2) VIGS, the constructed BSMV was inoculated to leaves of wheat at the 2-leaf stage. For inoculation,the infiltrated tobacco leaves were ground in 20 mmol L-1Na-phosphate buffer(pH 7.2)containing 1%celite,and the sap was mechanically inoculated onto wheat leaves [47]. All wheat plants were treated with 0.2 mmol L-1CaSO4for 48 h at 21 days post inoculation(dpi),and roots of three plants of each VIGS treatment were sampled for RNA extraction.Gene expression level was quantified using reverse transcription real-time quantitative PCR(RT-qPCR) as described previously [48]. The primers used for RT-qPCR are described in Li et al. [49]. To investigate the influence of VIGS on the expression of otherNRT2genes,sixNRT2genes (TraesCS6A02G032400,TraesCS6A02G033000,TraesCS6B02G045700,TraesCS6B02G046700,TraesCS6D02G037200,andTraesCS6D02G038200) were randomly selected for RT-qPCR,and the designed primers were shown in Table S2. Five wheat plants of each VIGS treatment were then put in the modified Hoagland nutrient solution with low (0.1 mmol L-1) and high(10.0 mmol L-1)15N-NO3-concentrations for 5 min. Shoots and roots were sampled, washed with distilled water for five times to remove the residue of15NO3-, oven-dried and grounded for N concentration measurement. The enrichment of15N in the wheat tissue was measured using a stable isotope mass spectrometer(DELTA V Advantage, Germany).
2.7. Overexpression of TaNRT2.1-6B in wheat
The wheat cultivar ‘Fielder’ was used as wild-type (WT) in the overexpression assay. The transgenic plants were constructed by introducing theTaNRT2.1-6BCDS region driven by the 35S promoter into the WT. The construct was transformed into immature embryos of Fielder viaAgrobacteriuminfection.Three independentTaNRT2.1-6Boverexpression lines (OE4, OE12 and OE39) were obtained from the T3generation of positive lines.
A hydroponic experiment was carried out to investigate N influx rate in the WT andTaNRT2.1-6Boverexpression lines.Wheat seeds were germinated in the culture medium for four weeks. Roots of the seedlings were washed with ddH2O. Roots and shoots harvested separately for RT- qPCR. Total RNA from plant tissues was extracted with the RNAprep Pure Plant Kit (Tiangen), and the first-strand complementary DNA was synthesized with the FastKing RT Kit(Tiangen).The RT-qPCR analysis was performed with QuantStudio5(Life Technologies,Carlsbad,CA,USA)using SuperReal PreMix Color (SYBR Green) (Tiangen). The primers used for RT-qPCR are described in [49].
Wheat seeds were germinated in the culture medium for four weeks. Roots of the seedlings were washed with 0.2 mmol L-1CaSO4and treated with 0.2 mmol L-1CaSO4for two days.The seedlings were transferred into 0.25 mmol L-1or 5 mmol L-115N-NO3-for 15 min. The plants were five times washed with 0.2 mmol L-1CaSO4and then dried at 65 °C to a constant weight. The15N/14N ratio of the plant tissue was measured using an isotope ratio mass spectrometer (DELTA V Advantage).
A greenhouse experiment was conducted to investigate the influence of gene overexpression on growth, yield and N uptake of wheat. A high N (0.4 g urea kg-1soil) and low N (0 g N kg-1soil) treatments were set up. There were five replicates for each treatment. The basic fertility characteristics of soil were as follows: pH 7.43, nitrate 4.25 mg kg-1, ammonium 0.52 mg kg-1,available phosphorus (P) (Olsen-P) 11.35 mg kg-1, available potassium (K) 92.35 mg kg-1, and organic matter 6.68 g kg-1.The fertilizer was thoroughly mixed into the soil prior to sowing.The seeds of the WT and the transgenic lines were germinated at 20 °C for four weeks. Only one germinated seedling was planted in each plastic pot (about 2.5 L in volume) containing 2.5 kg of soil. SPAD values, leaf length and leaf width were measured at heading, flowering and grain filling stages. SPAD values were measured using a portable chlorophyll meter(TYS-4 N,Hangzhou,Zhejiang, China). Plant height was measured at the jointing and maturation stages. Spike number, grain number per spike, root biomass, shoot biomass, GY, thousand kernel weight (TKW) and N concentration and content were measured at the maturity stage. N concentration in the grain, straw, and glume was measured as described above.
2.8. Statistical analysis
The correlation among traits were performed by correlation plot in the ORIGIN 2021 software.Normal distribution of the traits was tested by the Kolmogorov-Smirnov method in the ORIGIN 2021 software. Data were analyzed by multiple comparisons of one-way ANOVA using the LSD test at theP<0.05 level with DPS software [50].
3. Results
3.1.TaNRT2.1-6B was significantly associated with four of the six NUE related traits of wheat
GNC, SNC, GY, GNA, STN and NHI of the 286 wheat cultivars mainly ranged from 17.1 to 32.1 g kg-1, 1.6 to 8.5 g kg-1, 0.9 to 4.1 g plant-1, 21.4 to 101.5 mg plant-1, 27.5 to 125.2 mg plant-1and 0.71 to 0.91 (outliers in the box figures were ignored), respectively (Fig. S1). Except for SNC, all measured NUE-related traits were shown to be normally distributed. GY was negatively correlated with GNC and SNC, but was positively correlated with GNA, STN, and NHI.GNC was positively correlated with SNC and NHI, but was not correlated with GNA and STN.SNC was negatively correlated with GNA, STN, and NHI. GNA was positively correlated with NHI and STN. STN was not correlated with NHI (Fig. S1).
The CGAS showed that five SNPs, i.e., AX-94951781, AX-94980898, AX-108968133, AX-89402933, and AX-86179072,significantly associated with all the six traits except for GNC.The overall false-positive rate of CGAS was properly controlled except GNC as revealed by QQ plot (Fig. 1a). The SNP markers AX-94951781 and AX-94980898, which were located at the downstream ofTraesCS6B02G044000and within the CDS region ofTraesCS6B02G044300, respectively, exhibited significant association with NHI (Fig. 1b).The SNP marker AX-108968133,which was located at the downstream of theTraesCS6D02G037300, was significantly associated with GNA and STN (Fig. 1b). The SNP marker AX-89402933, located within the CDS region of theTraesCS6A02G032800, exhibited significant association with STN, GNA, and GY (Fig. 1b). The SNP marker AX-86179072 located downstream theTraesCS6B02G044300revealed a significant association with SNC, GNA, and GY (Fig. 1b). The two SNP markers AX-86179072 and AX-94980898 that are closely linked to the geneTraesCS6B02G044300exhibited significant association with four(NHI, SNC, GNA, and GY) of the six NUE-related traits. The geneTraesCS6B02G044300has been previously identified and designated asTaNRT2.1-6B[32].
The SNP marker AX-94980898 in the wheat panel is A/G mutation. The haplotype A includes 269 cultivars, whereas the haplotype G includes 17 cultivars. Compared to the haplotype A, the haplotype G exhibited higher SNC and lower NHI values.Meanwhile, the other four traits (GY, GNC, GNA, and STN) did not differ significantly between the two haplotypes (Fig. 1c).The SNP marker AX-86179072 is C/T mutation in the wheat panel. Compared with the haplotype C (comprises 271 cultivars),the haplotype T (comprises 15 cultivars) revealed lower NHI and GY, but had higher GNC and SNC values. The two haplotypes revealed similar GNA and STN values (Fig. 1d). Thus, it seems that the SNP marker AX-86179072, which is located at the regulation region (41 bp far downstream from the termination codon of the geneTaNRT2.1-6B) of the geneTaNRT2.1-6B, might play more important roles in influencing yield or N uptake of wheat compared to the synonymous mutation SNP marker AX-94980898.
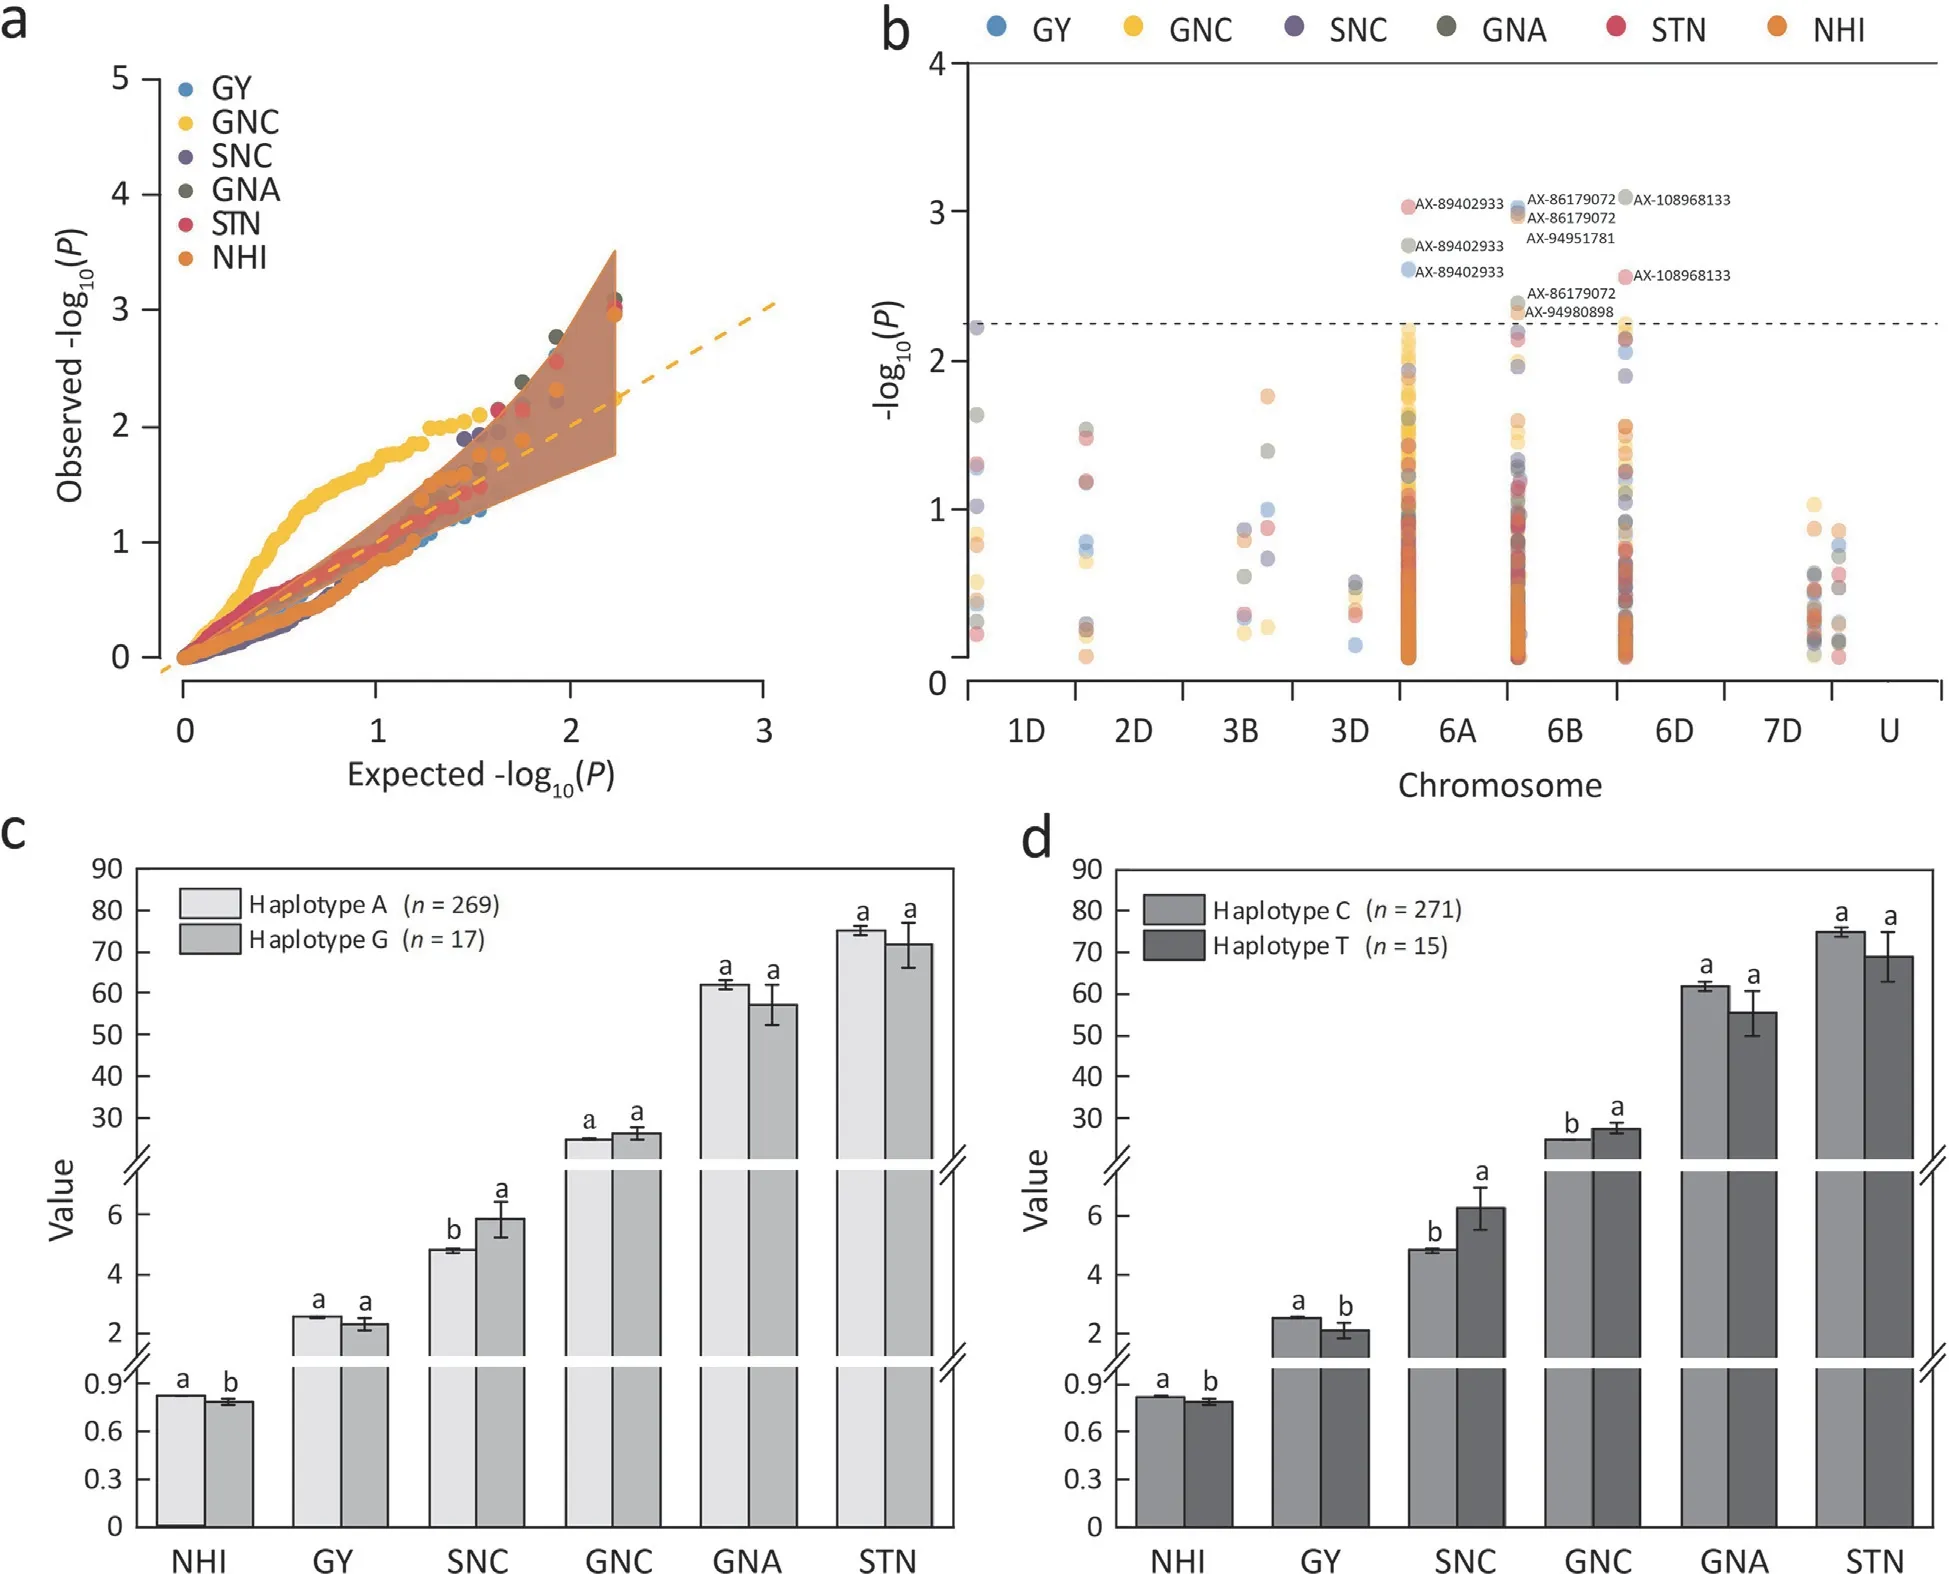
Fig.1. Quantile-quantile plots(a),Manhattan plot(b),and the six traits(GY,GNC,SNC,GNA,STN and NHI)in different subpopulations classified based on the SNP markers AX-94980898(c)and AX-86179072(d).GY,grain yield(g plant-1);GNC,grain N concentration(g kg-1);SNC,straw N concentration(g kg-1);GNA,grain N accumulation(mg plant-1); STN, shoot total N accumulation (mg plant-1); NHI, N harvest index. Different letters on bars mean significant difference among treatments at P <0.05.
3.2. TaNRT2.1-6B is located to the plasma membrane and acts as a dual-affinity nitrate transporter
The 1524 bp full-length coding sequence of theTaNRT2.1-6Bgene encodes 507 amino acids with 10 putative transmembrane domains (Fig. S2). The gene contains no intron in the DNA sequence, and also has no splice variants. It has two homologous genes located on the 6A (TraesCS6A02G030900,TaNRT2.1-6A) and 6D (TraesCS6D02G035800,TaNRT2.1-6D) chromosomes. On the 6B chromosome, there are other fourNRT2genes that formed a tandem repeat event withTaNRT2.1-6Bwith 83% identity in amino acid sequences[14].The gene is an orthologue ofHvNRT2.1,which has been proved to be a high-affinity nitrate transporter in barley[51].
To determine the subcellular localization of TaNRT2.1-6B,enhanced green fluorescent protein (eGFP) fused with TaNRT2.1-6B was transiently expressed in Arabidopsis protoplasts by CaMV 35S promoter. The green fluorescence of TaNRT2.1-6B: eGFP was observed at the protoplast plasma membrane and co-localized with a plasma membrane maker AtH+-ATPase gene (Fig. 2a), confirming that TaNRT2.1-6B was a plasma membrane-localized transporter.
To test whether TaNRT2.1-6B acts as a high-affinity, lowaffinity or dual-affinity nitrate transporter, it was heterologously expressed inXenopusoocytes, and its nitrate transport activity was investigated under both low and high nitrate concentrations. AtNPF6.3 was selected as a positive control in the heterologous expression experiment because it transports nitrate under both low and high nitrate concentrations. The oocytes injected with the cRNAs ofTaNRT2.1-6BandAtNPF6.3presented higher15N abundance than the oocytes injected with DEPC-treated water (negative control) under both 0.25 mmol L-1and 10 mmol L-115N-NO3-solutions, suggesting that TaNRT2.1-6B can transport nitrate independently under both low and high NO3-concentrations. The15N abundance of the oocytes injected with the cRNAs ofTaNRT2.1-6Bdid not significantly differ from that injected with the cRNAs ofAtNPF6.3,suggesting that the two nitrate transporters have similar levels of expression and nitrate transport activity. In addition, similar toAtNPF6.3, TaNRT2.1-6B was also a proton-coupled transporter because of the higher nitrate uptake at pH 5.5 when compared with pH 7.4 (Fig. 2b).
To further determine the affinity of TaNRT2.1-6B, the nitrate uptake assays were performed by using isotopically enriched15NO3-in both micro- and millimolar concentration ranges. The NO3-accumulation curves were fitted by the Michaelis-Menten equation and theKmvalue of TaNRT2.1-6B was 0.36 ± 0.1 mmol L-1and 20.5 ± 3.3 mmol L-1under the low- and high-affinity NO3-uptake, respectively (Fig. 2c). Thus, TaNRT2.1-6B acts as a dual-affinity nitrate transporter in wheat.
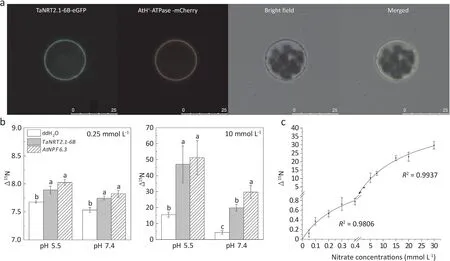
Fig. 2. Subcellular localization and nitrate uptake activity of TaNRT2.1-6B in oocytes. (a) The four pictures showed TaNRT2.1-6B fluorescence image, plasma membrane marker AtH+-ATPase image, bright-field image and overlapping image of GFP (green) and plasma membrane marker (red) fluorescence, respectively. Scale bar, 25 μm. (b)Nitrate uptake activity of TaNRT2.1-6B under different nitrate concentrations(0.25 mmol L-1 and 10 mmol L-1)and pH by heterologous expression system.ddH2O,oocytes injected with DEPC-treated H2O (negative control); TaNRT2.1-6B, oocytes injected with cRNA of TaNRT2.1-6B; AtNPF6.3, oocytes injected with cRNA of AtNPF6.3 (positive control).(c) Kinetic analysis of nitrate uptake in TaNRT2.1-6B-injected oocytes under low-(0-0.5 mmol L-1)and high-affinity concentration range(1-30 mmol L-1). The Km was calculated by fitting to the Michaelis-Menten equation using a nonlinear least-squares method in the ORIGIN 2021 software. Different letters on columns mean significant differences among treatments at P <0.05. values are means ± standard errors (n = 8).
3.3. TaNRT2.1-6B complements the npf6.3 mutation and improves Arabidopsis root growth
Considering that TaNRT2.1-6B acts as a dual-affinity nitrate transporter, a mutant of a dual-affinity nitrate transporter(AtNPF6.3/AtNRT1.1) was used in the complementation analysis.The expression ofTaNRT2.1-6Bwas detected in the three generated complemented Arabidopsis lines (Com 5, Com 7 and Com 12), but was not detected either in the mutant and WT plants (Fig. 3a). In comparison with the mutant plant, the35S:TaNRT2.1-6Bcomplemented lines exhibited higher total15N uptake or15N influx rate under both 0.25 mmol L-1and 5 mmol L-115NO3-concentrations(Fig. 3b, c).
In comparison with theatnpf6.3mutant, the35S:TaNRT2.1-6Bcomplemented lines resulted in a significant increase of dry weight, total root length, forks and surface area when exposed to both low (0.25 mmol L-1; Fig. 4a-e and high (5 mmol L-1;Fig. 4g-k) NO3-concentrations. The35S:TaNRT2.1-6Bcomplemented lines also exhibited more root tips especially under the 5 mmol L-1NO3-concentration and higher root volume especially under 0.25 mmol L-1NO3-concentration (Fig. 4d, j and f).
3.4.Silencing and overexpression of TaNRT2.1-6B significantly altered N influx in wheat under both low and high NO3- supply
To evaluate the roles ofTaNRT2.1-6Bin N uptake in wheat, we constructedTaNRT2.1-6Bsilencing(VIGS)and overexpression lines.Compared to the EV treatment, VIGS significantly decreased the expression ofTaNRT2.1-6Bin the roots of wheat 21 dpi (Fig. 5a),and VIGS did not influence the expression of otherNRT2genes in wheat roots (Fig. S3). Moreover, VIGS significantly decreased15N accumulation and15N influx rate in wheat under both 0.1 mmol L-1and 10 mmol L-115NO3-supply(Fig.5b,c).The three independent overexpression lines (OE4, OE12, and OE39) exhibited significantly higher gene expression levels in both shoots and roots compared to the WT plants (Fig. 5d). Compared to the WT, all the three overexpression lines revealed higher15N accumulation and15N influx rate under both 0.25 mmol L-1and 5 mmol L-115NO3-concentrations (Fig. 5e, f).
OE12 and OE39 significantly increased the total root length,the number of root tips and forks, root surface area and root volume under both 0.25 mmol L-1and 5 mmol L-1nitrate concentrations. OE4 showed lower efficient in improving root growth parameters compared to OE12 or OE39, however, all the root growth parameters tended to be higher in OE4 plants than that in WT plants (Fig. 6c-f, j-l). All the three gene overexpression lines showed better root growth than the WT(Fig. 6a, b, g and h).
3.5. TaNRT2. 1-6B overexpression promotes shoot biomass, GY and N uptake in wheat
Compared to the WT,TaNRT2.1-6Boverexpression lines showed improved plant height, leaf length and SPAD values at the heading and flowering stages under both the low (Fig. 7a-e)and high N treatments (Fig. 7g-k). However, the leaf width was improved only under low N supply at the heading and grain filling stages (Fig. 7f, l).
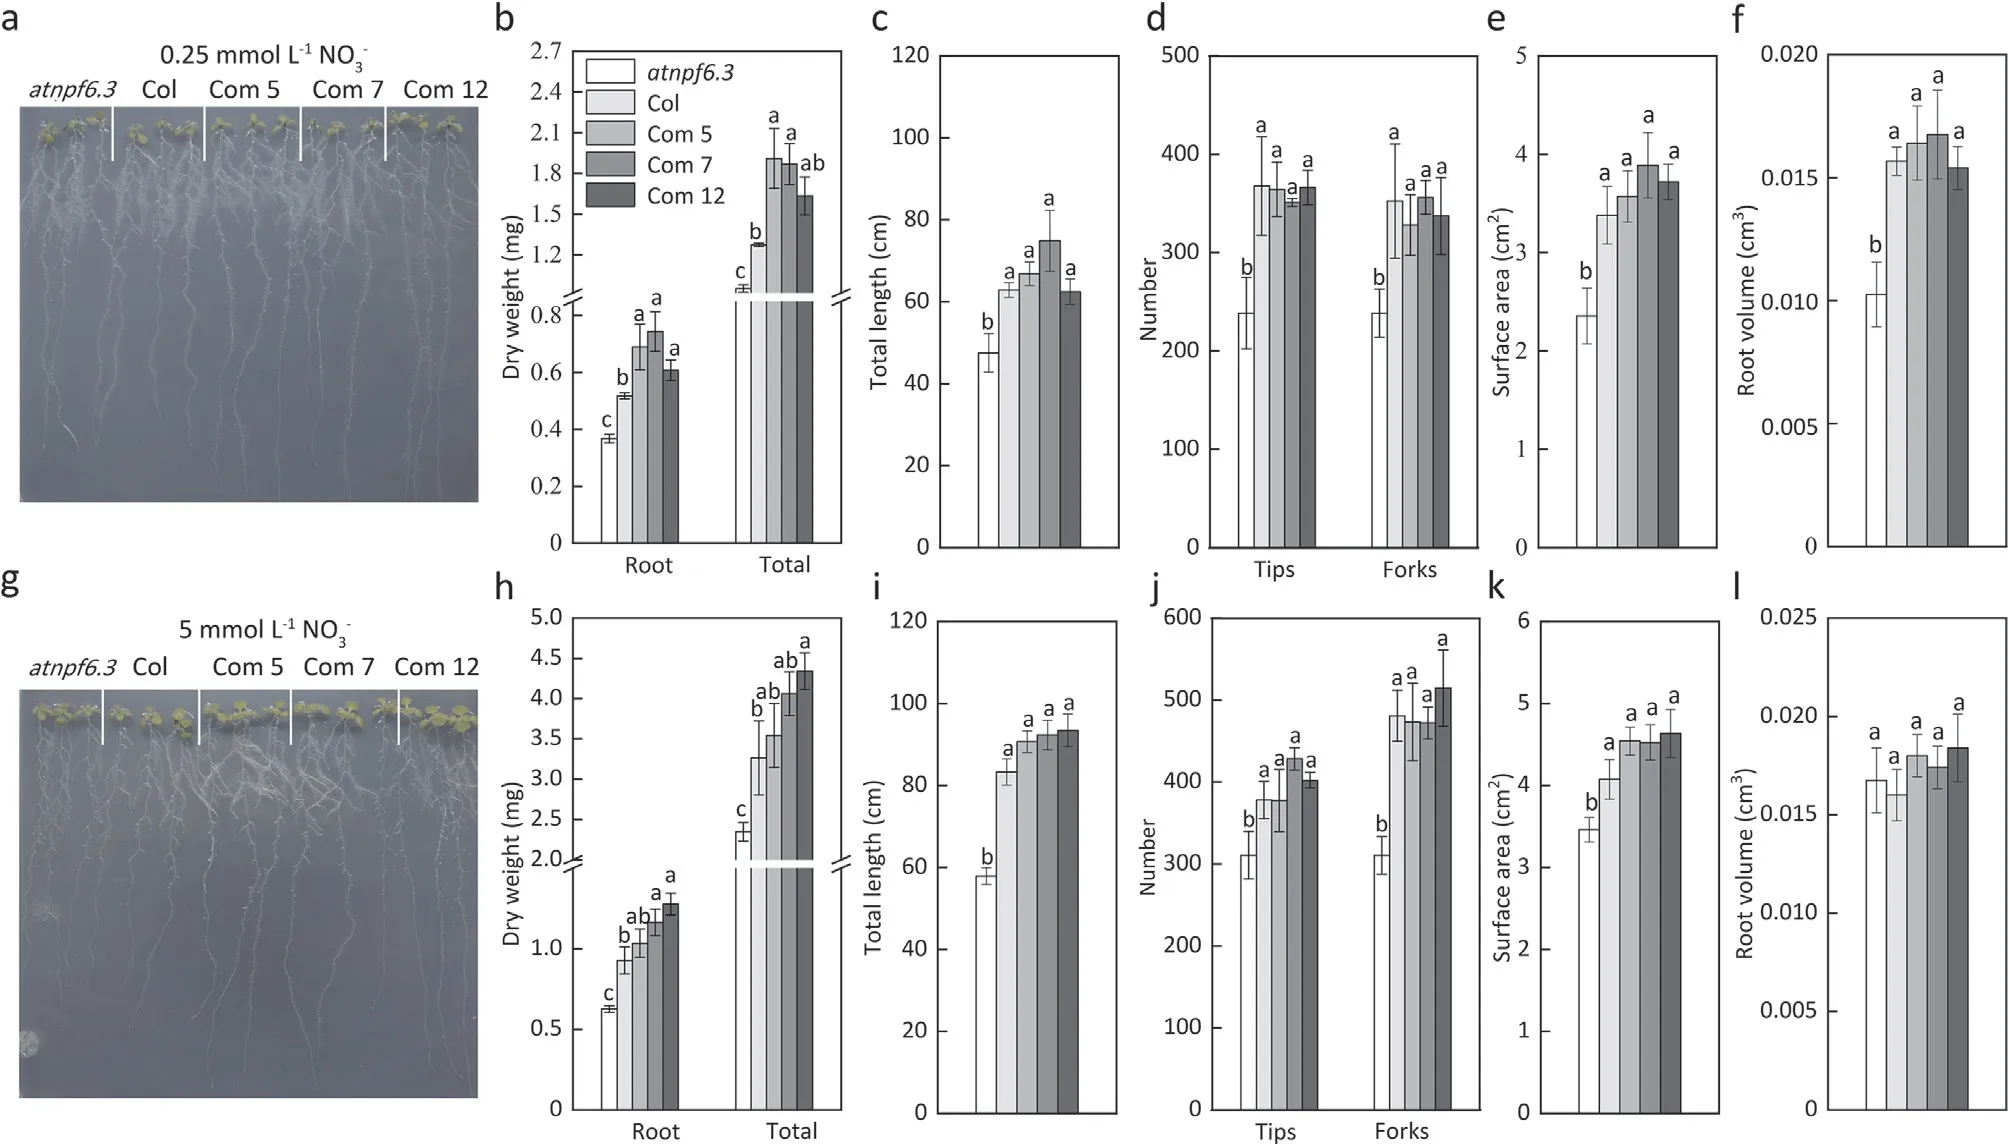
Fig. 4. Growth of Arabidopsis, dry weight, root length, number of root tips and forks, root surface area and root volume of the mutant (atnpf6.3), wild type (Col) and complemented lines (Com 5, Com 7, and Com 12) under 0.25 mmol L-1 (a-f) and 5 mmol L-1 nitrate supply (g-l). Error bars indicate ± standard errors (n = 5).
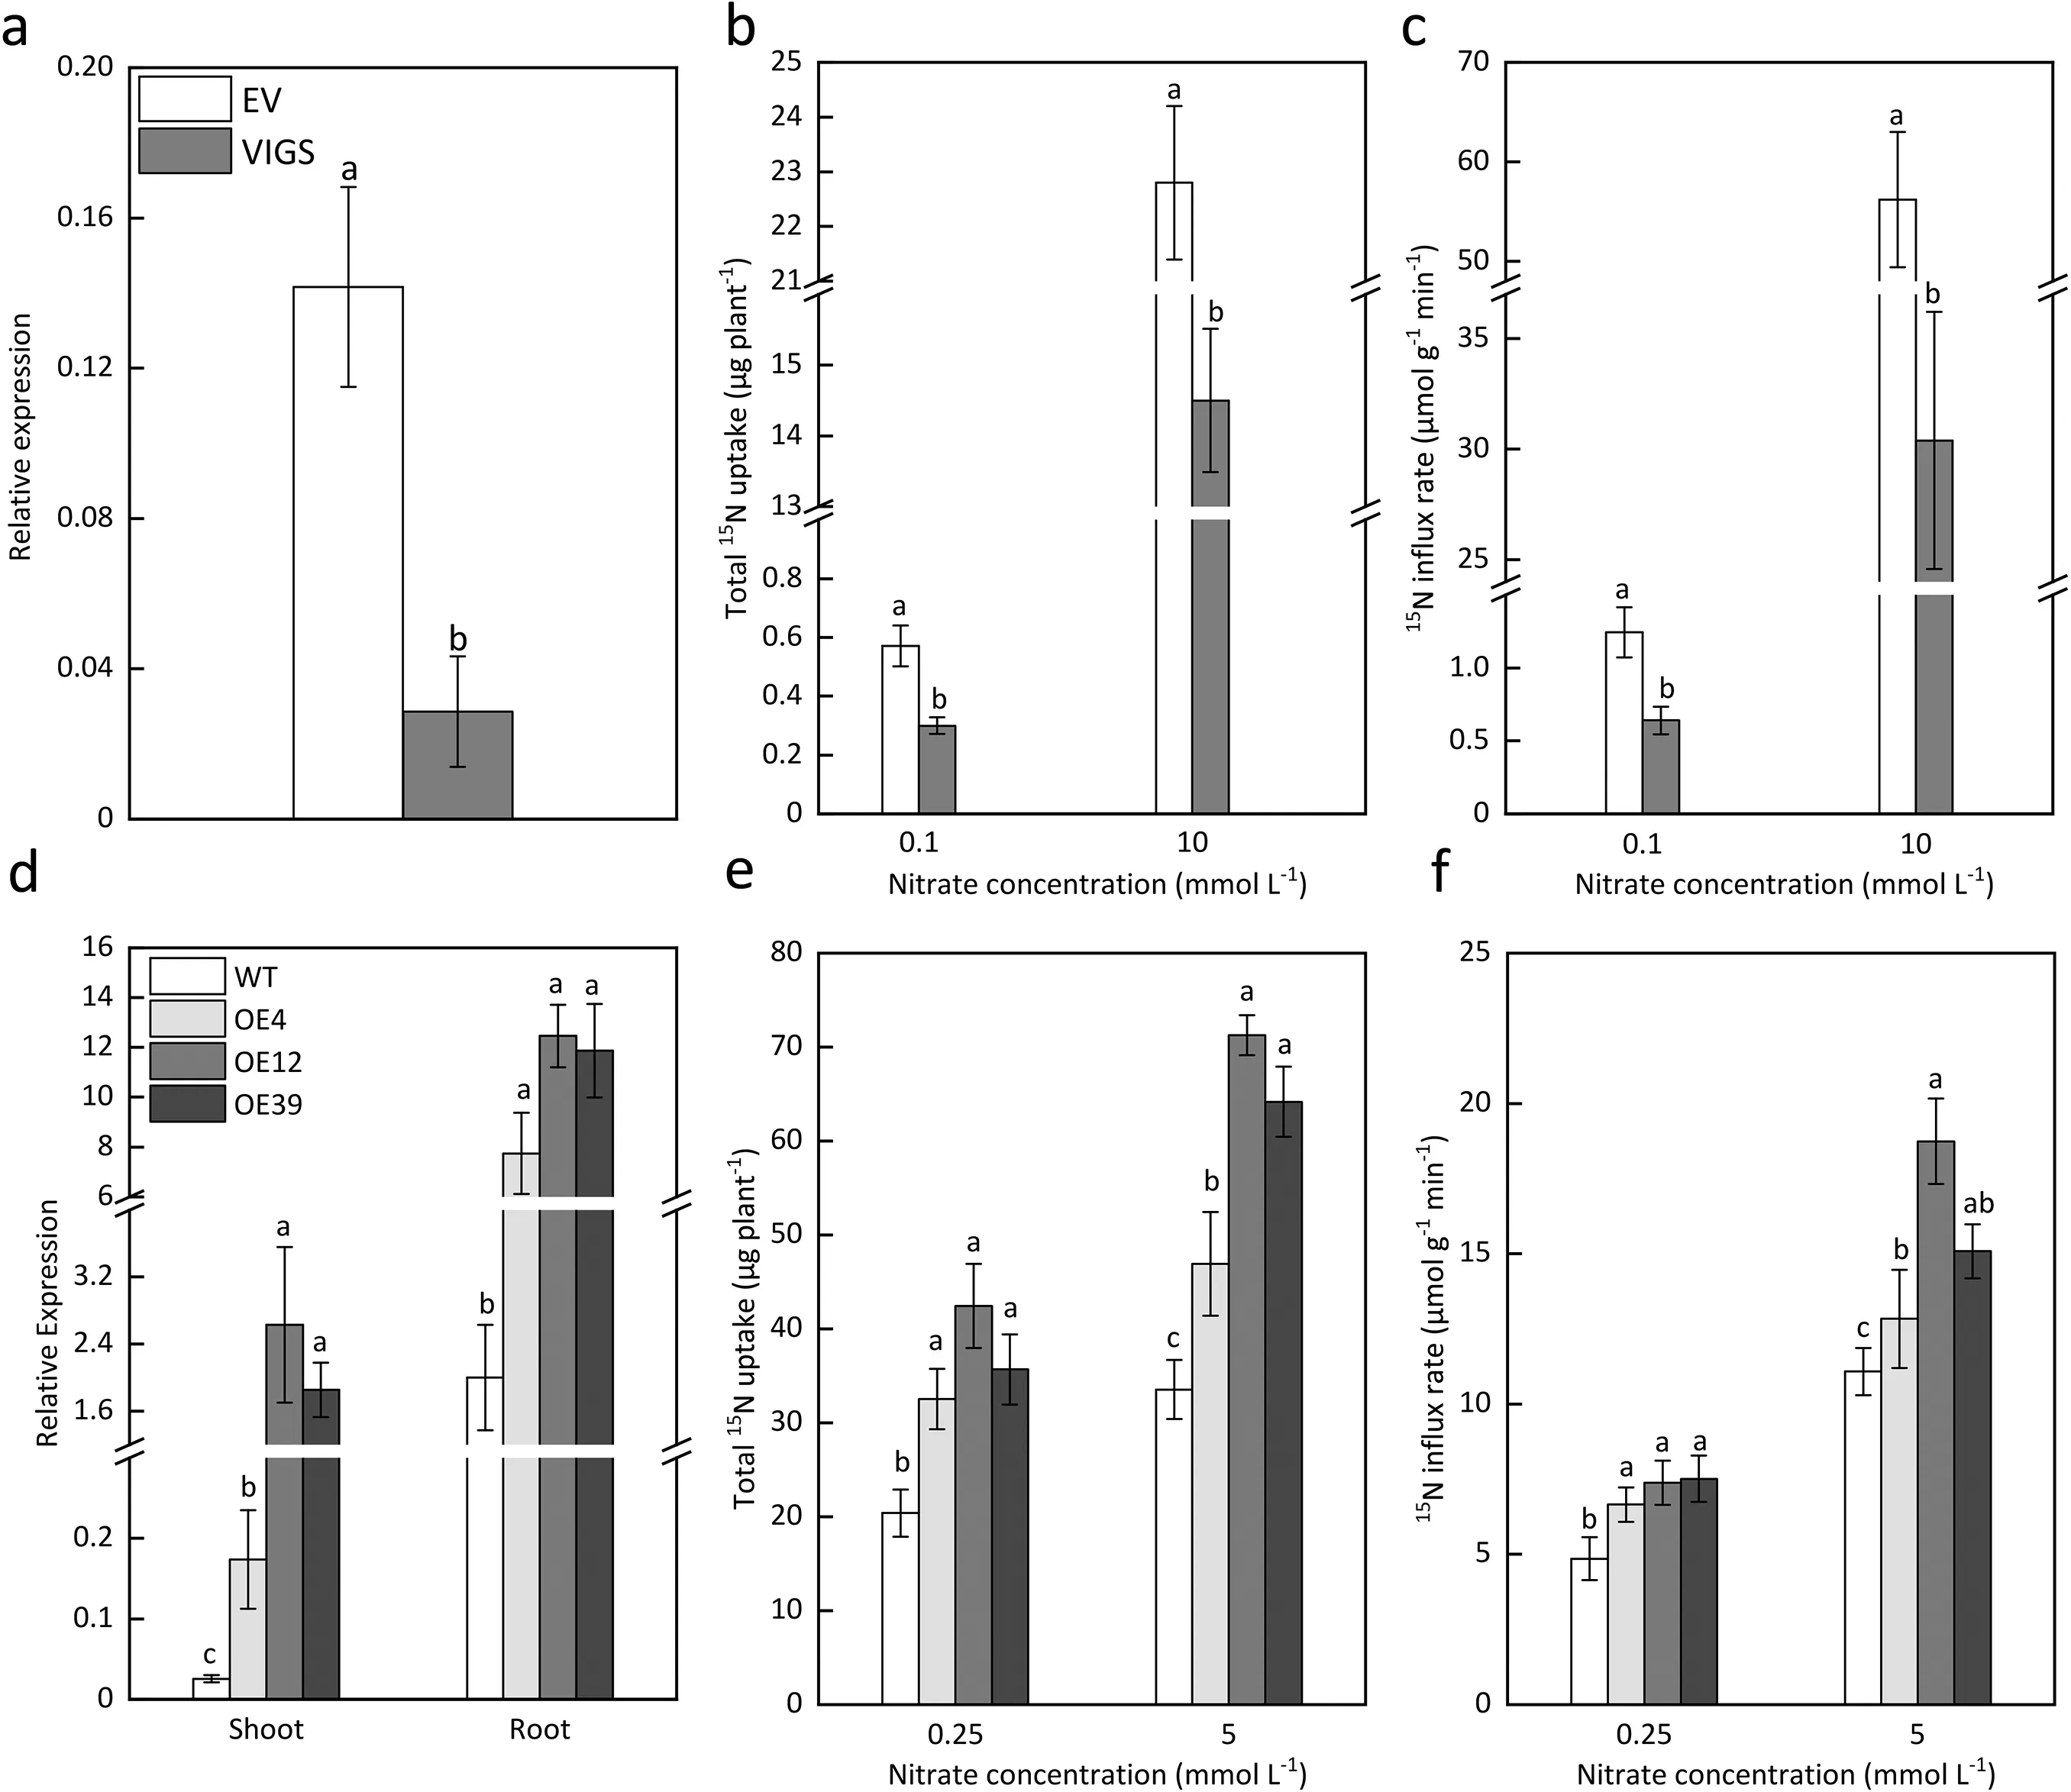
Fig. 5. Influence of VIGS and overexpression on TaNRT2.1-6B expression, N uptake and nitrate influx of wheat. (a) Expression level of TaNRT2.1-6B under EV and VIGS treatment 21 days after inoculation; (b, c) Total 15N accumulation and 15N influx of wheat under EV and VIGS treatment 21 days after inoculation at 0.1 mmol L-1 or 10.0 mmol L-1 nitrate concentration.(d)Expression level of TaNRT2.1-6B in the roots and shoots of the wild type(WT)and TaNRT2.1-6B overexpression lines(OE4,OE12 and OE39);(e,f)Total 15N accumulation and 15N influx of the wild type and TaNRT2.1-6B overexpression lines under 0.25 mmol L-1 or 5.0 mmol L-1 nitrate concentration.Values are means and standard errors. Different letters on the bars are significantly different among treatments at P <0.05 (n = 3).
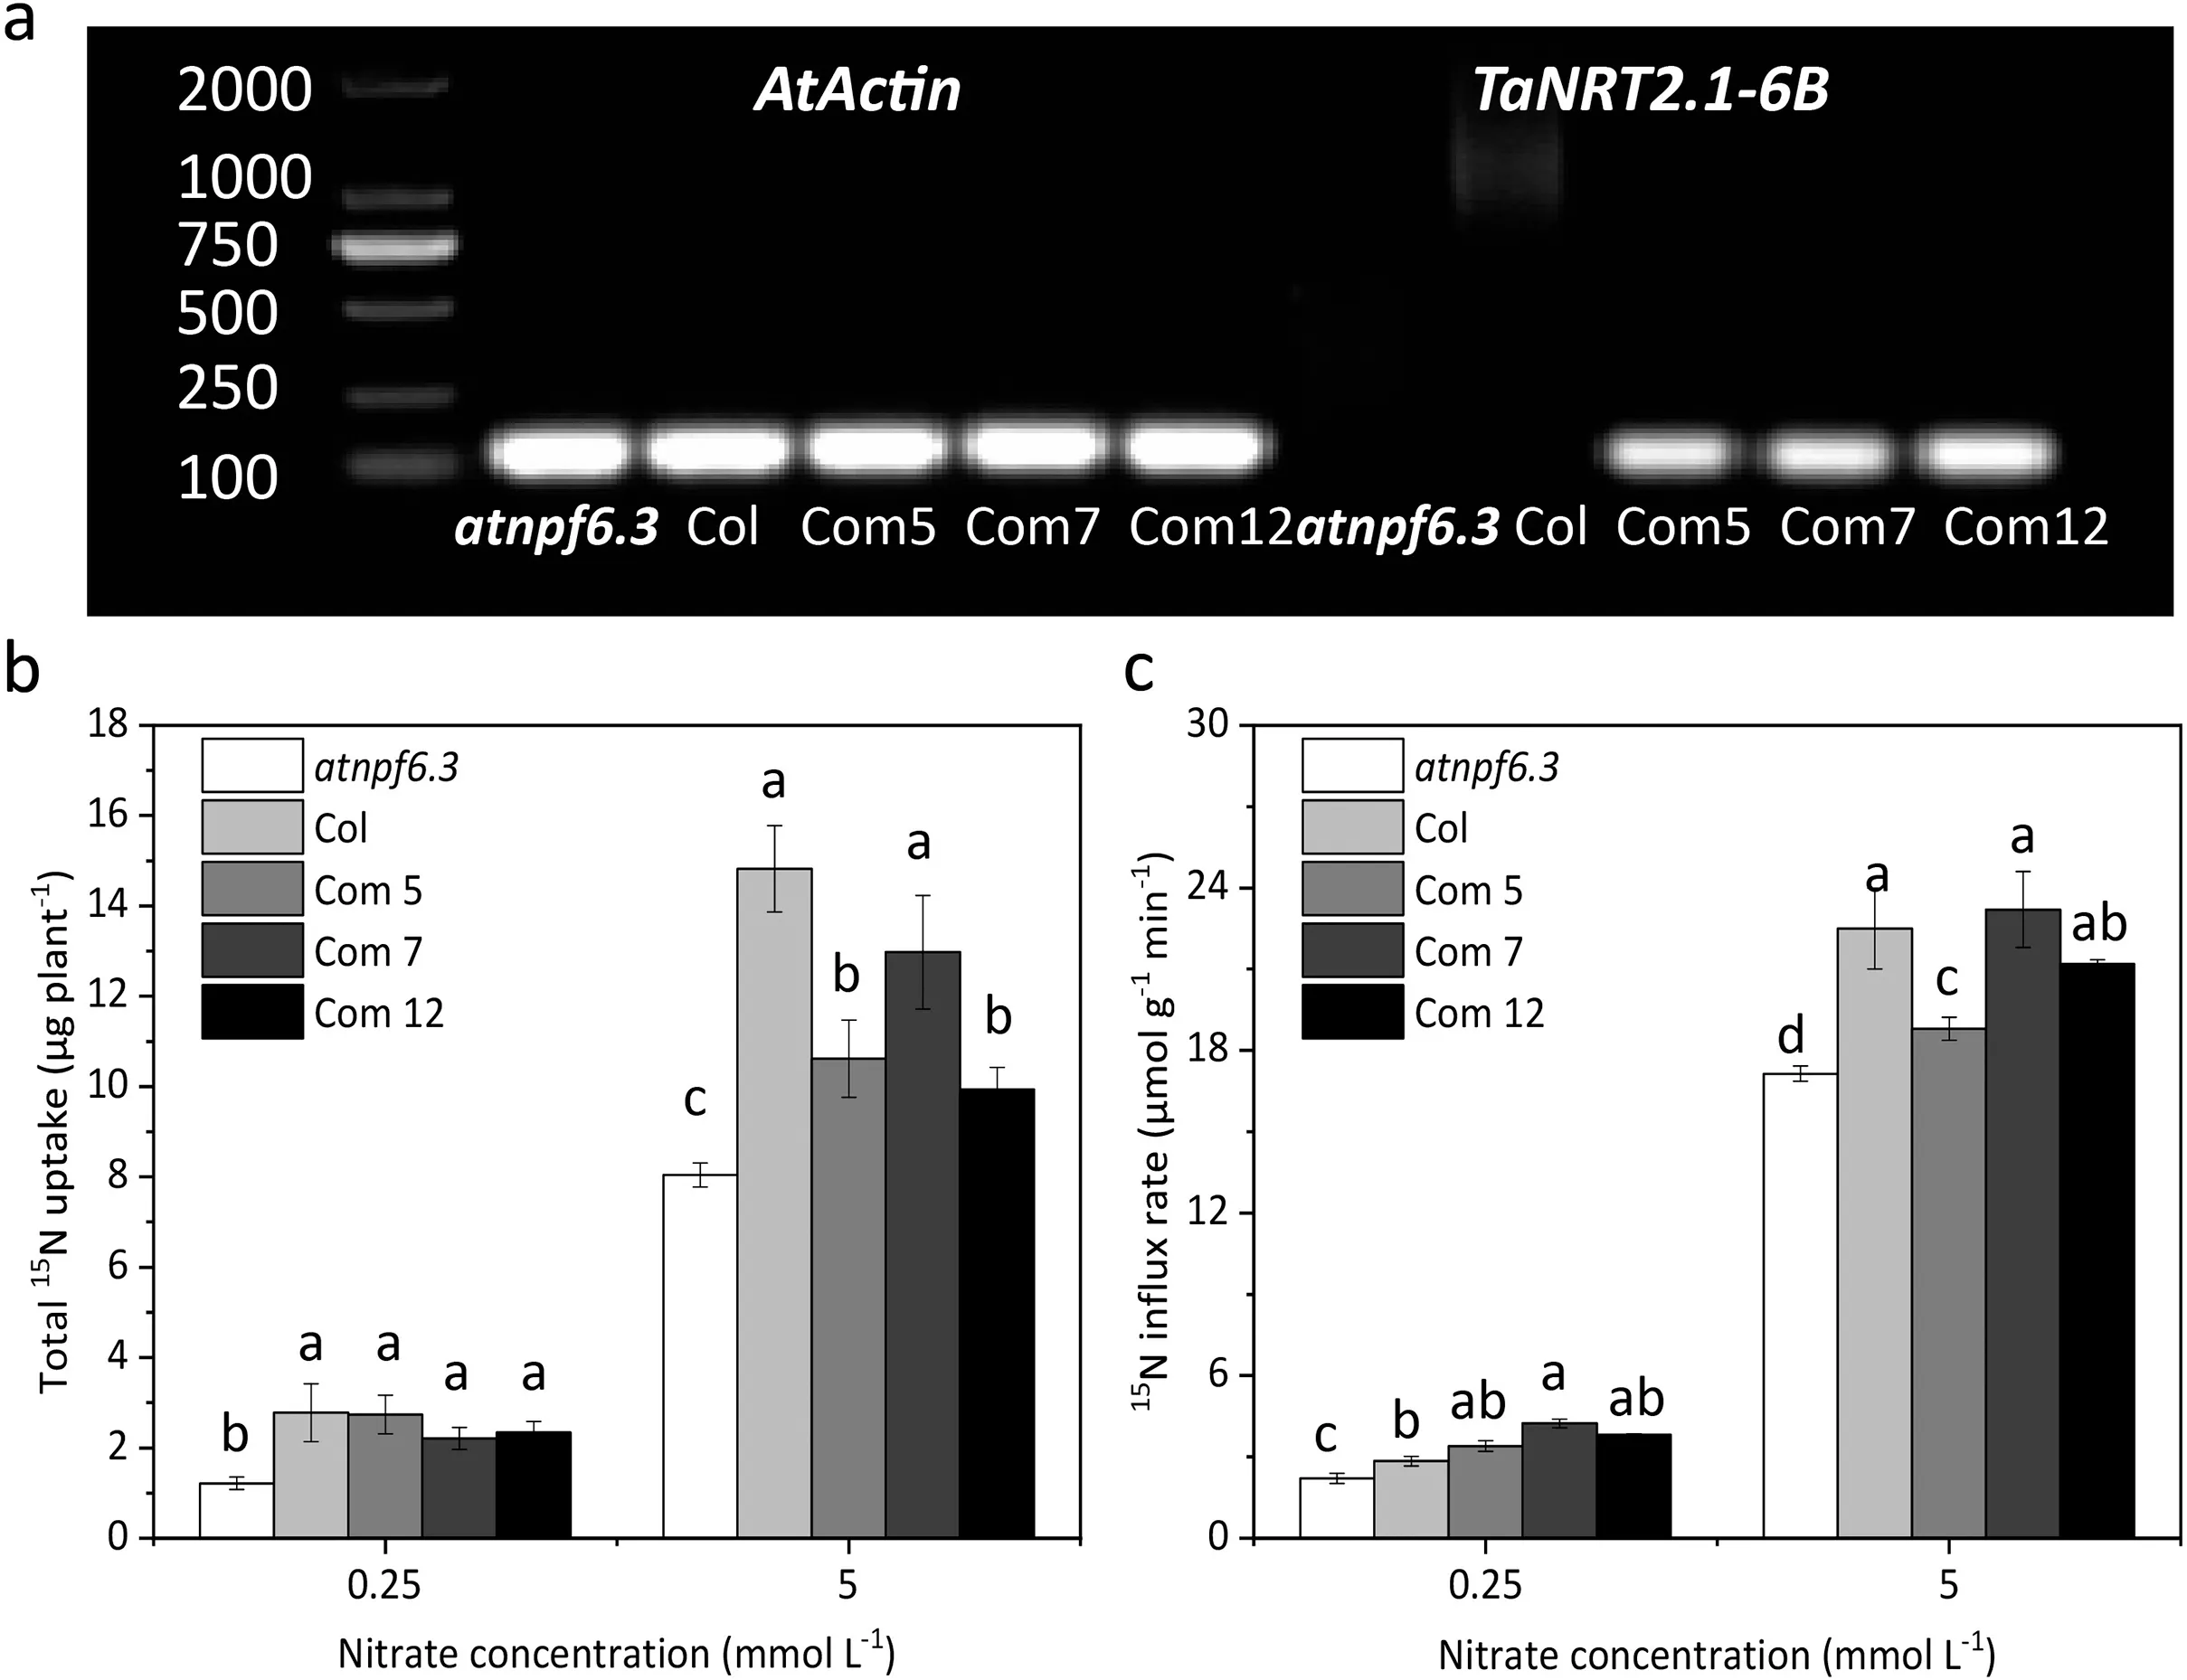
Fig.3. Nitrate uptake complementation of TaNRT2.1-6B in the Arabidopsis atnpf6.3 mutant.(a) Gene expression of TaNRT2.1-6B in the atnpf6.3 mutant(atnpf6.3), wild type(Col)and complemented lines(Com 5,Com 7 and Com 12),AtActin was the housekeeping gene.(b-c)Total 15N accumulation and 15N influx rate of the atnpf6.3 mutant,wild type and complemented lines under 0.25 mmol L-1 or 5.0 mmol L-1 nitrate concentration. n = 5.
Overexpression ofTaNRT2.1-6Benhanced GY and total N uptake, but did not influence NHI, root N concentration, glume N concentration and GNC under either low or high N supply. SNC was decreased by gene overexpression under low N supply, but was increased under high N supply. TheTaNRT2.1-6Boverexpression lines also displayed higher plant height, spike length, shoot and root weight, spike number and TKW at the maturity stage,especially under low N supply (Table 1). However, the grain number per spike has not been significantly improved in response to the overexpression ofTaNRT2.1-6Bunder the high N supply.Overexpression ofTaNRT2.1-6Balso enhanced grian N use efficiency(GNUE)and shoot N use efficiency(SNUE)under the low N supply(Table 1).
4. Discussion
Using CGAS method,the present study found five nitrate transporter gene-related SNPs significantly associated with multiple NUE related traits (Fig. 1). Different models could be used during association analysis[52],however,in the current study the general linear model (GLM) was employed because this model has been widely used in previous CGAS [26,27,53]. A GLM with a Q matrix(calculated by STRUCTURE software)as a correction for population structure, and a mixed linear model (MLM) with both Q and K matrix as corrections were also conducted in our study, and the three models produced similar results (data are not shown). The five significantly associated SNP markers are related to fourNRT2genes in our study, however, onlyTaNRT2.1-6Bwas selected for further analysis, whereas the other three genes may also be eliteNRT2genes whose roles in N uptake of wheat are worthy for further analyses. Among the two SNPs related toTaNRT2.1-6B, the SNP marker AX-94980898 was a synonymous mutation in the CDS region of the gene, suggesting that synonymous mutation could also play important roles in influencing N uptake in wheat.A synonymous mutation may regulate gene function through the following mechanisms: (1) it may regulate gene expression via influencing the stability of mRNA[54];(2)it may influence protein function via change conformation[55];and(3)it may change posttranscriptional processing[56].Three of the five significantly associated SNPs were located downstream of theNRT2genes, and the SNPs probably mediating N uptake in wheat via regulating the expression levels of theNRT2genes. The significant changes in N uptake by wheat plants observed in the silencing or overexpression of theTaNRT2.1-6Bgene(Fig.5)support this hypothesis.However,further analysis of the mechanisms of the influence of the SNPs on gene expression is required by using base substitution wheat materials produced via prime editing method.
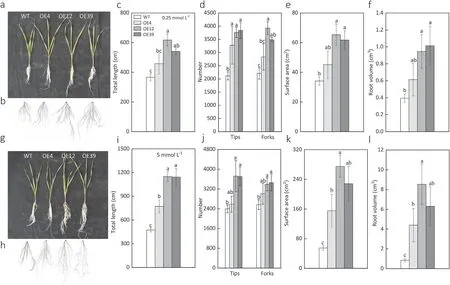
Fig.6. Total root length,tips,forks,surface area and root volume of the wild type(WT)and overexpression lines(OE4,OE12 and OE39)under 0.25 mmol L-1(a-f)and 5 mmol L-1 nitrate supply (g-l). Different letters on the bars are significantly different among treatments at P <0.05 (n = 5).
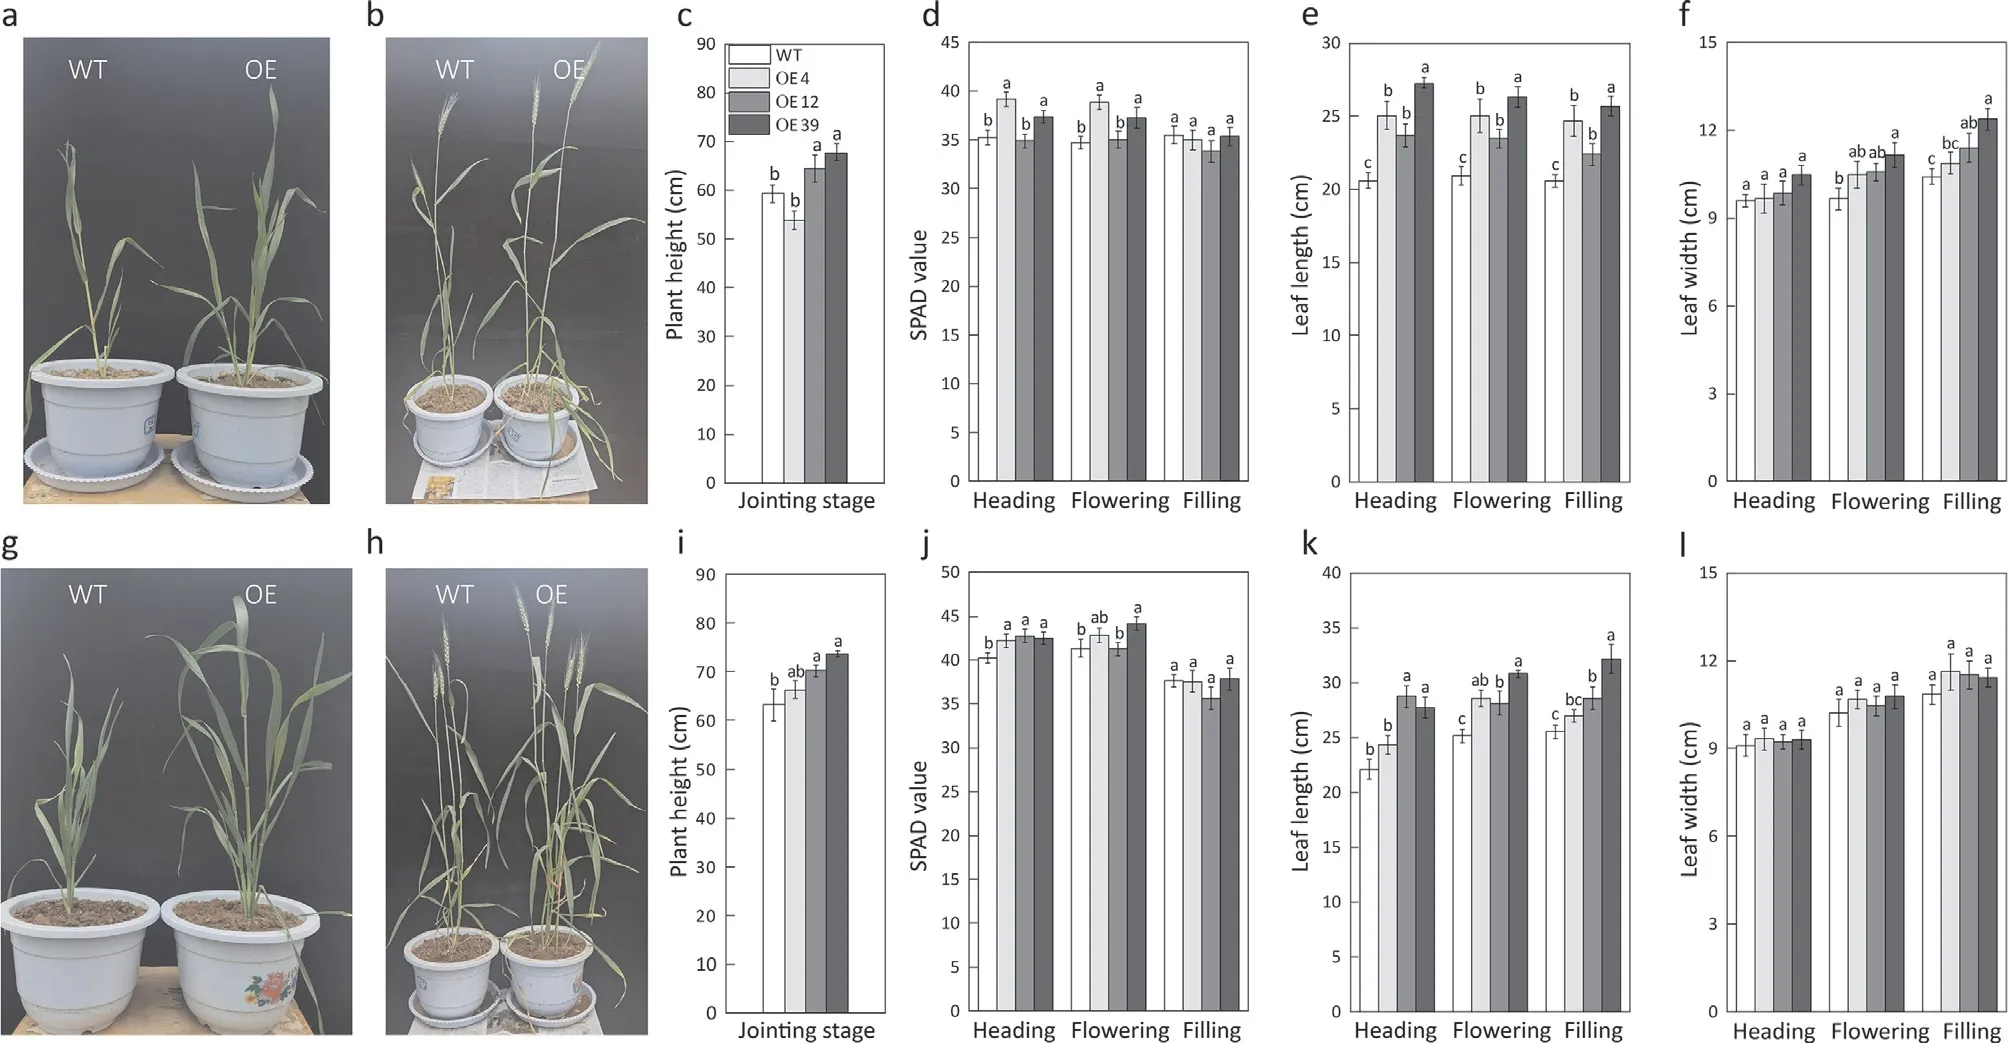
Fig.7. Plant growth,plant height,SPAD value,leaf length,and leaf width of the TaNRT2.1 overexpression lines(OE4,OE12 and OE39)and wild type(WT)under low(a-f)or high N(g-l)supply during the different stages.(a,g)WT and TaNRT2.1-6B overexpression plants at the jointing stage.(b,h)WT and TaNRT2.1-6B overexpression plants at the flowering stage. Values are means and standard errors. Different letters on the bars are significantly different among treatments at P <0.05 (n = 5).
The expression profile and functional analysis of many NRT genes has been well documented in some model plants such as Arabidopsis and rice [57,58]. In wheat, although 331NPFfamily genes and 46NRT2family genes were identified[14],the functions of these genes in regulating NUE are still unknown.TaNRT2.1-6Bis an ortholog of the high-affinity nitrate transporter in barley,HvNRT2.1. Therefore, TaNRT2.1-6B has been hypothesized as a high-affinity nitrate transporter in the wheat roots [32], however,our results proved that the TaNRT2.1-6B protein acts as a dualaffinity nitrate transporter (Figs. 2-5) that surprisingly does not require a NAR2 partner protein like most of theNRT2family members.Similarly,the rice OsNRT2.4 encoded by theNRT2gene family also acts as a dual-affinity nitrate transporter and could transport nitrate independently [17]. These results support the statement that it is unreliable to predict the activity of NPF and NRT2 proteins based on their phylogenetic relationships because their affinity against nitrate is determined by post-translational regulation[14]. In addition, the interaction between NRT2 and NAR2 protein is also mainly determined by post-translational regulation [59],thus, different post-translational regulation in wheat and barley may result in different interaction between TaNRT2.1-6B or HvNRT2.1 with NAR2 protein. It has been proved that the NAC transcription transporter TaNAC2 directly binds the promoter region of the geneTaNRT2.1-6B, and the expression of theTaNRT2.1-6Bcould be induced by nitrate [32]. Our results further confirmed thatTaNRT2.1-6Bis expressed on the plasma membrane of cells (Fig. 2a). Besides, similar to other dual-affinity nitrate transporters, TaNRT2.1-6B could transport nitrate under both low and high nitrate concentrations (Fig. 2b, c). TheKmfor the NO3-uptake with oocytes experiment in pH 5.5 solution were 0.05 and 4 mmol L-1for AtNPF6.3 [60], 0.042 and 7.2 mmol L-1for MtNPF6.8 [12] and 0.15 and 4.01 mmol L-1for OsNRT2.4 [17] in the low-and high-affinity nitrate uptake phase,respectively.However, theKmfor TaNRT2.1-6B was 0.36 mmol L-1and 20.52 mmol L-1in the low-and high-affinity nitrate uptake phase,respectively.These results suggested that TaNRT2.1-6B has a lower affinity against nitrate compared to the previously reported dual-affinity NRTs at both high-and low-affinity nitrate uptake phase.AtNPF6.3 and MtNPF6.8 switch their affinity through the phosphorylation modification of the conserved phosphorylation site RXXT101[61].However, such conserved phosphorylation mechanism has not been reported in the NRT2 proteins, and the mechanisms of how NRT2 proteins such as TaNRT2.1-6B and OsNRT2.4 sense external nitrate concentrations and switch their affinity is still ambiguous.In addition to mediating N uptake, dual-affinity nitrate transporters have diverse functions in plants. The protein AtNPF6.3 can also transport auxin, and acts as a nitrate sensor. Another dual-affinity nitrate transporter MtNPF6.8 inMedicago truncatulacan transport abscisic acid. Therefore, further studies are required to uncover the potential diverse functions ofTaNRT2.1-6B.Moreover, previous studies have proved the roles of dual-affinity nitrate transporters in regulating lateral roots development.AtNPF6.3influences the development of lateral roots in Arabidopsis via regulating the expression of an auxin synthesis geneTAR2and an auxin transporter geneLAX3[62-64].MtNPF6.8is also involved in the inhibition of primary root elongation inMedicago truncatulaunder high exogenous nitrate conditions [65]. In rice, the dualaffinity transporterOsNRT2.4could also influence root growth[17]. Our hydroponic and whole growth period experiment indicated that the overexpression ofTaNRT2.1-6Bsignificantly improved root architecture and biomass of wheat under both limited and sufficient N conditions (Fig. 6, Table 1). Thus, similar to other dual-affinity transporters,TaNRT2.1-6Bis also involved in wheat root growth.
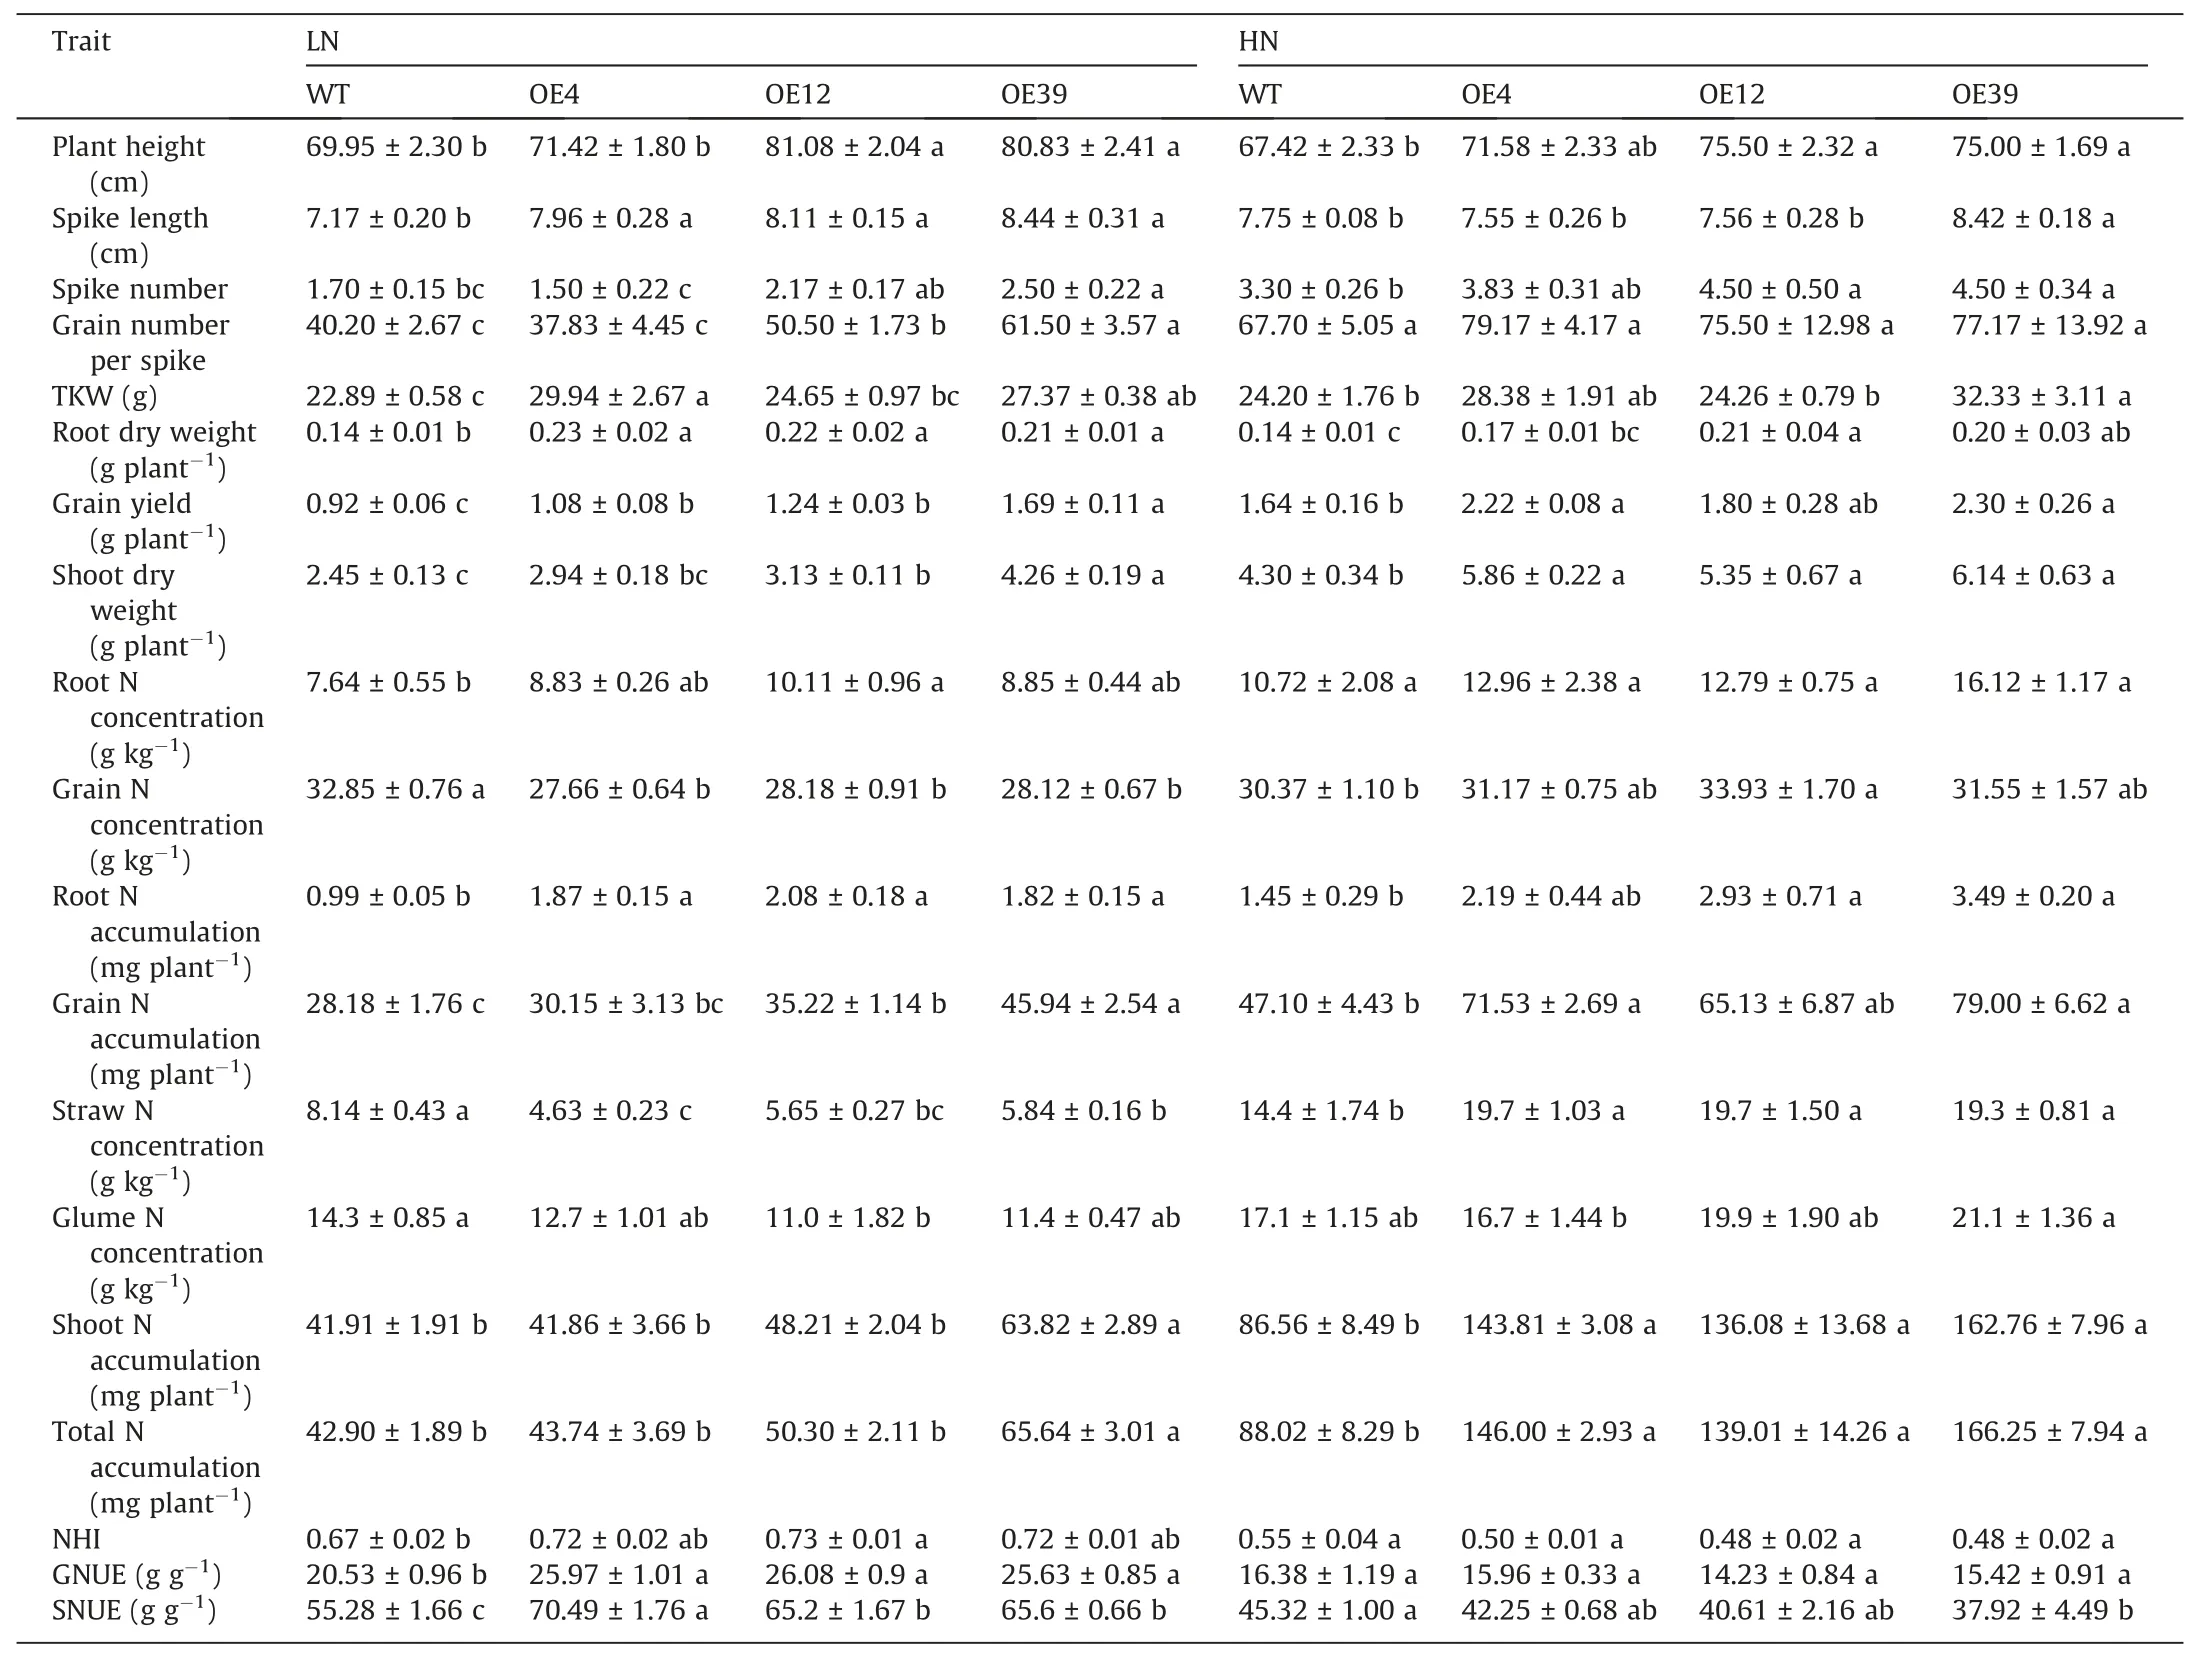
Table 1Agronomic traits, N accumulation and NUE in the TaNRT2.1-6B overexpression lines and wild type (WT) at the maturity stage.
In addition, our study found that VIGS is an efficient tool in silencing gene expression in plant roots (Fig. 5a-c). VIGS has been widely used to silence genes in plants, especially in species where gene transformation is a challenge[66],however,most of the VIGS studies mainly silenced genes in the plant shoot. It has been demonstrated that VIGS is propagated throughout the plant beyond the infected tissue [66,67]. A few studies have found that VIGS can silence genes in the plant roots. For example, in barley,VIGS resulted in 65% downregulation of thePHR1gene expressed in the roots at 9 dpi by inoculation on the first leaf either six or seven days after sowing. Moreover, VIGS led to 42% downregulation of the negative regulator genePHO2which is expressed in the roots at 9 dpi and resulted in a 79% increase of Pi content in the root [68]. In our study, the expression ofTaNRT2.1-6Bcould be reduced by more than 70% compared to the EV treatment(Fig. 5a), however, the gene silencing effect may only last for a short period [69,70].
Our study revealed that the overexpression ofTaNRT2.1-6Bnot only promotes the N influx in wheat at the seedling stage(Fig.5d),but also enhances growth, N uptake, GY and NUE (Fig. 6; Table 1).In rice, overexpression of nitrate transporter genes significantly improved growth, yield and NUE [18,71]. In tobacco, the overexpression ofZmNRT2.1significantly improved plant growth and biomass [72]. The overexpression ofHvNRT2.1in Arabidopsis improved yield related traits [73]. In wheat, the overexpression of the high-affinity nitrate transporterTaNRT2.5increased seed vigor, gain nitrate concentration, nitrate uptake, and yield [49].However, the geneTaNRT2.5is mainly expressed in the tonoplast,and may mainly function in transporting and storing nitrate into the vacuole,thus,it may play an indirect function in N acquisition in wheat from the soil. The increase in leaf SPAD values of wheat plants in theTaNRT2.1-6Boverexpression lines suggests that the overexpression ofTaNRT2.1-6Bimproves N uptake from the soil under both limited and sufficient N conditions. Similarly, the dual-affinity nitrate transporterOsNPF6.5can also significantly increase the SPAD values and yield of rice under both low and high N supply [58]. The present study indicates that theTaNRT2.1-6Boverexpression wheat lines differed in their strategies in improving GY under limited and sufficient N conditions. Under sufficient N conditions,TaNRT2.1-6Boverexpression mainly improves GY via improving spike numbers. Similarly, the overexpression ofTaNRT2.5also increased the GY of wheat via increasing spike numbers under sufficient N application in a field experiment [49].Meanwhile, the improving of TKW and grain number per spike were the main reasons for increasing GY under the limited N conditions (Table 1). Overexpression ofOsNPF6.1has significantly improved the effective panicle numbers of rice under no fertilizer application treatment [24]. Moreover, the overexpression ofOsNRT2.3bin barley could also enhance TKW [74]. The increase of grain number per spike and TKW in theTaNRT2.1-6Boverexpression lines under limited N conditions may be mainly due to the increase of N remobilization ability which could be represented by the NHI parameter (Table 1). Consistent with our results, the overexpression ofOsNRT2.1improved the N translocation and NHI in rice [75]. Co-expression ofOsNAR2.1andOsNRT2.3asignificantly increased the N translocation and N translocation efficiency[76].However,TaNRT2.1-6Boverexpression did not increase tissue N concentrations in our study, which is in agreement with the results also observed from the overexpression ofTaNRT2.5[49]and co-overexpression ofOsNAR2.1andOsNRT2.3a[76]. In our study, OE4 had a poorer performance in growth and N uptake of wheat compared with the other two OE lines possibly due to the overexpression ofTaNRT2.1-6Bin this line was not as effective as in other lines (Fig. 5d), but OE4 still performed better than the WT plants, which supported the conclusions. It is quite common that different OE lines vary in their performance in growth of plants[74-76].In addition,it is well known that wheat plants with higher yield often have lower GNC because of dilution effect [77],however, we observed that the dilution effect is more obvious under LN than that under HN(Table 1).The disappearance of dilution effect under HN maybe because gene overexpression caused more increase of N accumulation under HN (total N accumulation was increased by 58-89%) than that under LN (total N accumulation was increased by 2-53%) (Table 1).
Declaration of competing interest
The authors declare that they have no known competing financial interests or personal relationships that could have appeared to influence the work reported in this paper.
CRediT authorship contribution statement
Hui Tian:Conceptualization, Resources, Funding acquisition, Project administration, Supervision, Writing - review & editing.Mengjiao Li:Investigation, Formal analysis, Writing - original draft.Tian Wang:Investigation,Formal analysis,Writing-original draft.Wenhu Li:Investigation.Hui Zhang:Formal analysis.Shuo Liu:Formal analysis.Salah F. Abou Elwafa:Writing - review &editing.
Acknowledgments
The work was funded by the National Natural Science Foundation of China (31972497). We thank Dr. Qingdong Zeng, from the State Key Laboratory of Crop Stress Biology for Arid Areas, Northwest A&F University for sharing genotyping data.We thank Professor Cun Wang, from College of Life Science, Northwest A&F University, for suppling technical assistance during heterologous expression experiment.We also thank Professor Anthony J. Miller,from the John Innes Centre, UK, for language editing and suggestions.
Appendix A. Supplementary data
Supplementary data for this article can be found online at https://doi.org/10.1016/j.cj.2021.11.012.
- The Crop Journal的其它文章
- Research progress on the divergence and genetic basis of agronomic traits in xian and geng rice
- From model to alfalfa: Gene editing to obtain semidwarf and prostrate growth habits
- The chloroplast-localized protein LTA1 regulates tiller angle and yield of rice
- Genome-wide association study and transcriptome analysis reveal new QTL and candidate genes for nitrogen-deficiency tolerance in rice
- Advances in the functional study of glutamine synthetase in plant abiotic stress tolerance response
- Identification of microRNAs regulating grain filling of rice inferior spikelets in response to moderate soil drying post-anthesis

