Experimental and numerical investigation on opposing plasma synthetic jet for drag reduction
Wei XIE, Zhening LUO,*, Yn ZHOU, Wenqing PENG, Qing LIU,Dengpn WANG
a College of Aerospace Engineering, National University of Defense Technology, Changsha 410073, China
b Beijing Special Engineering Design and Research Institute, Beijing 100000, China
KEYWORDS Drag reduction;Opposing jet;Parameter study;Plasma synthetic jet (PSJ);Supersonic flow
Abstract Experimental and numerical studies are carried out to validate the potential of opposing Plasma Synthetic Jet(PSJ)for drag reduction for a hemisphere.Firstly,flow field changes of opposing PSJ are analyzed by comparing the experimental schlieren images and simulation results in a supersonic free stream of Mach number 3.As PSJ is a kind of unsteady pulsed jet,the shock standoff distance increases initially and then decreases under the control of PSJ,which corresponds to the change of the strength of PSJ. Accordingly, the amount of drag reduction of the hemisphere increases initially and then decreases. It is found that there is a short period of ‘‘drag rise” during the formation of PSJ before the drag reduction,which is induced by the generation of normal shock waves and the area difference of the cavity wall of PSJ Actuator(PSJA).Secondly,the effects of five parameters, including exit diameter, discharge energy of PSJA, Mach number, static pressure of incoming flow and angle of attack, on drag reduction of opposing PSJ were studied in detail by using numerical method. It is found that the Maximum Pressure Ratio (MPR) has a significant impact on the average drag reduction for a configuration-determined PSJA. For the configuration selected in this study,the flow field of opposing PSJ shows typical Short Penetration Mode (SPM)in a control cycle of PSJ when the MPR is less than 0.89.However,the flow field shows typical Long Penetration Mode (LPM) at some time when the MPR is bigger than 0.89. Relatively better drag reduction is achieved in this case.
1. Introduction
Research on drag reduction is crucial for significant improvements in various vehicles. A 1% drag reduction, approximately, leads to a 10% increase in aircraft payload or increased range.For supersonic/hypersonic vehicles, shock wave drag comprises a significant portion of total drag. To reduce shock drag associated with blunt noses, many passive or active approaches have been proposed and verified to be effective by experimental and numerical investigations, which are classified and summarized in detail in several recent review articles.The approaches mainly include an aerospike ahead of the blunt nose,concentrated energy deposition along the stagnation streamline,an opposing jet issued at the stagnation point,combination of opposing jet and forwardfacing cavity,combination of opposing jet and energy deposition,combination of opposing jet and aerospikeand so on.Among them,opposing jet and its combinations are effective active approaches and have been hot research topics for decades. For typical opposing jet, two different modes of jet interaction exist in the flow field,namely,the Short Penetration Mode (SPM) and Long Penetration Mode (LPM).Detailed discussion of SPM and LPM and typical flow field can be found in Refs. 9-11,14. Both of the two modes have potential benefits for drag reduction, while LPM is better.The pressure ratio, the ratio of the jet total pressure and the incoming flow total pressure, is the key parameter affecting the existence of SPM and LPM.In the LPM case,a transition to SPM occurs when the pressure ratio exceeds a critical value.However, the generation of opposing jet is mainly through high-pressure gas source,which is one of the key problems that affect the engineering application of the opposing jet.
Recently, plasma active flow control actuators have gained popularity due to their fast time response,wide bandwidth and no moving components.As one of the promising plasma actuators, Plasma Synthetic Jet (PSJ, also called SparkJet or pulsed plasma jet)actuator was developed by a Johns Hopkins University groupin 2003. Plasma Synthetic Jet Actuator(PSJA) realizes the flow control function through a pulsed high-speed hot jet generated by arc discharge in a small cavity.There are a variety of studies focused on its experimental characterization, efficiency improvement and parameter study,which deepens the understanding of PSJA. At the same time, PSJA has already been successfully applied in several areas,such as aerodynamic control,ice-breaking and supersonic shock control. The application of PSJA in supersonic flow is taken as an example.Narayanaswamy et al.used PSJA to control the Shock Wave/Boundary Layer Interaction (SWBLI) induced by a 24° compression ramp in a Mach number 3 flow. The results showed that separation shock motion was locked to the pulsing frequency and wall-pressure measurements showed about 30% decrease in the magnitude of the power spectral density in the frequency band that corresponds to the low-frequency unsteadiness of the SWBLI. Greene et al.investigated the use of PSJ to reduce the separation induced by SWBLI generated by a 20°compression ramp in a Mach number 3 flow.It was found that PSJ, pulsing at a Strouhal number of 0.018, could reduce the distance between the separation line and the compression ramp corner by up to 40%. The results also indicate that the actuation frequency of PSJ needs to be coupled with the natural frequency of the separation zone in order to exert better control effect. Huang et al.found that a shock-on-shock interaction occurred when the SPJ shock intersected with the shock induced by a 20° compression ramp in Mach number 2 flow.The interaction gradually changed from a regular one to an irregular one with a Mach stem in the middle of the two shocks.Zhou et al.experimentally studied the characteristics of a three-electrode PSJA with secondary flow in hypersonic flow for the first time.The results show that,with the measured pressure of 82 kPa in the air collection chamber, the shock induced by a 25° ramp is modified and the shock angle decreases from 31° to a minimum of 28°. Wang and Shencaptured the large-scale vortex structures induced by PSJ in the supersonic mixing layers by using Nanoparticle-based Planar Laser Scattering (NPLS) method. The result also shows that the mixing layer thickness with the control of PSJ was enlarged.
However, in most of the previous studies, PSJ was usually used as a transverse jet. In fact,reverse placement is beneficial to the performance improvement of PSJA. For example, the cavity pressure of reverse PSJA will be higher than that of traverse PSJA because of the stagnation of the free stream, and the recovery process will be faster. Opposing PSJ can be regarded as the combination of opposing jet and forwardfacing cavity.The difference is that the opposing PSJ is a kind of pulsed plasma heat jet with no need for gas source, compared with the steady opposing jet generated by highpressure gas source. Wang et al.and Chen et al.carried out some work related to opposing PSJ for a blunt body recently. Wang et al.put forward a control strategy based on the opposing PSJ to improve the control effect on a stepinduced supersonic separation. Opposing PSJ used for drag reduction was not considered in their work yet. In addition,relatively low-energy PSJ in their work was not enough for drag reduction for the blunt body. Chen et al.preliminarily studied the drag reduction effect of opposing PSJ by using a numerical method and the average drag reduction of 6.3%has been achieved. However, experimental study and detailed parameter study of opposing PSJ have not been reported yet.Therefore,in the present study,both experimental and numerical method are carried out to validate the potential of singlepulsed opposing PSJ for drag reduction for a hemisphere.For experimental method, high-speed schlieren visualization and voltage measurement are used. Numerical method is verified in detail and used for parameter study. The effects of exit diameter, discharge energy, incoming flow Mach number,incoming flow static pressure and angle of attack on drag reduction of opposing PSJ are studied.
2. Experimental setup and numerical methods
2.1. Experimental setup
The experiment was carried out in a low-noise wind-tunnel(KD-2) at the National University of Defense Technology.The test section is 400 mm in length, 200 mm in height and 200 mm in width.The basic flow field parameters in the experimental section are shown in Table 1. The hemisphere model and the circuit diagram used in this study are shown in Fig. 1(a). The diameter of the hemisphere is 50 mm. PSJA is installed and fixed inside the hemisphere.The discharge cavity of PSJA is a cylinder with a diameter of 12.4 mm and a height of 12.4 mm.The exit diameter of PSJA is 9 mm and the length is 3 mm.Two cylindrical electrodes(Anode and Cathode)with a diameter of 1 mm are inserted into the middle of the discharge cavity, and the electrode spacing is 3 mm. The power supply used in this paper is a high-voltage pulse capacitive power supply.A capacitor of 0.32 μF is arranged in the circuit to store energy and speed up PSJA discharge. When the volt-age across the capacitor reaches the breakdown voltage, the capacitive discharge starts. And the energy in the capacitor transfers to the arc in the discharge cavity quickly. The IGBT controls the on-off of the PSJA. A high-voltage probe is arranged in the circuit to measure the discharge voltage. The flow field of the hemisphere and opposing PSJ is acquired using high-speed schlieren imaging. A standard Z-type schlieren setup is used in this study,as shown in Fig.1(b).The light source is an iodine-tungsten lamp(500 W).Two plane mirrors are used to reflect light.Two 200 mm in-diameter f/10 concave mirrors are used to collimate the light through the test section.A Photron FASTCAM SA-Z camera with an AF NIKKOR 80-200 mm f/2.8D ED lens is used to capture schlieren images.The exposure time is set to 0.16 μs to provide an instantaneous snapshot of the flow. The spatial resolution of the camera is 0.2 mm/pixel, and the minimal resolution of the image is 0.5 pixel. Therefore, the precursor shock and PSJ location measured from the schlieren images have an uncertainty of ± 0.1 mm.In addition, the interval between two successive images is 20 μs.
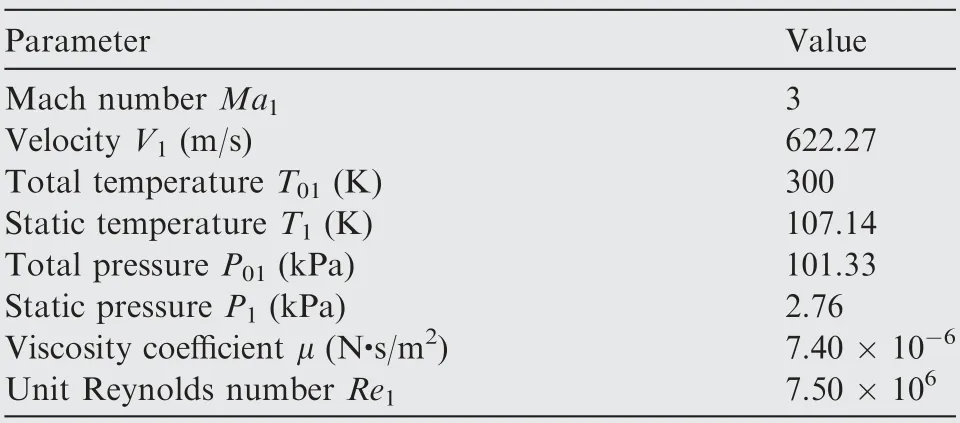
Table 1 Parameters of incoming flow.
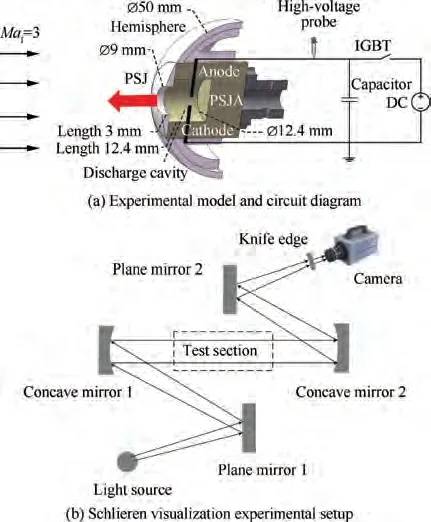
Fig. 1 Schematic diagram of experimental setup.
2.2. Numerical methods
The numerical simulation is divided into steady-state simulation and unsteady-state simulation. The aim of steady-state simulation is to gain a steady flow field without the control of PSJ. The unsteady-state simulation is based on the steadystate simulation and opposing PSJ is added for flow control.
For the steady-state simulation, the solution of the compressible Navier-Stokes equation was obtained using a commercial solver Fluent 19.0. The S-A model is used in the modeling in this stage. The implicit formulation is used in the solution methods, and the flux type is Roe-FDS. A second-order upwind method is used for spatial discretization.Numerical simulation verification is carried out for the hemisphere. The experimental data come from Ref.9 and the theoretical result is calculated by the Newton-Lees correction formula.Numerical simulation parameters are set as described in Ref.9, and two cases are set for simulation using S-A and SST k-ω turbulence model, respectively. As shown in Fig. 2,the numerical simulation results fit well with the experimental and theoretical calculation results. Note that Pis the freestream total pressure, P is the static pressure on the wall of the hemisphere, and θ is the angle between the line between a point on the hemisphere and the center of the hemisphere and the incoming flow. In addition, the calculation results of two kinds of turbulence model also fit well. Therefore, for steady-state calculation, one-equation turbulence model S-A is appropriate.
The key to the unsteady-state simulation is the simulation of PSJ. According to the previous study of Sary et al.,the plasma is at local thermodynamic equilibrium for the discharge of plasma synthetic jet at high pressure (above several kPa). Thus, the plasma and the neutral air around are considered as fluids with the same temperature.The physical mechanism of the formation of plasma synthetic jet is the intense heating caused by gas discharge. So PSJ can be simulated through the phenomenological energy source term model.The basic idea is to calculate the Navier-Stokes equations of the compressible viscous flow with energy source term q˙. The simulation was also obtained using Fluent 19.0 in this stage.The governing equation is shown as
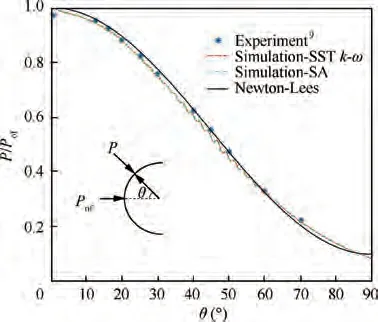
Fig. 2 Numerical simulation verification of hemisphere.
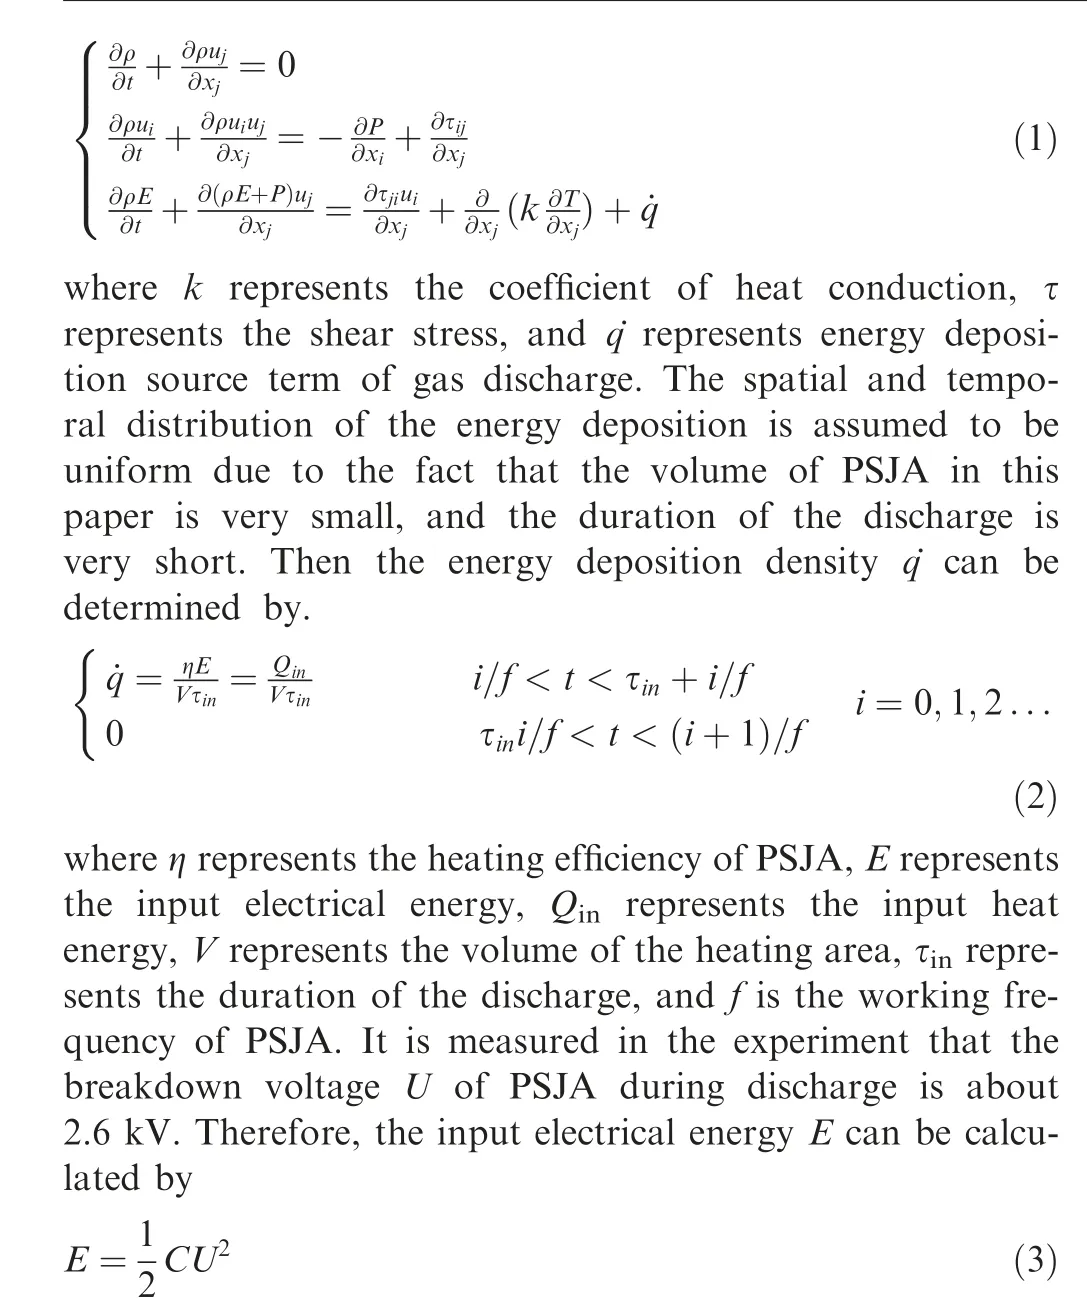
where C is the capacitance of the capacitor shown in Fig. 1.Through calculation, the simulation results are the closest to the experimental results when the energy conversion efficiency η is 0.35 and the duration of the discharge τis 5 μs. Therefore,the energy source term input in the simulation can be calculated by Eq. (2) to be about 6.26 × 10J/m·s.
The thermodynamic and transport properties of the plasma at local thermodynamic equilibrium are determined by its pressure and temperature. The viscosity coefficient,thermal conductivity and specific heat at different pressures and temperatures are calculated based on the empirical equation given by Capitelli et al.The SST k-ω model is used for this stage. The implicit formulation is used in the solution methods, and the flux type is Roe-FDS. A second-order upwind method is used for spatial discretization, and a second-order implicit method is used for the unsteady formulation. The time step is 2 × 10s. The maximum iterations per time step are 20. The simulation of PSJ using such methods has been introduced and validated in our previous article.
The numerical domain and mesh are shown in Fig. 3.The domain includes PSJA, exit and incoming flow. Sizes of hemisphere and PSJA are the same as those used in the experiment. Considering that the numerical domain is axisymmetric, only half of the domain is simulated in order to reduce the calculation time. The meshes near the wall and the shock waves are refined. Parameters of the incoming flow are also the same as those of the experiment. Considering that the total time of the control cycle is very short (a few hundred microseconds), the wall is set as adiabatic boundary condition and stationary no-slip wall. The grid independence of the simulation is done with three levels of mesh refinement, as shown in Fig. 4. The parameters selected are the exit velocity (area-weighted average velocity of the exit) of PSJA after discharge. Variations of exit velocity with time for different meshes fit well. For the coarsest mesh, there is a relatively big difference between 80 μs and 150 μs. Therefore, in order to ensure calculation accuracy and reduce calculation time, mesh of 167,195 is adopted for the simulation.
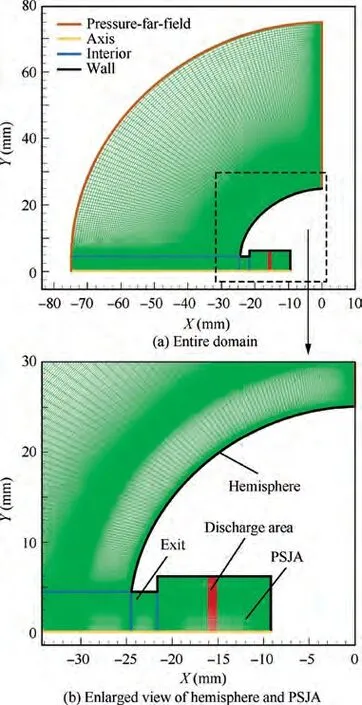
Fig. 3 Numerical simulation verification of hemisphere.
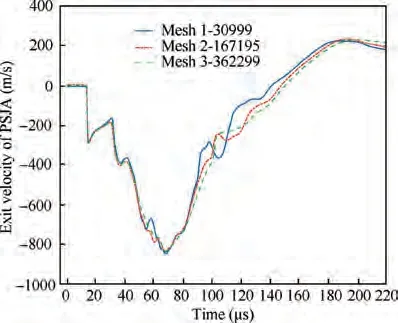
Fig. 4 Variation of exit velocity with mesh size and time.
3. Results and discussion
3.1. Flow field characteristics and drag reduction effect analysis
The comparison of experimental and numerical simulation results of opposing PSJ is shown in Fig. 5. Under the action of supersonic flow, a bow shock wave is generated in front of the hemisphere, with shock standoff distance of about 5.5 mm. After discharge, PSJ gradually forms at the exit of PSJA. Under the control of PSJ, the bow shock wave is gradually pushed away from the hemisphere, and the shock wave standoff distance reaches the maximum at about 120 μs, as shown in Fig. 6. After that, the bow shock wave gradually recovers to its original position at about 200 μs.It can be seen from Fig.5 and Fig.6 that the flow field changes of simulation and experiment schlieren images fit well. However, there is a relatively significant difference between the numerical and experimental results at 50-100 μs. The reasons may be as follows:as we can see from Fig.5 that t=80 μs,part of the discharge arc is ejected out of the discharge cavity with the ejection of PSJ,which heats the flow upstream the hemisphere further. As a result, the shock standoff distance increases further. However, the arc in the simulation is assumed to be a heat source, which is fixed in the discharge cavity. Therefore,the significant differences between the numerical and experimental results at 50-100 μs are formed. After t = 100 μs,the numerical and experimental results fit well due to the dissipation of arc.
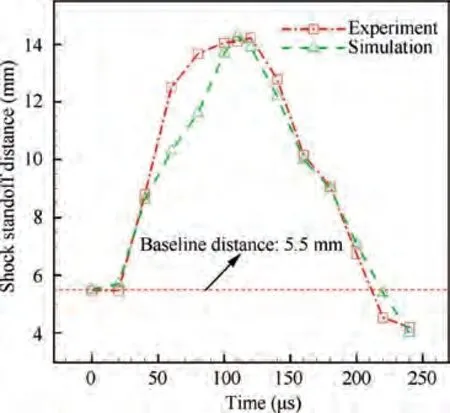
Fig. 6 Variation of shock standoff distance with time under control of opposing PSJ.
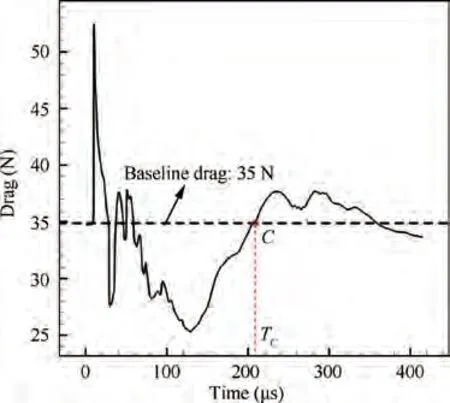
Fig. 7 Variation of drag with time under control of opposing PSJ (Simulation results).

Fig. 5 Comparison of simulation (above) and experimental (below) results of opposing PSJ.

Fig. 8 Variation of densities superposed streamlines in the discharge cavity of PSJA (Simulation results).
Fig. 7 shows the variation of drag (total drag of the hemisphere) with time under the control of opposing PSJ. Baseline drag without control is 35 N. After the discharge starts, the drag firstly shows a short jump rise. This phenomenon can be explained by the formation of a concentrated heat source in the middle of the discharge cavity and the generation of normal shock waves, as shown in the density cloud map of 4 μs and 10 μs in Fig. 8. At t = 10 μs, normal shock waves hit the cavity wall of PSJA, resulting in a sharp rise in wall pressure. However, the overall performance is drag rise due to the existence of area difference of the cavity wall, i.e. the area of exit. Then from 10 μs to 30 μs, the right normal shock wave moves to the left through the reflection of the right wall, but the left normal shock wave continues to move to the left from the exit of PSJA, so the drag shows a sudden drop. At t = 30 μs, as shown in Fig. 8 and Fig. 9, a small part of PSJ has been ejected,and the exit velocity of PSJ has reached about 200 m/s. After the left normal shock wave moves out of the exit, a precursor shock of PSJ is formed, and then the precursor shock and the bow shock are fused quickly.From 30 μs to 60 μs,PSJ gradually accelerates to eject out of the cavity due to the pressure rise in the cavity. A low-pressure recirculation zone is formed at the shoulder of the hemisphere, and it becomes larger and larger.In addition,the shock standoff distance has started to increase, but at the same time, the formation of high-speed PSJ has a certain reaction force on the hemisphere to a certain extent. As a result, the above factors combined lead to a slight rise and fluctuations in drag, as shown in Fig.7.From 60 μs,shock wave standoff distance further increases. By comparing Fig. 6 and Fig. 7, it can be seen that the change of drag is basically corresponding to the change of shock wave standoff distance.For example,at about 120 μs and 130 μs, shock wave standoff distance and drag reach the highest and lowest values,respectively. In this stage,the increase of the shock wave standoff distance under the control of PSJ is the main reason for the decrease of the static pressure on the hemisphere wall and the total drag. As shown in Fig. 10, under the control of PSJ, the static pressure on the hemisphere wall drops significantly.The variation law of static pressure on the hemisphere surface is consistent with that of drag and shock standoff distance. For example, from 70 μs to 120 μs,the decrease degree of static pressure increases gradually,while from 120 μs to 220 μs,the decrease degree of static pressure decreases gradually. Then, the shock standoff distance and the drag of the hemisphere return to the baseline state, at about 220 μs and 205 μs, respectively, as shown in Fig. 6 and Fig. 7. After that, the shock standoff distance will continue to decrease for a short time, along with the increase of static pressure on the hemisphere and drag. The reason can be explained as‘‘the overcharge phenomenon”,which will be stated next.
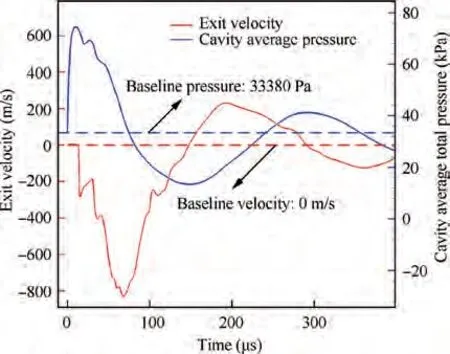
Fig.9 Variation of exit velocity and cavity average pressure with time of PSJA (Simulation results).
As shown in Fig. 9, the exit velocity of PSJA before discharge is about 0 m/s and the average total pressure of the cavity (average cavity pressure) is 33380 Pa. After discharge, the average cavity pressure increases rapidly and reaches the maximum value of 68825 Pa at 10 μs,and the corresponding Maximum Pressure Ratio(MPR:ratio of maximum average cavity pressure to total pressure of incoming flow) is 0.68. The exit velocity of PSJ also increases rapidly and reaches the maximum value of 833 m/s at about 68 μs.Then,as the average cavity pressure decreases gradually,the exit velocity also decreases gradually. At the time of about 148 μs, the exit velocity decreases to 0 m/s,and the PSJ ejection stage ends.After that,PSJA quickly backfills under the action of low pressure in the cavity and the supersonic flow.At about 241 μs,PSJA is backfilled as the average cavity pressure returns to the baseline state. However, the average cavity pressure will rise further due to the inertia of the backfill, which is described as ‘‘the overcharge phenomenon”. This is also the reason why the shock standoff distance continues to decrease and the drag continues to increase for a short time.At 291 μs,the exit velocity returns to 0 m/s again and the average cavity pressure reaches a new small peak. As a result, a second PSJ will occur at the exit. Then the average cavity pressure, the drag and the shock standoff distance change slightly correspondingly. The above process repeats several times before stabilizing finally.However, for drag reduction, the process after t = 205 μs is useless and needs to be avoided.Therefore,the operating cycle of PSJA in this case is preferably set to about 205 μs for drag reduction, so the operating frequency is 4878 Hz. Therefore,some useful methods may need to be adopted to reduce the backfill time of PSJA, such as the refill supply methods by Zhouand Emrick.
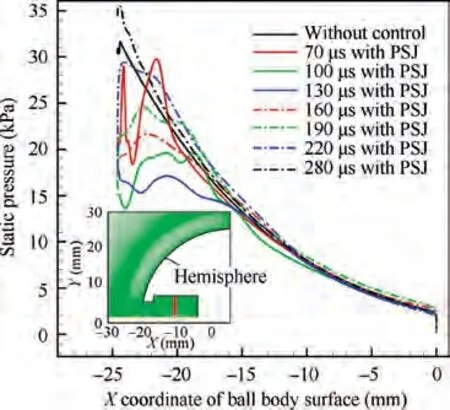
Fig. 10 Variation of static pressure of hemisphere before and after PSJ control (Simulation results).
This paper mainly focuses on the time from the moment when the discharge begins to the moment when the drag of the hemisphere returns to the baseline state (from 0 to T).Thus,Tis the drag reduction duration.To analyze the overall effect of drag reduction,the maximum drag reduction Ddand the average drag reduction Dare calculated as follows:

where Dis the minimum drag, Dis the baseline drag, and D(t) is the transient drag. Dand Dare 27.71% and 9.92%, respectively, in the present case.
3.2. Parameter study on drag reduction of opposing PSJ
3.2.1. Parametric effect analysis
As mentioned in Section 3.1, the drag of the hemisphere will first show a short jump rise in the formation process of PSJ due to the formation of the normal shock wave in the discharge cavity. The drag rise (D) can be described as
D=ΔP·A(6)
where ΔPis the pressure rise when the normal shock hits the wall of PSJA, and Ais the area difference between the walls of PSJA, i.e. the exit area of PSJA. Therefore, it is considered that reducing A(i.e. reducing the exit diameter d)can effectively alleviate this phenomenon and may improve the drag reduction effect. In addition, parameters that can lead to the increase of the strength of the normal shock, such as the increase of discharge energy, may aggravate the phenomenon. Thus, proper discharge energy should be chosen to gain a better drag reduction effect.
The strength of PSJ and the controlled shock are the key factors affecting the drag reduction effect. The velocity of PSJ is an important parameter to evaluate the strength of PSJ. Assuming that the ejection of PSJ is an isentropic flow process, the relationship between the total pressure and static pressure of PSJ is shown as

where Pis the total pressure of PSJ, Pis the static pressure after the bow shock, γ is the specific heat ratio of the gas, and Mais the Mach number of PSJ, which can be calculated as
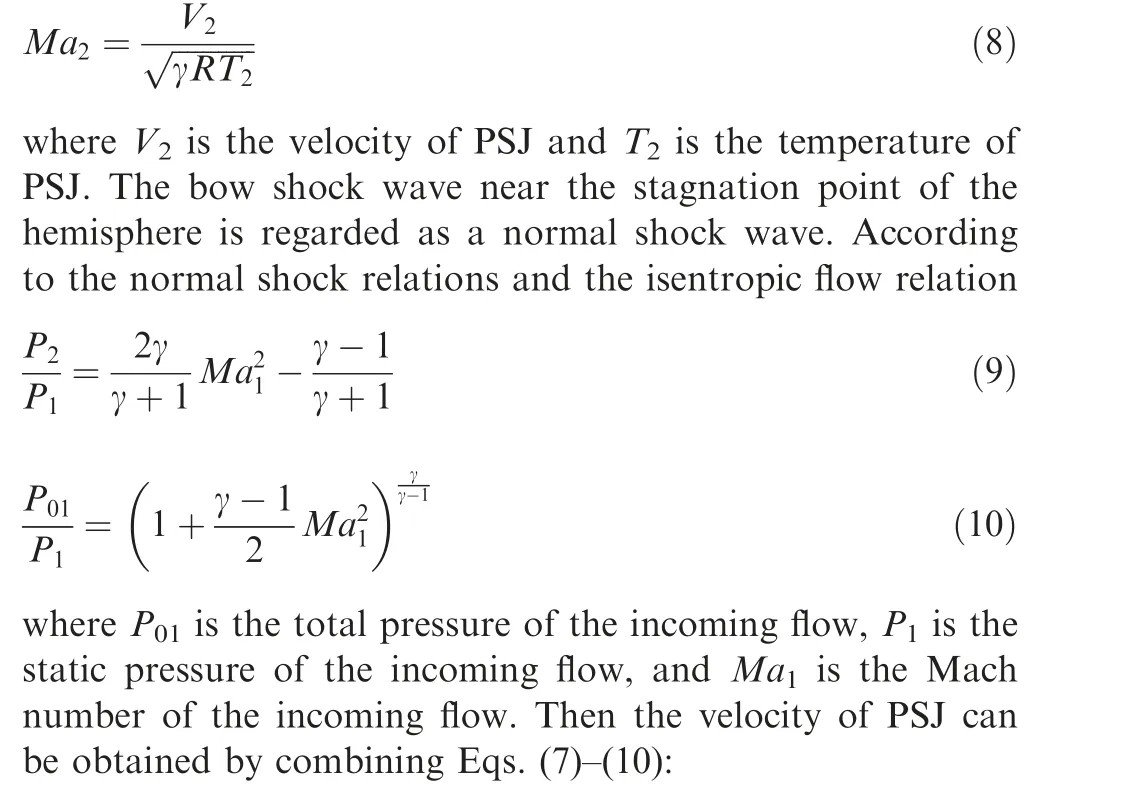

As PSJ is a complex unsteady jet and the parameters in the jet ejection process are constantly changing, the maximum velocity of PSJ Vis selected as the evaluation index. It can be seen from Eq. (11) that Vis mainly affected by the maximum temperature of PSJ T, the incoming flow Mach number Ma, and MPR P/P. Among them,MPR is a compound effect parameter which can be changed by various parameters including Ma,P,the discharge energy E and even some geometrical parameters. Therefore, in this section, the effects of four main parameters, including exit diameter, discharge energy, incoming flow Mach number,incoming flow static pressure and angle of attack, on drag reduction of opposing PSJ are studied. For parameter study,numerical method is easier to control variables,compared with the experimental method. For example, when changing the Mach number of the incoming flow, the intensity of the bow shock changes. In addition, the discharge energy will also change, along with the change of static pressure in the discharge cavity. Therefore, it is difficult to control some single variables for opposing PSJ in wind tunnel experiments.
3.2.2. Effect of exit diameter
In this section,five cases are set in comparison,with exit diameters of 9 mm, 7 mm, 5 mm, 3 mm and 1 mm respectively. As shown in Table 2, it can be found that maximum drag rise(D) decreases significantly with the decrease of exit diameter(from 9 mm to 1 mm).At the same time,smaller exit diameter is beneficial to the increase of MPR, which is conducive to improving PSJ velocity. In addition, the energy of PSJ formed by smaller exit diameter is more concentrated,which is also conducive to the increase of PSJ velocity. The maxim um PSJ velocity of 3 mm exit increases to about 1089 m/s, compared with 833 m/s of 9 mm exit.
In terms of drag reduction, with the decrease of exit diameter (from 9 mm to 3 mm), the drag reduction effect increasesgradually.As shown in Fig.11 and Fig.12,the maximum drag reduction and the average drag reduction of 3 mm exit are 36.86% and 20.42%, respectively, compared with 27.71%and 9.92% of 9 mm exit. The reasons are mainly reflected in the increase of the PSJ velocity, MPR and shock standoff distance,as shown in Table 2 and Fig.13.But the minimum drag of 7 mm exit is slightly higher than that of 9 mm exit because the maximum shock standoff distance of 7 mm exit is slightly shorter than that of 9 mm,as shown in Fig.13.The reason for the increase of the average drag reduction also includes the significant increase of the drag reduction duration T.For example, Tof 9 mm exit is about 205 μs, while Tof 3 mm exit increases to about 936 μs. In conclusion, the decrease of exit diameter within a certain range has the following three benefits:firstly,the drag rise(D)is reduced during the formation process of PSJ; secondly, the drag reduction duration of the single-pulsed PSJ is increased, and thus the requirements on the frequency characteristics of PSJA are also reduced; third,the drag reduction is greatly improved.

Table 2 Parameter comparison of opposing PSJ with different exit diameters (Simulation results).
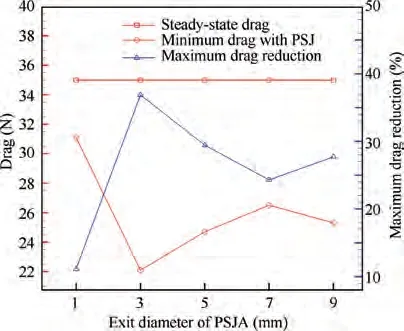
Fig. 11 Variation of minimum drag and maximum drag reduction with exit diameter (Simulation results).
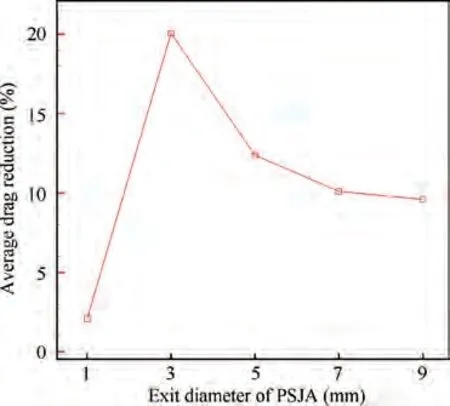
Fig. 12 Variation of average drag reduction with exit diameter(Simulation results).
However, when the exit diameter decreases to 1 mm, drag reduction decreases significantly. This phenomenon can be explained by
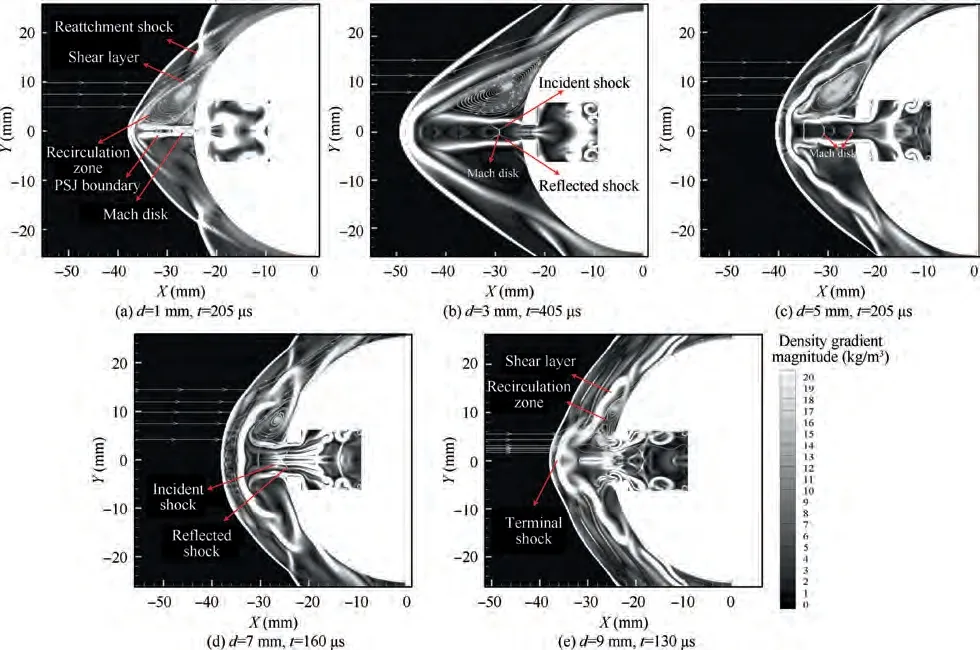
Fig. 13 Flow field comparison of opposing PSJ at the moment of maximum shock standoff distance with different exit diameters(Simulation results).
3.2.3. Effect of discharge energy
In this section,nine cases are set as comparison,with discharge energy ranging from 0.2 J to 40 J. As shown in Table 3, with the increase of discharge energy, MPR increases significantly,so as PSJ velocity.The maximum PSJ velocity Vat the exit increases from 189 m/s(0.2 J)to 2714 m/s(40 J).Correspondingly, maximum shock standoff distance and maximum drag reduction also increase with the increase of discharge energy,as shown in Fig.14 and Fig.15.The maximum drag reduction reaches 62.29% when the discharge energy is 40 J. However,higher discharge energy does not mean higher average drag reduction.As shown in Fig.16,average drag reduction reaches the maximum value of 17.36% when the discharge energy is 8 J. When the discharge energy is bigger than 8 J, the average drag reduction decreases instead of increases. The reason can be explained by the rapid increase of Dand the extension of the duration of D. As shown in Table 3, the maximum drag rise (D) increases significantly with the increase of discharge energy.
Similar to the decrease of exit diameter,the increase of discharge energy also changes the flow field of opposing PSJ significantly. Fig. 15 shows the typical flow field under different discharge energy conditions when the shock standoff distance reaches the maximum. When the discharge energy is smaller than 4 J,the flow field shows typical SPM throughout the control cycle of PSJ.When the discharge energy is bigger than 4 J,the flow field structure changes from SPM to LPM at some time. As shown in Fig. 15(e)-(i), the shock standoff distance continues to increase with the increase of discharge energy,accompanied by the formation of incident shock, reflected shock and Mach disk in the jet. The flow field changes from SPM to LPM, and changes back to SPM in the whole control cycle of opposing PSJ when the discharge energy is bigger than 4 J.

Table 3 Parameter comparison of opposing PSJ with different discharge energy (Simulation results).
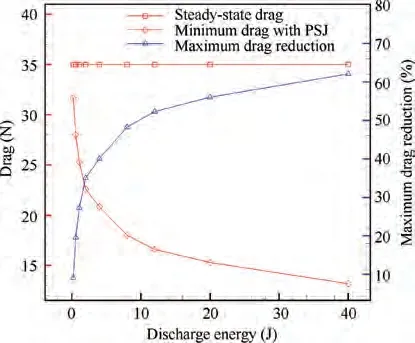
Fig. 14 Variation of minimum drag and maximum drag reduction with discharge energy (Simulation results).
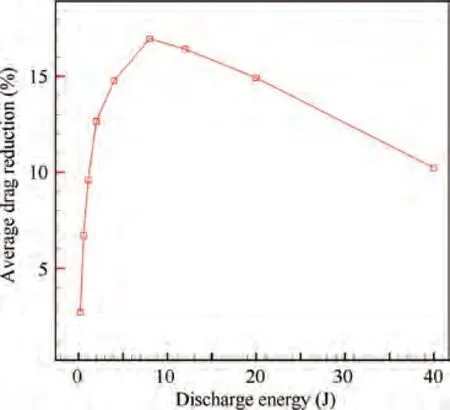
Fig. 16 Variation of average drag reduction with discharge energy (Simulation results).
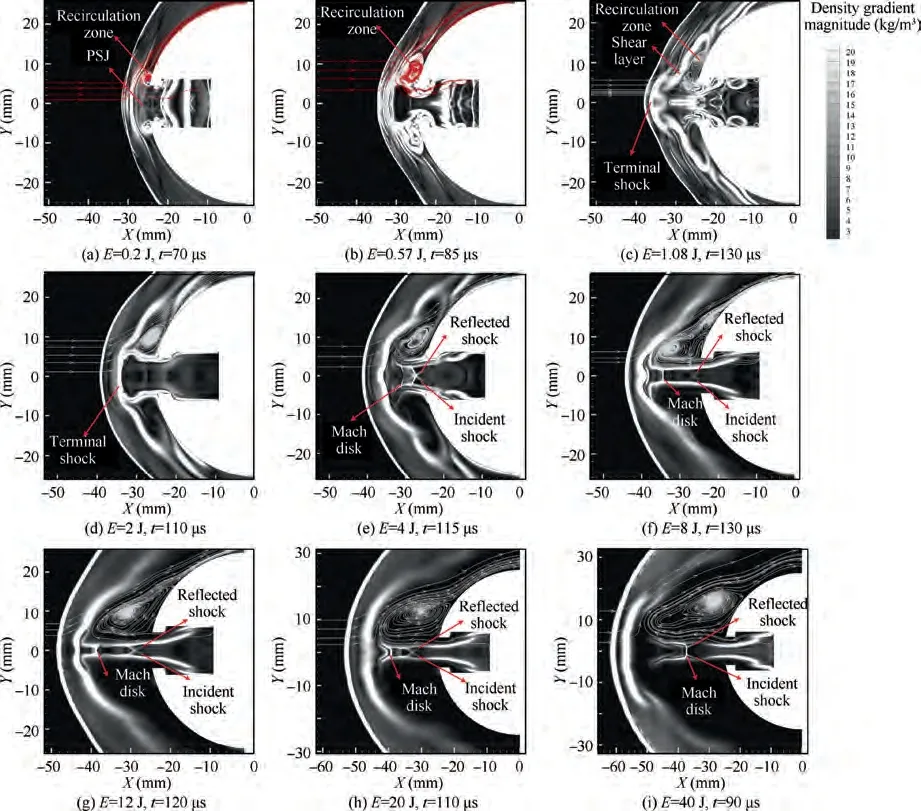
Fig. 15 Flow field comparison of opposing PSJ at the moment of maximum shock standoff distance with different discharge energy(Simulation results).
3.2.4. Effect of Mach number and static pressure of incoming flow
With the increase of incoming flow Mach number, it can be inferred from Eq. (9) that the intensity of the bow shock increases. In addition, with the increase of incoming flow Mach number and static pressure, the steady-state drag of the hemisphere and the total pressure of both the incoming flow and the discharge cavity increase. The discharge energy in this section is set as a constant of 1.08 J. Therefore, MPR and the maximum PSJ velocity decrease significantly with the increase of Mach number and static pressure. The corresponding parameters are shown in Table 4, Table 5, Fig. 17 and Fig. 18. Correspondingly, the maximum drag reduction and the average drag reduction also decrease significantly with the increase of Mach number and static pressure, as shown in Figs.17-20.The drag reduction effect is small for high incoming flow Mach number and static pressure,so it is important to adopt appropriate discharge energy and exit diameter for PSJA according to different incoming flow conditions.
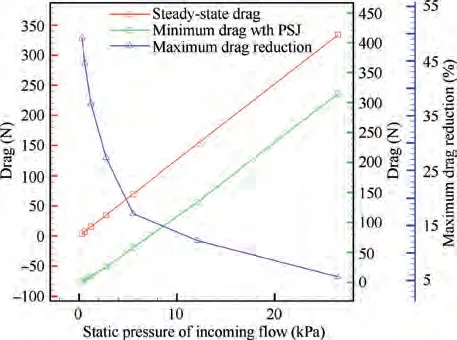
Fig. 17 Variation of drag and maximum drag reduction with static pressure (Simulation results).
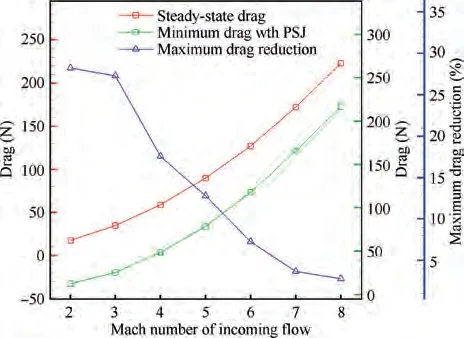
Fig. 18 Variation of drag and maximum drag reduction with Mach number (Simulation results).

Table 4 Parameter comparison of opposing PSJ with different incoming flow static pressure (Simulation results).

Table 5 Parameter comparison of opposing PSJ with different incoming flow Mach number (Simulation results).
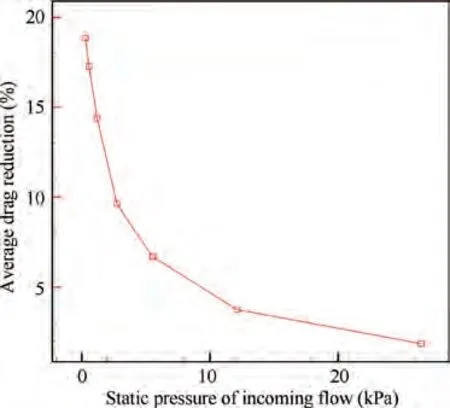
Fig.19 Variation of average drag reduction with static pressure(Simulation results).
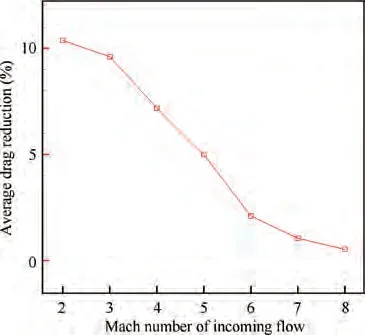
Fig.20 Variation of average drag reduction with Mach number(Simulation results).
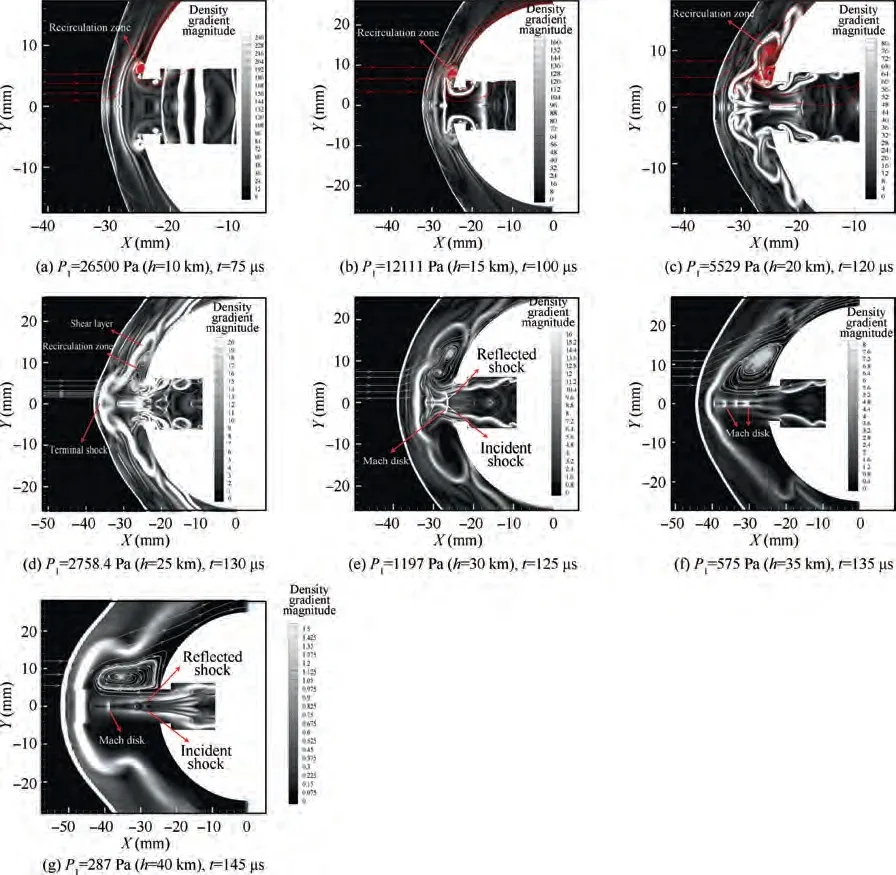
Fig.21 Flow field comparison of opposing PSJ at the moment of maximum shock standoff distance with different incoming flow static pressure (Simulation results).
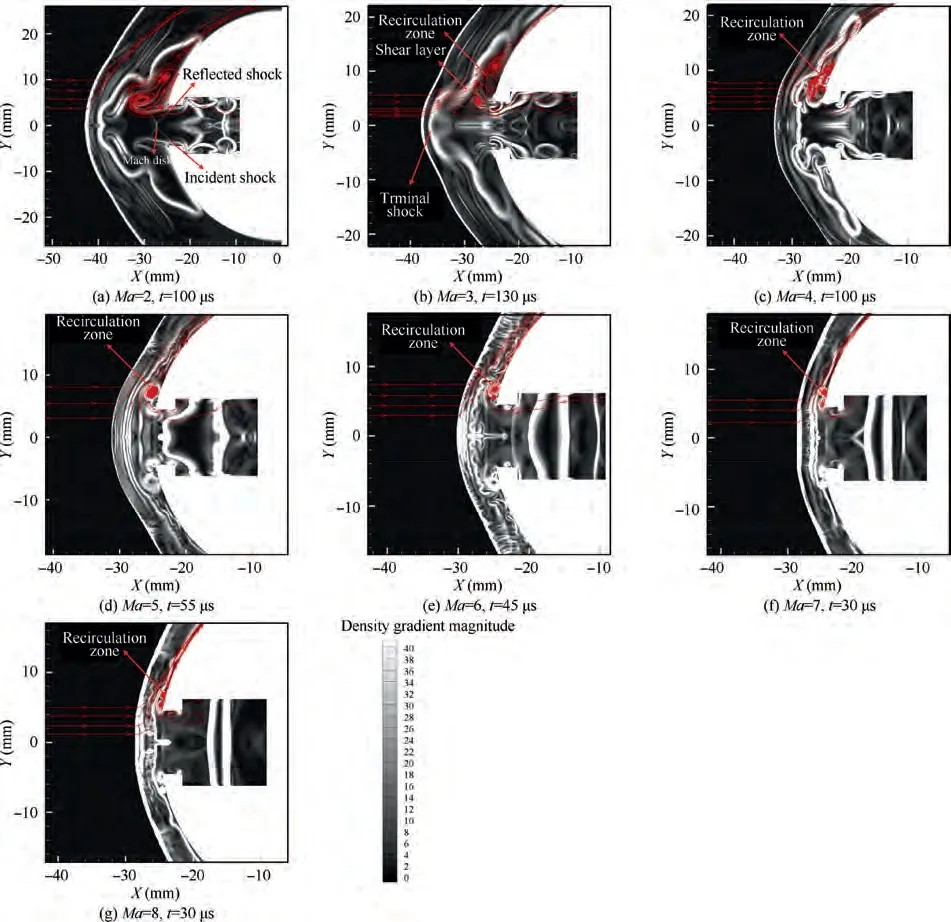
Fig.22 Flow field comparison of opposing PSJ at the moment of maximum shock standoff distance with different incoming flow Mach number (Simulation results).
Fig. 21 and Fig. 22 show the flow field comparison of opposing PSJ at the moment of the maximum shock standoff distance with different incoming flow static pressure and Mach number. Similar to the description in Section 3.2.2, it is found that the flow field structure is significantly affected by MPR when the operating parameters of PSJA are determined.Combined with Figs. 15, 21 and 22, it can be preliminarily concluded that LPM will occur in the flow field when the MPR is bigger than 0.89 for the PSJA of 9 mm exit. The flow field shows typical SPM at the moment of the maximum shock standoff distance, when the MPR is less than 0.88, as shown in Fig. 15(a)-(d), Fig. 21(a)-(d) and Fig. 22(b)-(g). Actually,the flow field shows typical SPM throughout the control cycle of PSJ. However, as shown in Fig. 21(e), when the MPR is 0.89, the flow field shows typical LPM at t = 125 μs. Also,the flow field shows typical LPM at some time when the MPR is bigger than 0.89, as shown in Fig. 15(f)-(i), Fig. 21(e)-(g) and Fig. 22(a). In these cases, the flow field changes from SPM to LPM, and changes back to SPM in a control cycle of PSJ. Relatively better drag reduction is also achieved in these cases.For high incoming flow Mach number and static pressure, the shock standoff distance is small, as shown in Fig. 21(a)-(b) and Fig. 22 (d)-(g), which is the reason why the average drag reduction is small.
3.2.5. Effect of angle of attack
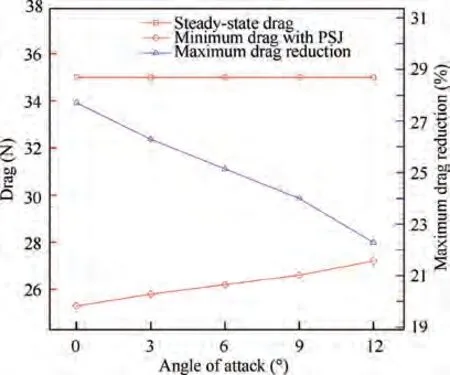
Fig. 23 Variation of minimum drag and maximum drag reduction with angle of attack (Simulation results).
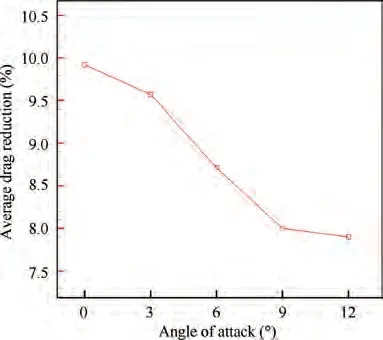
Fig.24 Variation of average drag reduction with angle of attack(Simulation results).
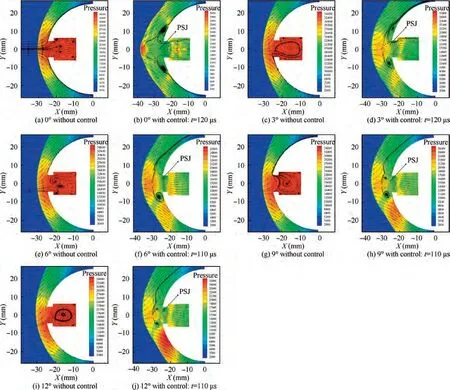
Fig. 25 Flow field comparison of opposing PSJ at the moment of the lowest drag with different angles of attack (Simulation results).
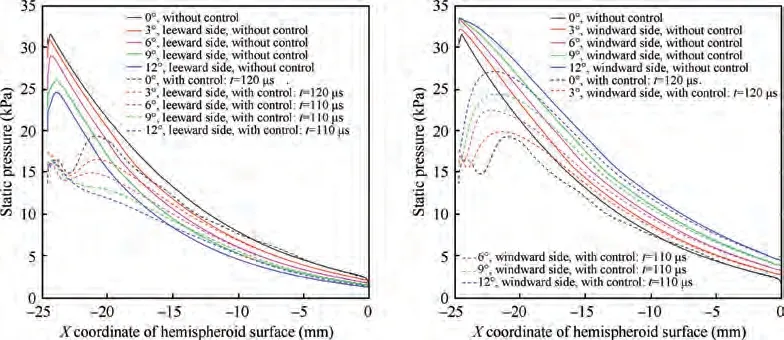
Fig. 26 Static pressure on leeward and windward side of hemisphere with and without control (Simulation results).
In the above discussion, drag reduction of a hemisphere was analyzed for an angle of attack of zero degree using axisymmetric boundary conditions.However,for an operational vehicle, it is essential to study the effect of the angle of attack. In this section, four angles of attack are simulated starting from 3° to 12° through three-dimensional simulation. As shown in Fig. 23 and Fig. 24, both maximum drag reduction and average drag reduction decrease with the increase of angle of attack. But on the whole, high drag reduction is still maintained for 12° angle of attack with an average drag reduction of 7.9%, compared with 9.92% of 0° angle of attack. With the increase of angle of attack, the flow field around the body is no longer symmetrical,forming differently on the windward and leeward sides. Typically, the shock standoff distance decreases on the windward side and increases on the leeward side,gradually,as shown in Fig.25.As a result,the static pressure decreases on the leeward side and increases on the windward side, with the increase of angle of attack, as shown in Fig. 25 and Fig. 26. It can be seen from Fig. 25 that there forms a local high-pressure area on the windward side at a high angle of attack and the pressure increases with the increase of angle of attack.With the control of PSJ,the static pressure on both the leeward side and the windward side decreases significantly.However,static pressure on the large part of the windward side,with a high angle of attack(such as 6°,9°,and 12°),is still higher than that of 0° without control, which can be inferred from the relative value of static pressure shown in Fig. 25 and Fig.26. This is the reason why the drag reduction effect decreases at a high angle of attack.
4. Conclusions
In the present study, experimental and numerical studies are carried out to validate the potential of opposing PSJ for drag reduction for a hemisphere. The main conclusions are as follows:
(1) An experiment of opposing PSJ was carried out in a free stream Mach number of 3, with discharge energy of 1.08 J. The schlieren images show that the shock standoff distance increases initially and then decreases under the control of PSJ, which corresponds to the strength change of the pulsed PSJ. Numerical simulation was then carried out for the same parameters.The numerical results are in good agreement with the experiment,which verifies the feasibility of the numerical method.The drag change process is obtained by numerical simulation, and the maximum drag reduction and the average drag reduction within the period of 205 μs are 27.71% and 9.92%, respectively.
(2) The factors that influence drag reduction effect of opposing PSJ are analyzed theoretically.And the effects of five main parameters, including exit diameter, discharge energy of PSJA, Mach number, static pressure of incoming flow and angle of attack, were studied by numerical methods. Under research conditions, there is an optimal exit diameter of about 3 mm and an optimal discharge energy of about 8 J. In addition, for a PSJA with determined operating parameters, average drag reduction decreases with the increase of incoming flow Mach number, incoming flow static pressure and angle of attack. Therefore, it is important to adopt appropriate discharge energy and exit diameter for PSJA. Relatively high drag reduction is still maintained for 12°angle of attack with an average drag reduction of 7.90%, compared with 9.92% of 0° angle of attack.
(3) The MPR is a key parameter that affects the flow field characteristics and drag reduction effect of opposing PSJ for a configuration-determined PSJA. Higher MPR means higher PSJ velocity, which is beneficial to the improvement of drag reduction. For the PSJA configuration selected in this study, the flow field of opposing PSJ shows typical SPM in a control cycle of PSJ when the MPR is less than 0.89.However,the flow field shows typical LPM at some time when the MPR is bigger than 0.89.Therefore,flow field changes from SPM to LPM, and changes back to SPM in a control cycle of PSJ with MPR bigger than 0.89. Relatively better drag reduction is achieved in this case.
Further work may focus on the optimization of exit configuration of PSJA, such as the Laval-shaped exit. In addition,combining opposing PSJ with other drag reduction methods may also be a promising direction.
The authors declare that they have no conflict of interest.
The data that support the findings of this study are available from the corresponding author upon reasonable request.
This study was co-supported by the National Natural Science Foundation of China (Nos. 52075538, 12002377 and 11872374), the Natural Science Foundation of Hunan Province, China (Nos. 2020JJ5670 and 2020JJ2031), the research program of National University of Defense Technology (No.ZK18-03-11) and China Postdoctoral Science Foundation(No. 2019M652754).
 Chinese Journal of Aeronautics2022年8期
- Chinese Journal of Aeronautics的其它文章
- Ground-based investigations on phase-moving phenomenon with space sublimation cooling for lunar exploration missions
- Novel roll effector based on zero-mass-flux dual synthetic jets and its flight test
- Flow field design and experimental investigation of electrochemical machining on blisk
- Improving performance of macro electrolyte jet machining of TC4 titanium alloy:Experimental and numerical studies
- Numerical investigation of effect of a centrifugal boost impeller on suction performance of an aircraft hydraulic pump
- Vector deflection stability control of aero-engine based on linear active disturbance rejection
