
Numerical investigation of effect of a centrifugal boost impeller on suction performance of an aircraft hydraulic pump
2022-07-30 09:39:48HongkngDONGYonglingHEYnWANGGuiyueKOU
Chinese Journal of Aeronautics 2022年8期
Hongkng DONG, Yongling HE, Yn WANG,*, Guiyue KOU,b
a School of Transportation Science and Engineering, Beihang University, Beijing 100083, China
b School of Mechanical and Electrical Engineering, Nanchang Institute of Technology, Nanchang 330099, China
KEYWORDS Aircraft hydraulic pump;Cavitation;Computational Fluid Dynamics;Impeller;Suction performance;Transient flow
Abstract An integrated boost impeller can effectively improve the suction performance of an aircraft hydraulic pump(AHP).It must be designed very carefully;however,few studies thus far have investigated boost impellers. To explore the effect of the boost impeller, this study developed a three-dimensional computational fluid dynamics(CFD)model for an AHP based on the k-ε turbulence model and full cavitation model.The results of verification tests demonstrated that the model is reliable for simulating the delivery characteristics of piston pumps and the boost capacity of the inlet impeller. Steady-state simulations reveal that the boost impeller can remarkably improve the suction performance and mitigate the cavitation damage due to insufficient fluid filling while only consuming a small proportion of the total input power. Transient-state simulations show that the pump with an impeller is more capable of catching up with a sudden increase in flow demand,and it has a lower suction flow ripple and impact. However, such a boost impeller also has some limitations such as magnifying the suction pressure fluctuation and having little effect on mitigating the cavitation caused by the back-flow jet.
1. Introduction
For a positive displacement pump to achieve satisfactory performance and long operational life, its internal pumping elements should remain filled with fluid (ideally, as close as possible to a pure liquid). To achieve this, free air should be avoided, and the fluid environment should remain above the fluid’s outgassing pressure and vapor pressure. A valving/port plate could restrict the fluid flow and thereby cause a pressure drop. Consequently, for maintaining the saturation pressure in the pumping elements, the pressure at the inlet port should be higher. Consequently, the pump has a critical inlet pressure (CIP).Any operation below the CIP will cause pump cavitation with a subsequent reduction in outlet flow, increased pressure ripple, and severe damage to the pump.
Compared with common industrial pumps, aerospace hydraulic pumps (AHPs) are more likely to sustain cavitation damage because they work at extremely high rotation speeds.7 Furthermore, the size and weight requirements of airborne components considerably limit the inlet pipe diameter, and the distance between the tank and the pump elongates the pipe.Consequently, an integral inlet boost section, typically an impeller, must be incorporated into the pump. An integral boost impeller in the pump can be reasonably effective and affords the advantage of dissolving some of the entrained air. However, it must be designed very carefully, and it shows maximum effectiveness in a relatively narrow performance band in terms of speed and temperature.However,few studies have described the design and development of an inlet boost impeller for AHPs. Therefore, the present study proposes a numerical approach for clarifying the role of the boost impeller.
When investigating boost impellers, the cavitation in the pump due to insufficient oil suction is an important issue. In recent decades, many studies have investigated this issue. In the early 1980s, Yamaguchi and Takabeobserved the cavitation phenomenon in an axial piston pump made of acrylic resin and classified the cavitation into two types: cavitation related to a trapping phenomenon, which could be prevented by a suitable design of the valve plate, and cavitation mainly observed in layers after flow passage contraction or enlargement. Edge et al.later investigated the suction and pumping dynamics of swash-plate piston pumps by a theoretical model considering the fluid momentum effects and predicted the cavitation within the cylinder bore under both high-speed and high-load conditions. Furthermore, Totten and Bishopreviewed the importance of proper inlet conditions on hydraulic system performance and discussed the effect of physical properties, including vapor pressure, viscosity, density, and bulk modulus,on cavitation.Berta et al.developed a numerical model for simulating a swash-plate axial piston pump using a lumped parameters method.On the basis of this model,Casoli et al.presented four hydraulic fluid models by considering different types of cavitation. Wangindicated that the valve plate geometry can be optimized withy some analytical limitations to prevent the piston pressure from reducing below the vapor pressure. These early studies provided remarkable results; nonetheless, they deviated greatly from actual results owing to the limitations of computing capabilities and test conditions.
In recent years,numerical approaches have been developed for predicting the cavitation performance in the fluid machinery. These can mainly be divided into two categories: lumped parametersand three-dimensional (3D) computational fluid dynamics (CFD). In the lumped parameter approach,the whole system is divided into several nodes,and all physical quantities that describe the system are expressed as functions of time. Consequently, lumped parameter models are easy to develop and have quite low computational costs for simulating complex systems. These models provide perfectly acceptable performance under various conditions. However, the main limitations of this approach is that it cannot reflect the variations in physical quantities with spatial position. By contrast,the 3D CFD simulation enables a more detailed flow through complex geometries,as in AHPs.In this category,several cavitation models were proposed by Kunz et al., Schnerr and Sauer, Senocak and Shyy, Singhal et al., and Zwart et al.. Some of these models are currently implemented in commercial CFD codes such as ANSYS Fluent/CFX and Star-CCM+. In particular, the full cavitation model developed by Singhal et al. has been implemented in PumpLinx, a next-generation commercial CFD package, and the robustness and capability of predicting cavitation zone occurrence and strength has been assessed through tests of many fluid machineries.Altareand Yin et al.used such a tool to conduct detailed investigations of the cavitation analysis of gerotor lubricating pumps and seawater hydraulic pumps,respectively.
Although many studies have investigated the cavitation of fluid power components and systems,few studies have investigated AHPs with boost impellers. To fill this gap, this study develops a 3D CFD model of such a component and validates it through a reference pump in an open circuit. The numerical results and discussions presented in this paper clarify the effect of boost impellers on the suction performance under steadystate and flow transient (from a small to large flow in a very short time) conditions.
2. Specification of the component
The reference pump used in this study is a 9.5 cm/r swashplate-type piston pump with variable displacement. Fig. 1 and Table 1 show a section view and the technical data of the pump, respectively. The transient conditions were induced through a forced change of the swash-plate inclination; thus,no displacement control units are shown in Fig. 1. To boost the inlet pressure, a swept blade impeller is directly connected to the shaft via a screw.As shown in Fig.2,the boost impeller has a mixed blade design consisting of eight long blades and eight short blades. The mixed blade design could prevent the emergence and development of a wake flow and enhance the effective blade coefficient. Consequently, even its size is comparatively small, and the centrifugal impeller has decent boost capability.At the impeller outlet,a discrete diffuser is arranged for converting kinetic energy to pressure energy. Thus, the fluid flow can enter the suction chamber with comparatively high pressure.In particular,the flow passage between diffusers and the intake port has a spiral shape; therefore, the fluid enters the piston chamber with both tangential and axial velocity components.It is very important to fill the piston chamber sufficiently with oil, particularly under high-speed conditions.Many studies have shown that cavitation damage can occur easily at the valve plate; thus, optimizing the valve plate structure could contribute greatly to preventing cavitation in the axial piston pump. The valve plate used in this study has an original design without any relief grooves or damping holes,as shown in Fig. 3. The ports of the valve plate overlap with each barrel kidney to construct a flow passage,which confines the fluid dynamics of the pump. The timing angles of the discharge and suction ports on the valve plate are represented by δ, δ, δ, and δ. The opening angle of the barrel kidney is represented by φ. Table 2 shows the specific values of the geometry parameters.
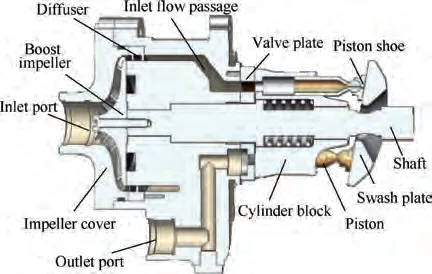
Fig. 1 Schematic of a typical aircraft hydraulic pump.
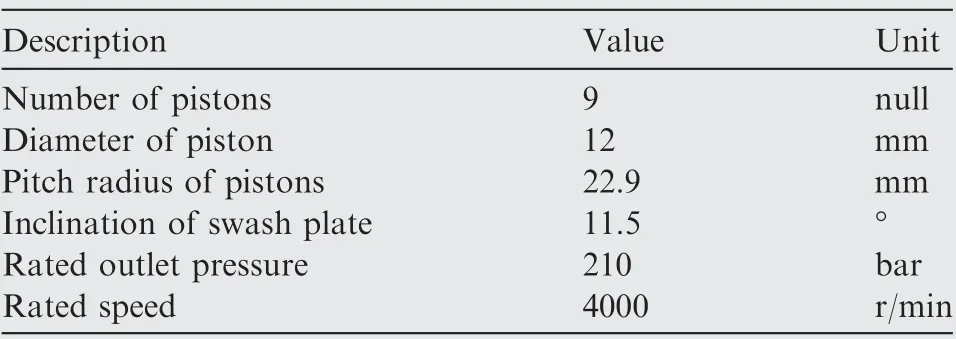
Table 1 Main parameters of test rig.
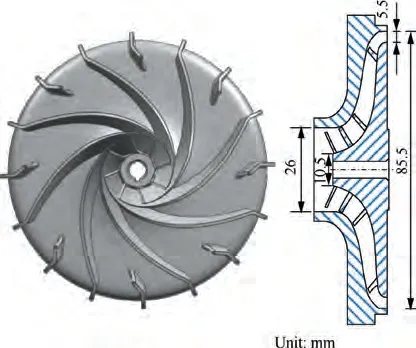
Fig. 2 Boost impeller and its meridional shape.
3. Experimental setup
To obtain experimental data for validating the proposed models,the reference pump was tested in a test rig with the hydraulic circuit shown in Fig. 4. MIL-H-5606 hydraulic fluid was used in the experiment; Table 3 lists its physical properties at 50 °C and 1 atm. The test rig allows for regulating the inlet pressure of the tested pump TP through the double inlet circuits: a natural suction circuit and a gear pump boost circuit.The gear pump GP, driven by a constant-speed motor M1,takes hydraulic oil from the reservoir and supplies it to the tested pump with a pressure adjustable in the range of 1-10 bar (all the pressures in low pressure region are absolute pressures). When the required inlet pressure is lower than the atmospheric pressure, the natural suction circuit is activated to regulate the pressure via the throttle valve TV. The tested pump is driven by a 15 kW frequency conversion motor whose speed can be adjusted from 0 to 3000 r/min. Under normal conditions, the system pressure can be adjusted using a load valve LV1, and under dynamic conditions such as transient flow and response time tests, another load valve LV2 is enabled by turning on/off a switch valve SV3.
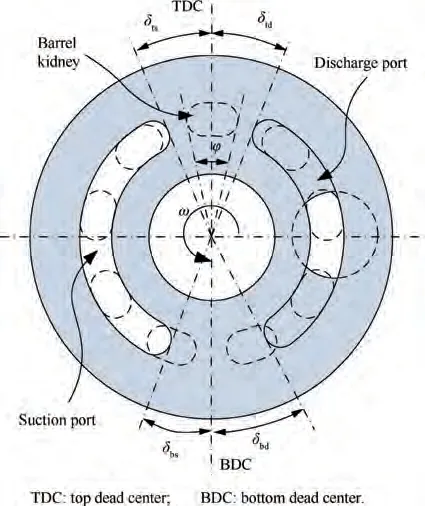
Fig. 3 Geometry of valve plate.
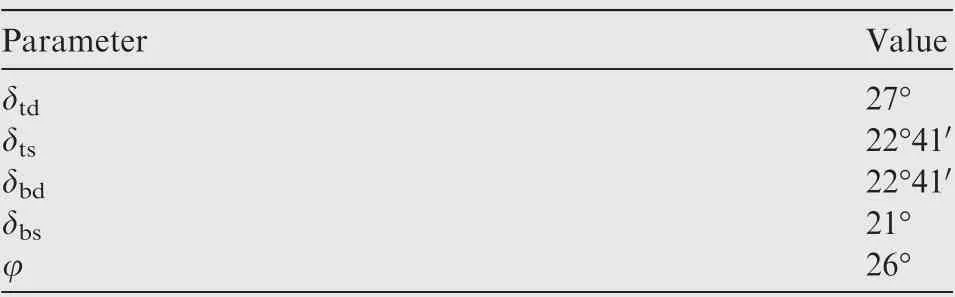
Table 2 Geometry parameters of valve plate.
A transducer PS4 was mounted at the discharge port of the tested pump. For testing the boost capability of the impeller,three pressure transducers were arranged on the tested pump:PS1 for the pressure at the inlet port of the boost impeller,PS2 for the pressure at the blade tip, and PS3 for the pressure just before the suction port of the valve plate, as shown in Fig. 4.Table 4 shows the characteristics of the sensors used in these tests.
4. Numerical modeling methodology
The cavitation model implemented in the present code considers all three important properties of real liquids: cavitation,aeration, and liquid compressibility. This model is based on the work of Singhal et al., which describes cavitation vapor transportation by the following equations:
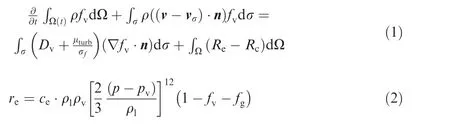
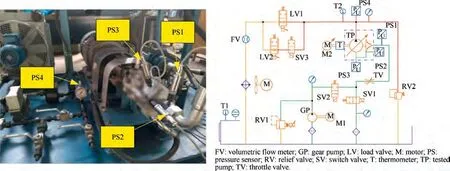
Fig. 4 Test setup and its schematic.

Table 3 Physical properties of the hydraulic fluid.


Table 4 Sensors characteristics.
5. Implement of the numerical model
The aforementioned numerical model was implemented in PumpLinx,a commercial CFD software which enables managing moving grids and mismatched interfaces easily. Because this study only investigates the suction performance of the pump,only the fluid domain of the AHP and suction pipe were created without considering the reservoir, outlet pipe, load valve, and other components in the test rig. In addition, the external leakage flow was not considered in this study, and therefore, the fluid domain did not include the lubricating interfaces for avoiding time-consuming computations and improving the numerical stability. The imported fluid domain was then divided into several subdomains to create interfaces between fixed volumes and variable chambers and to choose the grid size for different subdomains. The subdomains in the CFD model of AHP include the inlet impeller, diffusers,boost passage, valve plate, piston, outlet port, and suction pipe, as shown in Fig. 5. It should be noted that the fluid domain of the suction pipe is considered only under transient conditions to highlight the effect of a rough pipe on the hydraulic resistance. Under steady-state conditions, the inlet port has been extended for 50 mm, and the pressure inlet boundary condition was set to the inlet of the extension, in order to reduce the effect of back-flow.
A mesh independence analysis was conducted to determine the best mesh size and spacing in consideration of the tradeoff between achieving good accuracy and keeping a low computational cost. For this purpose, four mesh sizes were evaluated under steady-state conditions; 156000, 204000, 284000, and 442,000 cells without the suction pipe. The 284,000 cell model was chosen because it provided acceptable results at a much lower computational cost than the 442,000 cell model. Fig. 5 shows the volume meshes for each subdomain after adding the meshes of the suction pipe; they consist of 396,189 cells,1,447,090 faces, and 602,092 nodes.
The Reynolds-averaged Navier-Stokes and continuity equations were solved with a first-order upwind scheme, and the k-ε turbulence model was employed as it could provide better convergence over the k-ω model. For the boundary conditions, the specified pressure conditions were imposed on the end of the inlet and outlet ports, and the wall boundary was set to be a no-slip boundary. In particular, the boundary type of impeller blades was treated in the same way as a cylinder block to ensure that they have the same speed. The pump parameters and oil properties were set in reference to the configurations used in the test rig so that the numerical model could be validated by comparing the measured and simulated results. Another important parameter is the vapor pressure of the hydraulic fluid; this value is set to 400 Pa in reference to a previous study.Finally, the simulations were performed in the transient mode, and the run time was defined with shaft revolutions. In general, for obtaining a repeatable solution,at least five revolutions are necessary with a new run.
6. Model validation
6.1. Instantaneous discharge pressure and flow
The instantaneous pressure and flow curve shapes reflect the operation conditions, fluid compressibility, port geometry of valve plate, and other parameters of the pump. Therefore,the CFD model can be preliminarily validated by comparing the simulated discharge pressure and flow with the experimental results. Because the flow meter on the test rig is located after the load valve, the flow rate through the outlet port cannot be obtained. Therefore, the discharge flow is compared with the results calculated by Manring.In particular, for making the comparison more credible,discharge pressure tests were performed at two speeds: 1500 and 3000 r/min. In addition, the inlet pressure and discharge pressure were set as 3 and 200 bar, respectively.
Fig. 6 and Fig. 7 demonstrates comparisons between the experimental and simulated discharge pressure. To obtain a clear comparison, only one revolution of the pressure curves is shown in each figure. These figures indicate that there are nine subcycles in every revolution, which corresponds to the number of pistons. Notably, at low speed, the pressure fluctuation is significantly smaller than that at higher speed, as reflected in the comparisons. The simulated instantaneous pressure curves agree well with the experimental results,particularly at low speed.
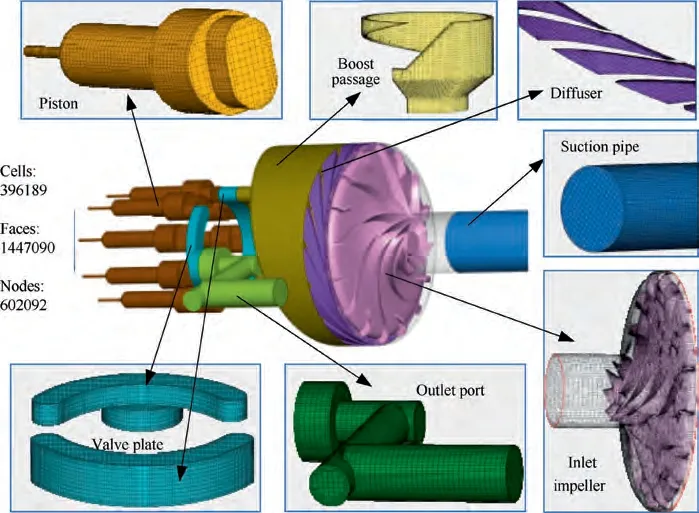
Fig. 5 Mesh construction of fluid domain.
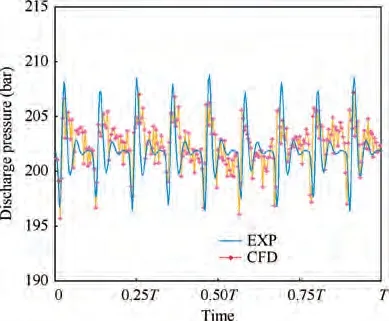
Fig. 6 Discharge pressure at 1500 r/min.
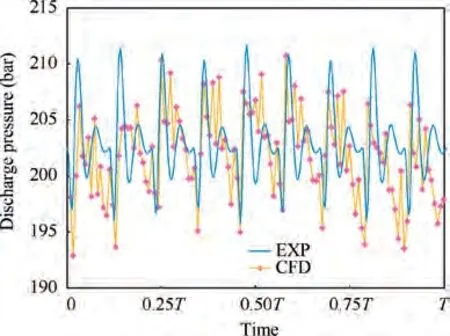
Fig. 7 Discharge pressure at 3000 r/min.
Fig. 8 shows a comparison of the discharge flow rate between the CFD model and the results calculated by Manring. The vertical axis represents the normalised flow, defined as the ratio of the simulated or experimental flow to the theoretical flow. Because the timing of the valve plate used in this research is larger than that of the plate used in Manring’s study, the trapping phenomenon lasts longer. As a result, the undershoot of the flow rate labelled by CFD is more significant. Further, the undershoot of the flow curve is influenced by the time step, compressibility of the fluid, etc. The above comparisons indicate that despite the simulated and reference results having some difference in the amplitude of pressure fluctuation and flow ripple, the varying tendencies show good agreement.
6.2. Inflection of effective flow
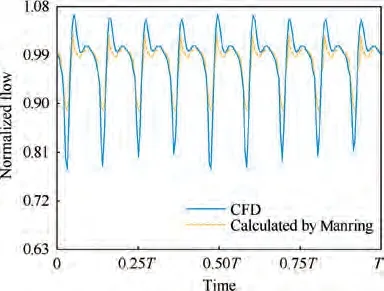
Fig. 8 Comparison of discharge flow between CFD result and Manring’s calculation.
Next,the effective flow rate of the pump with(W)and without(WO)a boost impeller under conditions of insufficient suction flow is measured. Under such conditions, the effective flow decreases significantly; this phenomenon is called flow inflection, and it indicates that the pump is sustaining cavitation damage. In general,the cavitation of specific hydraulic pumps can be achieved through two methods: increasing shaft speed and reducing inlet pressure. However, the rotational speed of the drive motor in the current test rig is limited at ≤3000 r/min;this is much smaller than the rated speed of the reference pump. Consequently, it is difficult to capture the inflection of the effective flow by increasing the shaft speed. Therefore, the measurement of the effective flow was conducted only under the condition of reducing the inlet pressure, as shown in Table 5.
Fig. 9 shows the experimental and computational results for the pump with and without a boost impeller.As in the flow comparison described in the previous subsection, the normalised effective flow shown on the vertical axis is defined as the ratio of the simulated/experimental flow and the theoretical flow.However,the difference is that the flow mentioned here is obtained from the mean value under steady-state conditions.
Fig. 9 indicates the good agreement between the CFD results and the experimental results when reducing the inletpressure at a specific speed.For the pump without the impeller,the inflection points are 1.4 and 1.2 bar for experimental and CFD curves, respectively, and the corresponding values for the pump with the impeller decrease to 0.6 and 0.5 bar,respectively. In addition, the simulation results indicate that the pump with the boost impeller has better suction performance at lower inlet pressure (e.g. 0.5-1 bar). A reasonable explanation is that the suction pressure has a lower fluctuation amplitude when the inlet pressure is in the range of (0.5-1) bar,comparing with that when the inlet pressure is 1.2 bar. Lower amplitude means the suction pressure at inlet pressure of(0.5-1) bar probably has higher valley value, and it can be maintained above the atmospheric pressure under such conditions.Consequently, the piston chamber can be well filled with hydraulic liquid.
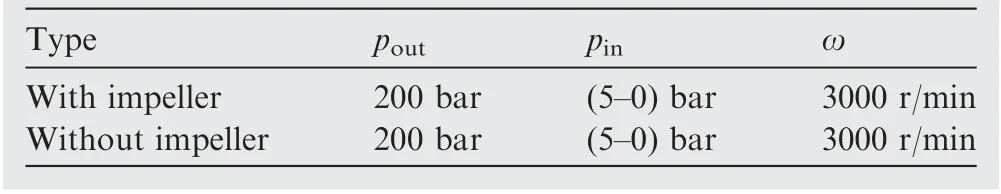
Table 5 Parameters setting for effective flow test.
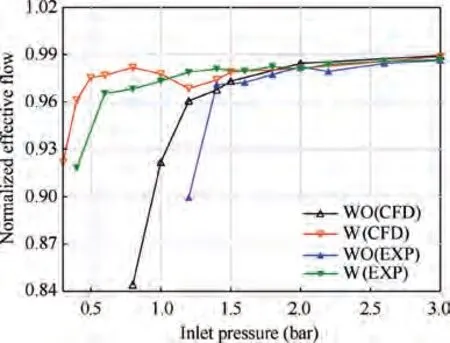
Fig. 9 Inflection of effective flow with and without boost impeller.
6.3. Boost capacity
Fig. 10 shows the comparison of PS1, PS2, and PS3 between the experimental (EXP) and the CFD results at different inlet pressure. During the simulations, the inlet pressure conditions were set according to the average pressure of PS1 in the range of the selected two revolutions.The measured results in Fig.10(a) were obtained using natural suction, whereas those in Fig. 10(b) were obtained using boost pump. In this study,the boost capacity of the impeller is defined as the difference between PS1 and PS3.
The results in Fig. 10(a) show that the pulsation frequency of the pressure under the condition of natural suction is related to the speed and number of pistons.By contrast,the pulsation frequency of the measured pressure in Fig.10(b)does not have such regularity because the hydraulic fluid was supplied by the gear pump. Another difference between the simulated results and experimental results is that the test pressure pulsation of PS1 is significantly greater than the simulated one.The reason is that during the simulations, the pressure at the inlet port is set as the inlet boundary condition, which is easier to keep stable. Table 6 lists the calculated mean values of the pressure in Fig.10.The boost capacities obtained using CFD are 0.708 and 0.707 bar for inlet pressure of 1 and 3 bar, respectively,and the corresponding values obtained using the experiment are 0.719 and 0.700 bar, respectively. Therefore, the CFD model can be concluded to accurately reflect the boost capacity of the inlet impeller.
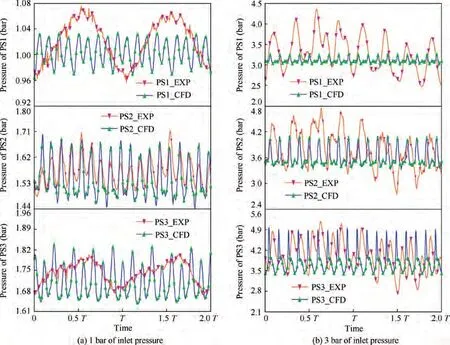
Fig. 10 Comparison between measured and simulated pressure.
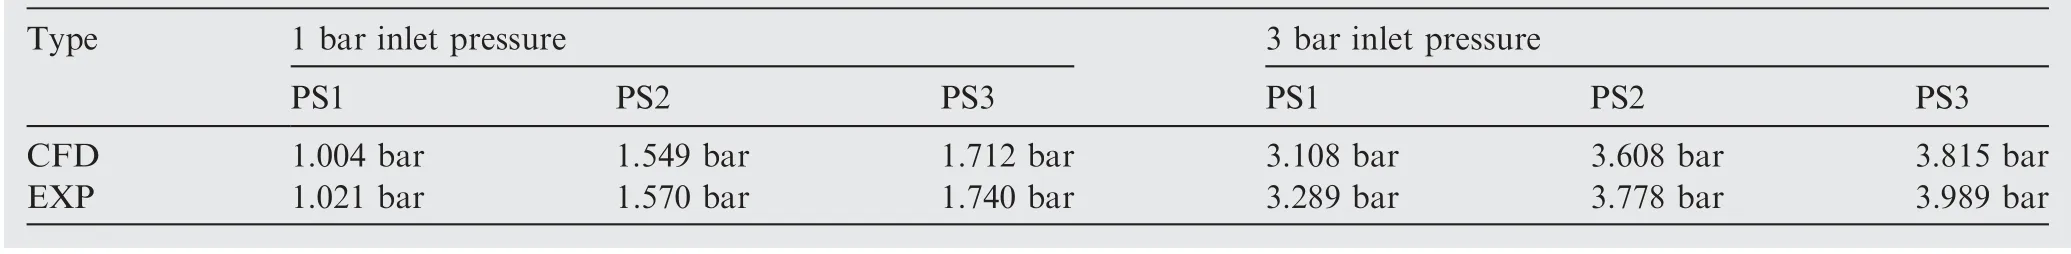
Table 6 Comparison of mean values of pressure.
7. Results and discussions
In this section, the verified numerical model is used to investigate the effect of the integrated impeller on the suction performance under the steady-state and flow transient conditions.The cavitation distribution of the AHP is first presented at a given inlet pressure and speed, and then, the power consumption of the boost impeller is estimated under wider operating conditions.Finally,a CFD analysis of the transient conditions is conducted considering the suction pipe.
7.1. Steady-state analysis
7.1.1. Cavitation distribution of AHP
Cavitation distribution is an important part of the suction performance, and this subsection was carried out under steadystate conditions to show the cavitation region. One study noted that two types of cavitation can occur in axial piston pumps:One is caused by the insufficient filling of the fluid during the suction stroke. At a higher pump rotating speed or larger displacement, the pumping chamber cannot be filled with the working fluid before BDC owing to the throttling effect at the inlet port, and therefore, cavities remain in the chamber. The other type of cavitation is caused by a highspeed jet flow through the valve port. When the piston chamber starts connecting with the suction port after TDC, as the pressure in the piston chamber is possibly much higher than the inlet pressure, a jet flow from the high- to the lowpressure side occurs, resulting in shear flow cavitation. At this moment, erosion caused by this cavitation is sometimes experienced on the surface of the valve plate. In the same manner,just after the suction stroke, if the pumping chamber pressure is lower than the discharge pressure at the moment of valve opening, jet flow from the high-pressure side to the pumping chamber occurs, resulting in jet flow or shear flow cavitation again.
The cavitation damage power associated with bubble collapse can be used to predict the extent of damage (unit: watt)caused by cavitation on the surface of the structure. A value exceeding 5 × 10W indicates substantial damage. However,owing to space limitations, the cavitation distribution of the AHP during one revolution period is not presented in this paper. Only the results at the time when one piston chamber is just connected with the ports of the valve plate are presented because these two moments are representative to reflect the cavitation performance over the whole time scale. Fig. 11 shows the iso-surfaces where the damage power exceeds 5 × 10W. During the simulation, the shaft speed, inlet pressure, and outlet pressure are kept constant at 3000 r/min,1 bar, and 200 bar, respectively. As shown in Fig. 11, the regions marked with red represent the potential cavitation areas, and significant cavity volumes are only present at the flow passage between the piston chamber and the valve plate.Owing to jet flow direction, cavitation erosion is experienced on the surface of the valve plate during the discharge stroke and inside the wall the of piston chamber during suction stroke. Another important result is that serious cavitation caused by the jet flow still exists even when in the pump with the boost impeller.
Furthermore, by reducing the threshold of cavitation damage power from 5 × 10W to 10W, the isosurfaces can be updated as shown in Fig. 12. For the AHP without a boost impeller, the visible cavitation region expands to the suction chambers on a large scale. However, almost no cavitation is seen inside the piston chambers for the AHP with the boost impeller. Furthermore, the added boost section has much better anti-cavitation capability than the piston pump under lower inlet pressure conditions. Although a damage power of only 10W will cause limited damage in a short time, the destructiveness is cumulative and can manifest itself as serious damage over hundreds of hours. Therefore, incorporating an inlet boost impeller could greatly relieve or even eliminate the cavitation damage caused by insufficient oil suction.
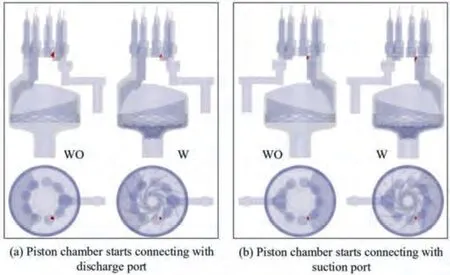
Fig. 11 Cavitation region of AHP with and without impeller (damage power >5 × 10⁸ W, inlet pressure = 1 bar, outlet pressure = 200 bar, rotational speed = 3000 r/min).
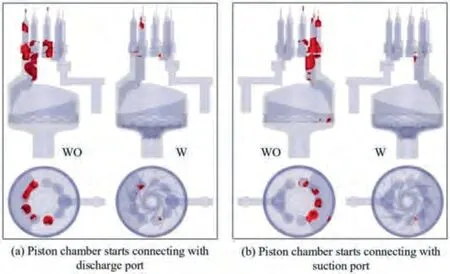
Fig. 12 Cavitation region of AHP with and without impeller(damage power > 106 W, inlet pressure = 1 bar, outlet pressure = 200 bar, rotational speed = 3000 r/min).
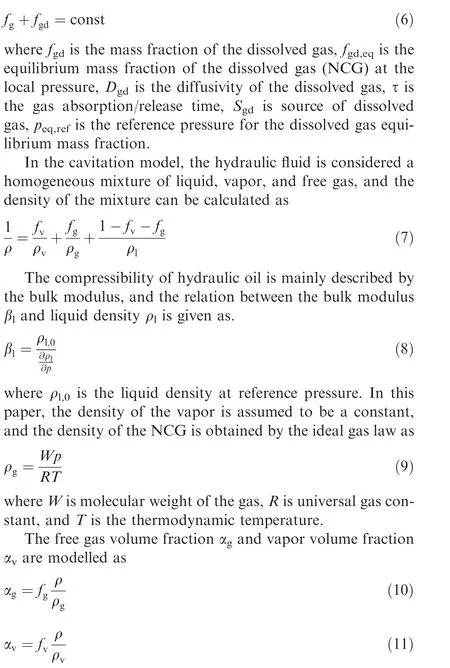
Fig.13 and Fig.14 show the evolution of the simulated gas volume fraction and vapor volume fraction distribution of a piston during the suction phase for the AHP with and without a boost impeller,respectively.The variables were presented on a special plane that passes through the centrelines of both the cylinder block and the cylinder bore. In these two figures, the intake stroke (from 0 to 0.5 T, where T is the time per revolution) is divided into 10 equal intervals. A large amount of gas(including air and vapor) is seen to be produced in the piston chamber for the pump without a boost impeller at the inlet pressure of 1 bar.In some serious areas,such as the lubrication passage, the gas and vapor volume fraction even reach 15%and 44%,respectively.Comparatively,almost no gas or vapor is produced inside the piston chamber for the pump with a boost impeller at the inlet pressure of 1 bar. Only a small amount of gas is found when the piston is just connected(0.05 T) and disconnected (0.45 T) with the suction port of the valve plate. Another remarkable effect commonly occurring during the suction stroke is the distribution of gas and vapor in the piston chamber.Centrifugal forces push the liquid that is of much higher density than the air and vapor bubbles on the outside of cylinder bores,leading to a radially inhomogeneous filling of the piston chambers.
7.1.2. Boost capacity and power cost of the impeller
Fig. 15 shows the comparison of the normalised flow into the suction chamber during one revolution with and without an impeller at the inlet pressure of 1 bar and speed of 3000 r/min. The normalised flow was originally obtained from the interface between the piston domain and the suction port of the valve plate domain,and it is defined by the ratio of the simulated flow to the theoretical flow.It is important to note that the suction flow equals the displacement of the piston pump if the mean value of the normalised flow in one revolution is 1.The black and red dotted lines represent the mean values of the suction flow with and without the impeller, respectively.As the marked values show,the mean value of the normalised suction flow increases from 0.941 to 0.974 on adding the impeller, implying that the suction performance of the AHP has been significantly improved.
Fig. 16 shows a comparison of the suction pressure of the AHP with and without the impeller. The suction pressure was obtained at specific points in the suction port of the valve plate. In addition, the dotted lines in the figure indicate the mean value of the pressure for the two cases.The suction pressure can clearly be increased significantly by adding the impeller. In particular, the mean value is increased from 0.94 to 1.65 bar, and the difference between these two values can be defined as the boost capacity of the impeller. Nevertheless,the impeller also significantly increases the suction pressure fluctuation;this issue needs to be further investigated and optimised in future studies. Similarly, the suction pressure under other speeds is presented in the form of span indicators through six beam stars and columns, respectively, as shown in Fig. 17. Clearly, both the boost capacity and fluctuation range become larger at higher speeds. At the rated speed of 4000 r/min, the mean value and lower limit are increased by 1.32 and 0.21 bar, respectively.
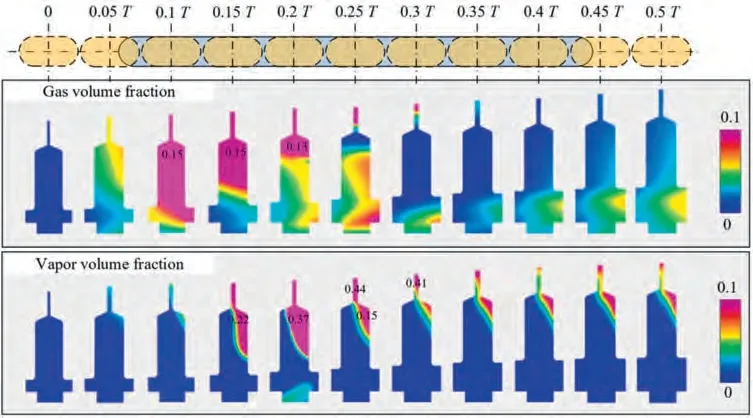
Fig. 13 Distributions of gas volume fraction and vapor volume fraction of two-dimensional region of a piston during suction phase(without boost impeller, inlet pressure = 1 bar, outlet pressure = 200 bar, rotational speed = 3000 r/min).
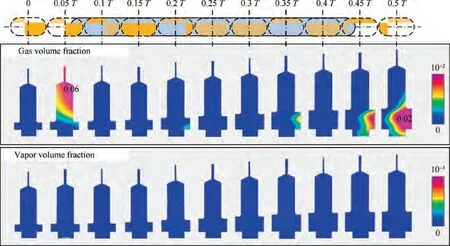
Fig. 14 Distributions of gas volume fraction and vapor volume fraction of two-dimensional region of a piston during suction phase(with boost impeller, inlet pressure = 1 bar, outlet pressure = 200 bar, rotational speed = 3000 r/min).
The output power of the boost impeller and piston pump can be obtained from the negative power corresponding to the work done per second by the fluid on the rotating boundaries (negative implies that the boundaries do work on the fluid). Furthermore, the total input power can be estimated by assuming the efficiency of the impeller and piston pump to be 0.7 and 0.9, respectively. Fig. 18 shows the input power diverted into the piston pump and the impeller as well as the percentage of the boost impeller. The columns show that the impeller shares such a small amount of the total input power that it is almost virtually invisible,particularly at lower speeds(i.e.1000,2000,and 3000 r/min.Even at higher speeds of 4000 and 5000 r/min, the power consumed by the impeller is 0.34 and 0.67 kW, respectively, which corresponds to approximately 2.17% and 3.34%, respectively. Thus, the impeller can be concluded to provide a considerable boost capacity while consuming very little of the input power supplied by the engine or electric motor.
7.2. Transient-condition analysis
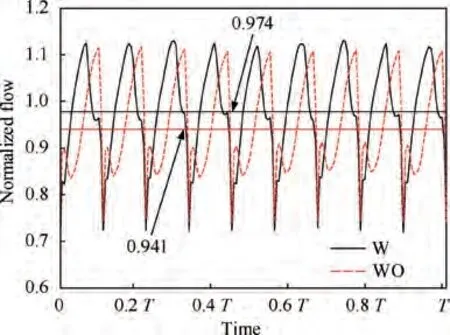
Fig. 15 Comparison of suction flow with and without impeller.
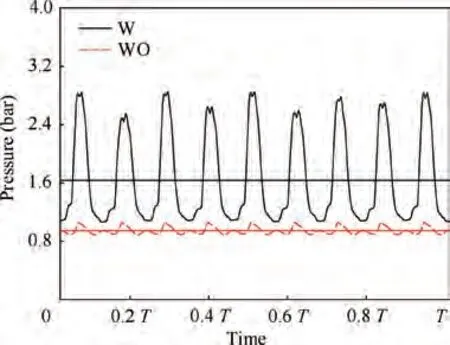
Fig. 16 Comparison of suction pressure with and without impeller.
In aerospace hydraulic systems, the pump is not always working under steady conditions. When a sudden load change causes the system pressure to exceed the lowest value of the pump’s pressure regulation range or when a sudden load change occurs while the system pressure is in the regulation range, the pump must rapidly adjust the output flow to meet the new load condition. These transient conditions, such as a steep increase from small to large flow, require that the swash plate be repositioned rapidly.In general,for a typical pressurecontrolled aerospace pump, a maximum response time of 50 msis recommended, and the transient time of the pump displacement change is lower than even 20 ms.Owing to the viscosity and inertia effects of the fluid, the flow supply upstream of the inlet pipeline cannot catch up with the rapid change in pump displacement. Therefore, the pump will inevitably encounter an instantaneous insufficient suction during the transient period. Although this phenomenon only last for tens of milliseconds,the destruction is cumulative and can lead to serious damage after hundreds of times.
In this section, we mainly focus on comparing the suction performance of the AHP with and without the boost impeller under transient conditions. The length and diameter of the inlet pipe are 3 m and 20 mm, respectively. The dimensionless wall roughness of the suction pipe can be obtained from the following equation:
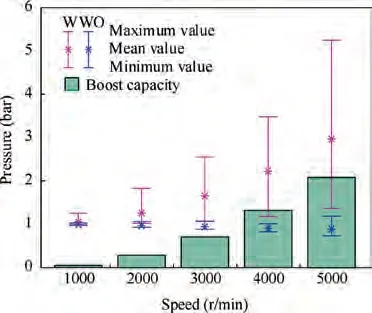
Fig. 17 Boost capacity of impeller.

Fig. 18 Power consumption of impeller.
where dis the hydraulic diameter of the pipe and Δ the equivalent uniform roughness of the pipe, value of which is 0.01-0.03 mm for the rubber hose.During simulations, the flow transient is implemented by ramping the swash-plate inclination from zero to maximum. The pressure-inlet boundary was applied on the upstream end of the suction pipe, and the value was set to 3 bar.
Fig.19 shows a comparison of the suction flow for the AHP with and without the boost impeller at a speed of 4000 r/min and transient time of 15 ms.The suction flow is obtained from the mass flux though the connecting interface between the piston and the suction port of the valve plate. The figure shows that the transient suction flow experienced a remarkable flow ripple and impact when the AHP was not equipped with the impeller; this phenomenon was not very obvious in the AHP with the inlet impeller.The enlarged figure of the transient period shows that the pump with the impeller is more capable of catching up with the sudden increase in flow demand.
Fig.20 presents the variation of pressure versus time before and after the impeller together with the pressure at the same place without an impeller. The pressure before the impeller is obtained from the pump inlet port, and the pressure after the impeller is obtained from the suction port of the valve plate. In general, all these four pressure curves experience a considerable undershoot and then gradually stabilise after several oscillation periods.As shown in Fig. 20(a),irrespective of whether an impeller is used, the pressure at the inlet port is almost the same under both small and large flow conditions.This is because the pressure at the pump inlet mainly depends on the pressure loss between the reservoir and the inlet port under steady conditions. However, owing to the impeller, the undershoot of the pressure at the inlet port is 0.25 bar lower than that without the impeller during the transient period.
Because the valve plate has no relief grooves or damping holes, the high-pressure fluid trapped in the dead volume of the piston chamber is injected into the low-pressure region when the suction port is opened.This leads to a larger pressure ripple at the suction port of the valve plate,as shown in Fig.20(b). Adding the impeller does not result in a significant improvement in terms of reducing the fluctuation amplitude;however, it increases the mean value of the suction pressure.In particular, the undershoot during the flow transient was increased by 0.7-1.0 bar owing to the boost impeller, which makes it difficult to achieve the vapor pressure.
8. Conclusions
This study applies CFD to explore the effect of an impeller on the suction performance of an AHP. Previous studies have demonstrated that the commercial CFD package used in this study is feasible for predicting cavitation in fluid machineries.Nevertheless, to make the study more reliable, the model of a reference pump was validated in an open-circuit test rig. A comparison of the discharge pressure and flow shows that this model can accurately reflect the delivery characteristics of the AHP. A comparison of flow inflection with and without the impeller revealed that the parameter settings to describe the cavitation of the hydraulic fluid are acceptable. The conclusions of this study are summarised below:
(1) The destructiveness of cavitation is cumulative and can manifest itself as serious damage over hundreds of hours. It is therefore important to avoid pump cavitation at all times, including under transient conditions.The design of the system and components should ensure that the required inlet pressure on the fluid at the pump is always maintained.
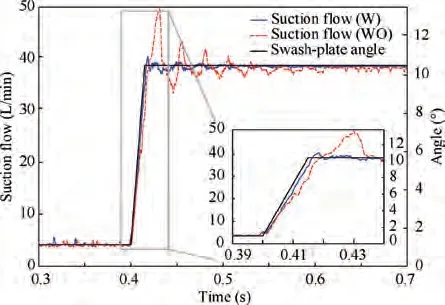
Fig. 19 Suction flow of piston pump with and without boost impeller under transient condition.
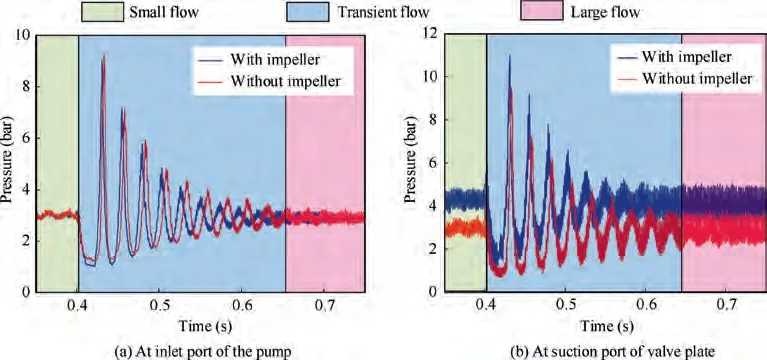
Fig. 20 Suction pressure curves with and without boost impeller under transient condition.
(2) The simulation results under steady-state conditions show that the boost impeller can effectively alleviate or even eliminate the cavitation damage caused by insufficient oil supply; however, it has no obvious effect on the cavitation caused by the back-flow jet.
(3) At the rated speed of 4000 r/min,the impeller adopted in the AHP can boost the mean value and lower limit of the suction pressure by 1.32 and 0.21 bar,respectively,while consuming only 0.34 kW (i.e. 2.17% of the total input power).
(4) Transient-condition analysis reveal that the pump with the impeller is more capable of catching up with a sudden increase in flow demand.Furthermore,the flow ripple into the suction chamber during the transient period can significantly be reduced by adding the impeller.
Although the boost impeller provides remarkable effects under both steady and transient conditions,it has some limitations, such as magnifying the suction pressure fluctuation under steady conditions and reducing the pressure at the inlet port. These issues can introduce difficulties and challenges in the design of such boost devices, and therefore, they should be investigated further.
The authors declare that they have no known competing financial interests or personal relationships that could have appeared to influence the work reported in this paper.
This work was financially supported by the National Natural Science Foundation of China (No. 51775013) and the Science and Technology Research Project of Jiangxi Provincial Department of Education (No. GJJ201914).