Optic nerve injury-induced regeneration in the adult zebrafish is accompanied by spatiotemporal changes in mitochondrial dynamics
An Beckers ,Luca Masin ,Annelies Van Dyck ,Steven Bergmans ,Sophie Vanhunsel ,Anyi Zhang ,Tine Verreet,Fabienne E.Poulain,Karl Farrow,Lieve Moons,
Abstract Axonal regeneration in the central nervous system is an energy-intensive process.In contrast to mammals,adult zebrafish can functionally recover from neuronal injury.This raises the question of how zebrafish can cope with this high energy demand.We previously showed that in adult zebrafish,subjected to an optic nerve crush,an antagonistic axon-dendrite interplay exists wherein the retraction of retinal ganglion cell dendrites is a prerequisite for effective axonal repair.We postulate a ‘dendrites for regeneration’ paradigm that might be linked to intraneuronal mitochondrial reshuffling,as ganglion cells likely have insufficient resources to maintain dendrites and restore axons simultaneously.Here,we characterized both mitochondrial distribution and mitochondrial dynamics within the different ganglion cell compartments (dendrites,somas,and axons) during the regenerative process.Optic nerve crush resulted in a reduction of mitochondria in the dendrites during dendritic retraction,whereafter enlarged mitochondria appeared in the optic nerve/tract during axonal regrowth.Upon dendritic regrowth in the retina,mitochondrial density inside the retinal dendrites returned to baseline levels.Moreover,a transient increase in mitochondrial fission and biogenesis was observed in retinal ganglion cell somas after optic nerve damage.Taken together,these findings suggest that during optic nerve injury-induced regeneration,mitochondria shift from the dendrites to the axons and back again and that temporary changes in mitochondrial dynamics support axonal and dendritic regrowth after optic nerve crush.
Key Words:axonal regeneration;central nervous system;dendrite remodeling;energy metabolism;fission;mitochondria;mitochondrial trafficking;optic nerve crush;retina;zebrafish
Introduction
As adult mammals lack the capacity to repair or replace injured neurons,neurodegeneration or central nervous system (CNS) trauma is irreversible.Although functional regeneration is still not possible,several pro-regenerative strategies have been identified,some by studying optic nerve regeneration.One key advantage of the eye-to-brain pathway is that the dendrites and axons of the retinal ganglion cells (RGCs) are spatially segregated,i.e.in the inner plexiform layer (IPL) of the retinaversus
the retinal nerve fiber layer (NFL) and optic nerve,respectively.This creates the opportunity to separately investigate the injury-induced growth responses of these neuronal compartments and identify the crucial pathways/molecules underlying axon but also dendrite regrowth (Bollaerts et al.,2018).Using regenerationcompetent adult zebrafish,we previously revealed that the RGC dendrites immediately retract after an optic nerve crush (ONC),in which RGC axons are disrupted.After this dendritic retraction phase,the axons start to regrow.Upon contact initiation in the optic tectum,the visual target area of the fish brain,the RGC dendrites are triggered to regrow,leading to visual recovery.Strikingly,preventing dendritic retraction perturbed axonal regeneration,suggesting an antagonistic axon-dendrite interplay wherein dendritic retraction is a prerequisite for effective axonal repair (Beckers et al.,2019).This segregation of axonal and dendritic regeneration might be the result of a neuronal energy restriction that prevents simultaneous (re)growth of axons and maintenance/repair of dendrites.Neurite (re)growth indeed requires a massive amount of adenosine triphosphate (ATP).Mitochondria become,however,depolarized after axonal injury (Beck et al.,2012;Zhou et al.,2016)and translocation of healthy mitochondria towards the growth cone might thus be needed to promote axonal regeneration.Unfortunately,mitochondria are mostly stationary in mature mammalian neurons,but experimentally enhancing mitochondrial transport has been reported to accelerate axonal regrowth in several injury models (Zhou et al.,2016;Cartoni et al.,2017).In fact,also in regeneration-competent animals,axonal mitochondrial transport is known to rise (Han et al.,2016;Xu et al.,2017).These findings indicate that augmented axonal mitochondrial transport is critical for successful axonal regeneration.
One mechanism underlying network restoration in the zebrafish ONC model might be a delivery of functional mitochondria to the axons for axonal regrowth followed by their relocation to the dendrites to support dendritic repair.In addition to mitochondrial transport,other mitochondrial dynamic processes could support axonal/dendritic regrowth including:(1) mitochondrial biogenesis,i.e.the increase in mitochondrial mass and subsequent division of mitochondria;(2) mitochondrial fission,yielding smaller,and more mobile mitochondria;(3) mitochondrial fusion,yielding larger mitochondria with higher energy production capacity;and (4)mitophagy,i.e.removing (damaged) mitochondria,providing building blocks for biogenesis (Yang et al.,2013).
In this study,we aimed to investigate whether the mitochondrial distribution inside RGC dendrites,somas,and axons shifts after ONC in zebrafish.Various mitochondrial dynamics were characterized in the regrowing RGCs to determine whether these processes play a role in circuit repair.Finally,two stable transgenic zebrafish lines,in which mitochondrial fission is specifically altered in the RGCs,were used to investigate how this process affects axonal regrowth after ONC.
Methods
Animals
Zebrafish (Danio rerio
) were bred in our fish facility and housed under standard laboratory conditions,with 15 fish per tank (ZebTec 3.5 L tanks) at 28°C on a 14-hour/10-hour light/dark cycle.Fish were fed twice daily with dry food and brine shrimp.All experiments were performed on equally sized 5-month-old zebrafish of either sex and were approved by the Katholieke Universiteit Leuven Animal Ethics Committee (P121/2018) on September 11,2018 and executed in strict accordance with the European Communities Council Directive of 20 October 2010 (2010/63/EU).We used AB wild-type(WT) zebrafish and the following transgenic lines:Tg(isl2b:mitoeGFP-2ATagRFPCAAX)
(from now on referred to as MitoeGFP fish),in which theisl2b
promotor drives the RGC-specific expression of MitoeGFP and TagRFPCAAX,respectively labelling mitochondria and plasma membranes (Verreet et al.,2019),Tg(isl2b:TagBFP-Drp1-pA)
,in which mitochondrial fission is enhanced specifically in RGCs due to dynamin-related protein 1 (Drp1)overexpression (OE),andTg(isl2b:TagBFP-dnDrp1(K38A)-pA)
with reduced fission due to dominant-negative (DN) Drp1 expression (referred to as Drp1 OE and Drp1 DN zebrafish,respectively).The transgenic lines were created by Prof.Dr.F.Poulain and Dr.T.Verreet (Department of Biological Sciences,University of South Carolina,Columbia,SC,USA).In total 40 AB WT fish,86Tg(isl2b:mitoeGFP-2A-TagRFPCAAX)
,13Tg(isl2b:TagBFP-Drp1-pA)
and 14Tg(isl2b:TagBFP-dnDrp1(K38A)-pA)
were used to perform all experiments in this study.The exact numbers of fish used/analyzed per experiment are depicted as individual data points in the corresponding graphs and are reported in the corresponding figure legends.Generation of transgenesis vectors
All expression vectors were constructed using the Tol2kit Gateway cloning system,as described by Kwan et al.(2007).For cloningdrp1
cDNA,zebrafish mRNA was isolated from embryos at 48 hours post-fertilization (hpf) using Trizol and the RNeasy mini kit (Qiagen,Hilden,Germany),and cDNA was prepared from RNA using the SuperScript III First-Strand Synthesis system(Thermo Fisher Scientific,Waltham,MA,USA).Drp1
cDNA was amplified using the full-length primersdrp1-fw
:5′-ATG GAG GCT CTT ATT CCT GTC-3′anddrp1-rv
:5′-TCA CCA CAA GTG CGT CTC-3′.The obtained amplicon was subcloned into PCRII-TOPO (Thermo Fisher Scientific) and sequenced to verify gene identity (sequencing by Eton Bioscience,San Diego,CA,USA).ThepCRIIdrp1
plasmid was then used as a template to generate adnDrp1
cDNA using a primer encoding the K38A mutation:dnDrp1-fw
:5′-ATG GAG GCT CTT ATT CCT GTC ATT AAC AAA CTC CAG GAT GTT TTT AAC ACA GTC GGG GCG GAC ATT ATC CAG CTG CCT CAA ATT GCG GTG GTG GGG ACG CAG AGT AGC GGG GCG AGT TC-3′.We generatedpME-TagBFP-Drp1
andpME-TagBFP-dnDrp1(K38A)
entry clones by adding the coding sequences of TagBFP (Evrogen,Moscow,Russia) and a linker peptide (amino acid sequence:SGLRSRV) to the 5’ end of drp1 using BP-compatible primers.The entry plasmidsp5E-isl2b-gata2a
(Spead et al.,2021),pME-TagBFP-Drp1 (or dnDrp1)
,andp3E-polyA
(Kwan et al.,2007) were recombined into the pDestTol2pA2 destination vector to generate theisl2b:TagBFP-Drp1-pA
andisl2b:TagBFP-dnDrp1(K38A)-pA
transgenesis constructs.ThepTol2pA2-isl2b:mitoeGFP-2A-TagRFPCAAX
was generated as described previously (Verreet et al.,2019).Generation of stable transgenic lines
Transgenic lines were generated using the Tol2 transposon method as described previously (Kawakami et al.,2000).10 to 40 pg of purified DNA(pTol2pA2-isl2b:mitoeGFP-2A-TagRFPCAAX
,pTol2pA2-isl2b:TagBFP-Drp1-pA
,orpTol2pA2-isl2b:TagBFP-dnDrp1(K38A)-pA
) was co-injected with 25 pg of synthetic mRNA encoding Tol2 transposase at one-cell stage.Injected embryos with transient expression of transgenes were raised to adulthood as F0 generation.F0 fish were then out-crossed to WT to screen for positive F1 embryos expressing the transgenes.Transgenic F1 carriers were subsequently out-crossed to WT to generate stable lines with a single-copy insertion.ONC injury
An ONC injury was performed as previously described (Beckers et al.,2019,2021;Van Dyck et al.,2021).In brief,zebrafish were anesthetized by submersion in buffered 0.03% tricaine (w/v in system water) (MS-222,MilliporeSigma,Burlington,MA,USA).Sterile forceps were used to remove the connective tissue surrounding the left eye,allowing it to lift the eyeball out of its orbit and expose the optic nerve.Hereafter,the optic nerve was crushed for 10 seconds at a 0.5 mm distance from the optic nerve head using Dumont #5 tweezers (Fine Science Tools,FST,Heidelberg,Germany).The eye was placed back and fish were returned to the ZebTec system to recover.
Metabolic assay
Energy expenditure was measured via a metabolic assay using the watersoluble sodium salt resazurin (Abcam,Cambridge,UK),a non-fluorescent blue dye that is metabolically reduced to the pink-fluorescent resorufin by nicotinamide adenine dinucleotide (NADH2).After weighing,fish were randomly assigned to an ONC injury or sham procedure (wherein fish are sedated,the connective tissue around the eye is removed and the eyeball is gently tilted out of its orbit,thereby exposing the optic nerve without crushing it),and were placed in individual glass containers containing 100 mL of resazurin solution (0.002 mg/mL tank water).Water samples were collected after a 48-hour fasting period.Fluorescence intensities (excitation 530 nm,emission 590 nm) of the water samples were measured (in duplicate)using a FLUOstar Omega plate reader (BMG Labtech,Ortenberg,Germany)and analysis was performed as previously described (Reid et al.,2018).
Visualization of intraneuronal mitochondrial distribution
Mitochondrial distribution in the different RGC compartments was visualized at baseline (indicated as naive) and at various days after ONC (1,3,4,6,10,14,21,and/or 42 days post-injury (dpi)) inside the retina (10 µm cryosections and retinal whole mounts),in the optic nerve/tract (10 µm cryosections of the complete visual system) and the optic tectum (50 µm vibratome sections).All samples described above were prepared fromTg(isl2b:mitoeGFP-2ATagRFPCAAX)
fish as previously described (Beckers et al.,2019;Van Dyck et al.,2021) and were stained with 4′,6-diamidino-2-phenylindole (DAPI,MilliporeSigma) to visualize nuclei,after which images were taken using an Olympus FV1000 confocal microscope (Olympus,Tokyo,Japan) with a 60x objective.For the retinal whole mounts,z-stack pictures were taken through the NFL,retinal ganglion cell layer (RGCL),and IPL,whereafter separate projection images were made for each layer.Quantification of intraneuronal mitochondrial distribution
The MitoeGFParea was quantified inside the retina ofTg(isl2b:mitoeGFP-2A-TagRFPCAAX)
fish using an in-house developed Python script,both at baseline and after injury.A detailed description of this quantification method is provided in the supplementary data (Additional Figures 1
and2
).In brief,the MitoeGFParea,representing all mitochondria,was assessed on four individual high-quality z-stacks per retinal whole mount,covering the NFL,RGCL,and IPL.The IPL was further subdivided into four layers (Sublaminae 1 to 4,S1–S4),based on the strata visualized by immunostaining for choline acetyltransferase (Chat) (see immunofluorescent stainings section for the method) (Additional Figure 2
).The percentage of MitoeGFParea was plotted in function of the retinal position/layer and averaged for all fish per condition.Using the area under the curve,bar graphs were made representing the MitoeGFParea per retinal layer and condition.In the optic nerve/tract and optic tectum,the % of MitoeGFParea was quantified by outlining the region of interest (optic nerve head,optic nerve before the crush site,optic nerve after the crush site,optic tract or the stratum opticum (SO) and stratum fibrosum et griseum superficiale (SFGS) of the optic tectum) on visual system sections or brain vibratome sections using ImageJ 1.53i (National Institutes of Health,Bethesda,MD,USA,RRID:SCR 003070).Using automatic Otsu thresholding,an intensity threshold for the MitoeGFParea was set and the obtained value was divided by the surface of the outlined area.Analysis was performed on three to five sections per fish.For all analyses,data of the noninjured fish were set to 100% and all values were put relative to these naive values.Immunofluorescent stainings
To investigate mitochondrial dynamics,immunostainings for proliferatoractivated receptor gamma coactivator 1 α (mouse-anti-Pgc-1α,mitochondrial biogenesis,1:100,Santa Cruz Biotechnology,Santa Cruz,CA,USA,Cat# sc-518025,RRID:AB_2890187),phosphorylated (serine 616) dynamin-related protein 1 (rabbit-anti-p-Drp1,fission,1:350,Cell Signaling,Danvers,MA,USA,Cat# 4494,RRID:AB_11178659),optic atrophy 1 protein (mouse-anti-Opa1,fusion,1:1000,BD Biosciences,San Jose,CA,USA) and phosphatase and tensin homologue-induced putative kinase 1 (rabbit-anti-Pink1,mitophagy,1:1000,Cayman Chemical Company,Ann Arbor,MI,USA,Cat# 10006283-1,RRID:AB_409027) were performed on retinal cryosections of WT zebrafish,harvested at baseline and various days post-ONC (1,3,6,10,and 14 dpi).All sections were blocked using pre-immune donkey serum for one hour at room temperature.Primary antibodies were incubated overnight at room temperature and visualized using alexa-conjugated secondary antibodies(1:200,Thermo Fisher Scientific,incubated for 2 hours at room temperature).All sections were counterstained with DAPI (1:1000,MilliporeSigma),and imaged with a 60× objective on a confocal microscopy (Olympus) using a similar exposure time for all images to be compared.
An immunostaining for choline acetyltransferase (goat-anti-Chat,1:100,MilliporeSigma,Cat# AB144P,RRID:AB_90661) was used to visualize the strata of the IPL in the retinal whole mounts.Thereto,the whole mounts were permeabilized using a freeze-thaw step in 0.5% Triton X-100 in phosphatebuffered saline (15 minutes,–80°C) and afterwards blocked using preimmune donkey serum for 1 hour at room temperature.The primary antibody was incubated overnight at room temperature and visualized using an Alexaconjugated secondary antibody (1:200,Thermo Fisher Scientific,incubated for 2 hours at room temperature).
Tracing and quantification of tectal (re)innervation
(Re)innervation of the optic tectum was assessed in naive and injured fish using biocytin as an anterograde tracer (Beckers et al.,2019).In brief,fish were anesthetized,the optic nerve was transected between the eye and the crush site and a piece of gelfoam soaked in biocytin (MilliporeSigma) was placed on the nerve stump.After 3 hours,brains were dissected and biocytin(MilliporeSigma) was visualized on 50 µm-thick transverse vibratome sections using a Vectastain ABC kit (Vector Laboratories,Burlingame,CA,USA),using diaminobenzidine as chromogen.Histological photographs were acquired with a Zeiss imager Z1 with a 10x objective.Tectal (re)innervation was quantified via an in-house developed ImageJ script in the SO and SFGS of the optic tectum as previously described (Beckers et al.,2019).Per fish,tectal (re)innervation was analyzed on at least five sections containing the central optic tectum,and four to six animals were used per condition.The pia mater,the innermost layer of the meninges,was removed from the pictures to improve visualization of reinnervation in the optic tectum.In all experiments,tectal innervation of naive WT fish was set as a 100% reference value,and other values were put relative to this control.
Statistical analysis
All data are represented as mean ± standard error of mean (SEM),except for the mitochondrial area profiles,which are shown as mean ± 95% confidence intervals.The value ofn
represents the number of animals used per condition.All statistical tests were performed using Graphpad Prism 9.02 (GraphPad Software,San Diego,CA,USA,www.graphpad.com).In all cases,raw data were tested for normal distribution using the Kolmogorov-Smirnov normality test and variance between groups was checked via the Brown-Forsythe’s test.To evaluate a difference between two or more groups,two-tailed Student’st
-test or one-way analysis of variance (ANOVA) followed by Tukey’spost hoc
test was performed,respectively.When the analysis of variance assumptions were violated,a Kruskal-Wallis test was used.P
-values <0.05 are considered statistically significant and are indicated on the graphs.Results
Estimation of energy expenditure after ONC
Using a non-invasive test that is based on the reduction of resazurin,we first confirmed that zebrafish subjected to ONC have a higher energy expenditure,compared to sham-operated animals (Additional Figure 3
).As we assumed an energy boost in the RGCs initiating axon regrowth early after ONC,we next investigated mitochondrial distribution and dynamics within these neurons during the regeneration process.Mitochondrial distribution in the retina after ONC
To first decipher whether mitochondria translocate within the different compartments of RGCs during their spontaneous injury-induced regrowth in adult zebrafish,mitochondrial distribution was studied using retinal whole mounts of naive and injured MitoeGFP zebrafish throughout the different regeneration phases:(1) the dendritic retraction phase (1–3 dpi),(2) the axonal regrowth phase (3–6 dpi) and the dendritic regrowth phase,occurring upon target reinnervation (6–14 dpi).Confocal z-stack images revealed GFPmitochondria in the IPL,RGCL,and NFL of naive retinas.Upon ONC,mitochondrial quantities decreased in the IPL from 3–10 dpi,whereafter they restored to baseline levels (Figure 1A
).In the RGCL,a strong increase in mitochondrial number and a more scattered mitochondrial distribution were observed at 3 dpi.This spread-out mitochondrial arrangement remained observable in the RGCL until ±14 dpi.Three weeks after injury,the mitochondrial labeling in the RGCL was comparable to that of naive retinas(Figure 1B
).No obvious changes in mitochondrial appearance were noted in the NFL throughout the regenerative process (data not shown).Similar observations were made using sagittal cryosections of naive and injured eyes(Figure 1C
).At 3 dpi,the number of mitochondria in the IPL was reduced,and minimal mitochondrial levels were reached at 6 dpi.Strikingly,at 3–6 dpi,mitochondria in the most inner IPL appeared as MitoEGPstripes sprouting from the RGC somas,presumably visualizing mitochondrial accumulation in the primary dendrites.A high magnification image inAdditional Figure 4
shows that numerous mitochondria are present in the primary dendrite,visualized by the red membrane tag at 3 dpi,in contrast to what is observed in the control condition.Together with the reduced mitochondrial density in the outer IPL,these data suggest that mitochondria redistribute from random in the dendritic tree towards the RGC primary dendrite after injury.The number of mitochondria in the IPL remained low at 10 dpi,although a notable increase was detected in the most outer IPL,adjacent to the inner nuclear layer (INL).Afterwards,mitochondrial numbers raised again to reapproach baseline levels 2 to 3 weeks after injury (Figure
1C
).In the RGCL,a transient rise in mitochondrial levels was observed at 3 dpi.In the NFL,no obvious changes in mitochondrial density were detected using the retinal cryosections.Using an in-house developed Python script,we quantified the MitoeGFP+area throughout the IPL,RGCL,and NFL of whole-mounted retinas,harvested at different time points after ONC injury (Figure 2
andAdditional Figure 5
).To differentiate the processes ongoing in the entire IPL,it was divided into four sublaminae,S1 to S4,with S1 being closest to the RGCL (Additional Figure 2
).For the IPL S2–S4 sublaminae,closest to the INL,the data were found to be quite similar and combined to reduce complexity.In these IPL S2–S4 strata,the mitochondrial positive area drastically declined at 6 and 10 dpi (Figure 2
).Two weeks after injury,the percentage of GFP labeling reapproached baseline levels again.Of note,in IPL S4 sublamina,a rise in MitoeGFParea was already detectable from 10 dpi onwards (Additional Figure 5
),which matches the presence of numerous mitochondria close to the INL visualized inFigure 1A
.In the IPL S1,more mitochondrial mass was present at 3 dpi,plausibly due to the mitochondrial accumulation in the primary dendrites observed at thistime point (Additional Figure 5
),whereafter baseline levels were restored.In the RGCL,a similar increase in MitoeGFParea was present three days after injury (Figure 2
).Finally,in the NFL,which is thinner and more difficult to delineate,the variation within conditions was substantially larger than in the other layers,and therefore no significant differences could be obtained(Additional Figure 5
).All in all,these data indicate that ONC in adult zebrafish triggers a transient increase in mitochondrial mass in the RGC somata,which coincides with a decrease and later a rise in mitochondria in the IPL.These findings are suggestive of mitochondrial reshuffling during the regenerative process,first from the dendrites to the axons to boost their repair,and then back to the dendrites to support their regrowth.
Mitochondrial distribution in the optic nerve after ONC
Hereafter,we specifically investigated mitochondrial appearance/density in the RGC axons at early time points after ONC using horizontal visual system sections of MitoeGFP zebrafish.Morphometric analyses were performed at four different locations:at the optic nerve head (1),in the optic nerve before(2) or after the crush site (3),and in the optic tract (4) (Figure 3A
).As it is well known that the regenerating axons are located just past the site of impact at three days post-ONC in adult zebrafish (Beckers et al.,2019),we quantified mitochondrial area in the first two positions at 1 and 3 dpi.The mitochondrial area in the more distal axonal regions was assessed at 3 and 4 dpi,time points at which the (pioneering) axons are located in the optic tract but have not reached the optic tectum yet (Beckers et al.,2019).In general,and to our surprise,the MitoeGFParea was decreased at all locations after ONC injury,indicating that less mitochondria were present in the damaged optic nerve/tract as compared to the naive situation (Figure 3B
andC
).Notably,enlarged mitochondrial deposits were observed after the crush site in the optic nerve and optic tract at 1,3,and 4 dpi (Figure 3B
).Mitochondrial distribution in the optic tectum after ONC
We also aimed to characterize mitochondrial distribution in the optic tectum at various time points after ONC using coronal optic tectum sections of MitoeGFP zebrafish (Figure 4A
).To link mitochondrial presence with axonal degeneration and regeneration,we made use of the RFPmembrane tag.At baseline,MitoeGFPmitochondria were clearly located inside the RFPaxons,which remained unchanged until 1 day after optic nerve injury (Figure 4B
andC
).At 3 dpi,the mitochondrial signal,as well as the RFP fluorescence,was drastically decreased,possibly indicative of axonal degeneration.Both MitoeGFPand RFPlabeling were found to slightly reappear at 6 dpi,and were fully restored to baseline levels from 10 dpi onwards,known to be thetime point at which tectal reinnervation is completed in adult nerve-crushed zebrafish (Beckers et al.,2019).Thus,our findings suggest that,while RGC axonal degeneration in the tectal innervation areas coincides with the loss of mitochondria,axonal reinnervation is strongly linked with a return of these energy-producing organelles.Characterization of mitochondrial dynamics in the retina after ONC
To substantiate our findings showing a differential mitochondrial distribution inside the retina after ONC,we next determined mitochondrial dynamic processes in the RGCs,including biogenesis,fission/fusion,and mitophagy,using immunofluorescent stainings for respective markers on retinal cryosections of WT zebrafish at different time points after ONC.Mitochondrial biogenesis was evaluated using Pgc-1α,a key regulator and well-known marker of this process.In naive fish,only a few RGCs were found positive for Pgc-1α,but increased mitochondrial biogenesis in RGC somas could be clearly detected at two defined time points post-injury,namely at 1 dpi and from 6–10 dpi (Figure 5
).The expression of p-Drp1 (Ser616),a widely used pro-fission marker,was marginally increased in RGC somas at 3 dpi,but reached higher levels 6 days after ONC.At 10 dpi,p-Drp1 immunoreactivity was already lowered compared to 6 dpi,but baselines levels were only reached 2 weeks after optic nerve damage.Immunostaining for Opa1 was used to mark fusion,but no major spatiotemporal changes were observed in the retina at any time point after ONC,except for (1) a marginal rise in Opa1 immunofluorescence in the RGC somas,and (2) occasional appearance of Opa1 staining in a dendritelike pattern in the IPL,close to the RGCL,both between 6 and 14 dpi.Note that for these three dynamic processes (biogenesis,fission,and fusion) the figures mainly show the RGCL,as no obvious changes were visible in the central/outer IPL.Mitophagy,however,studied using immunolabeling for Pink1,was not found to change in the RGC somas but increased at 3 and 6 dpi in both the NFL and IPL.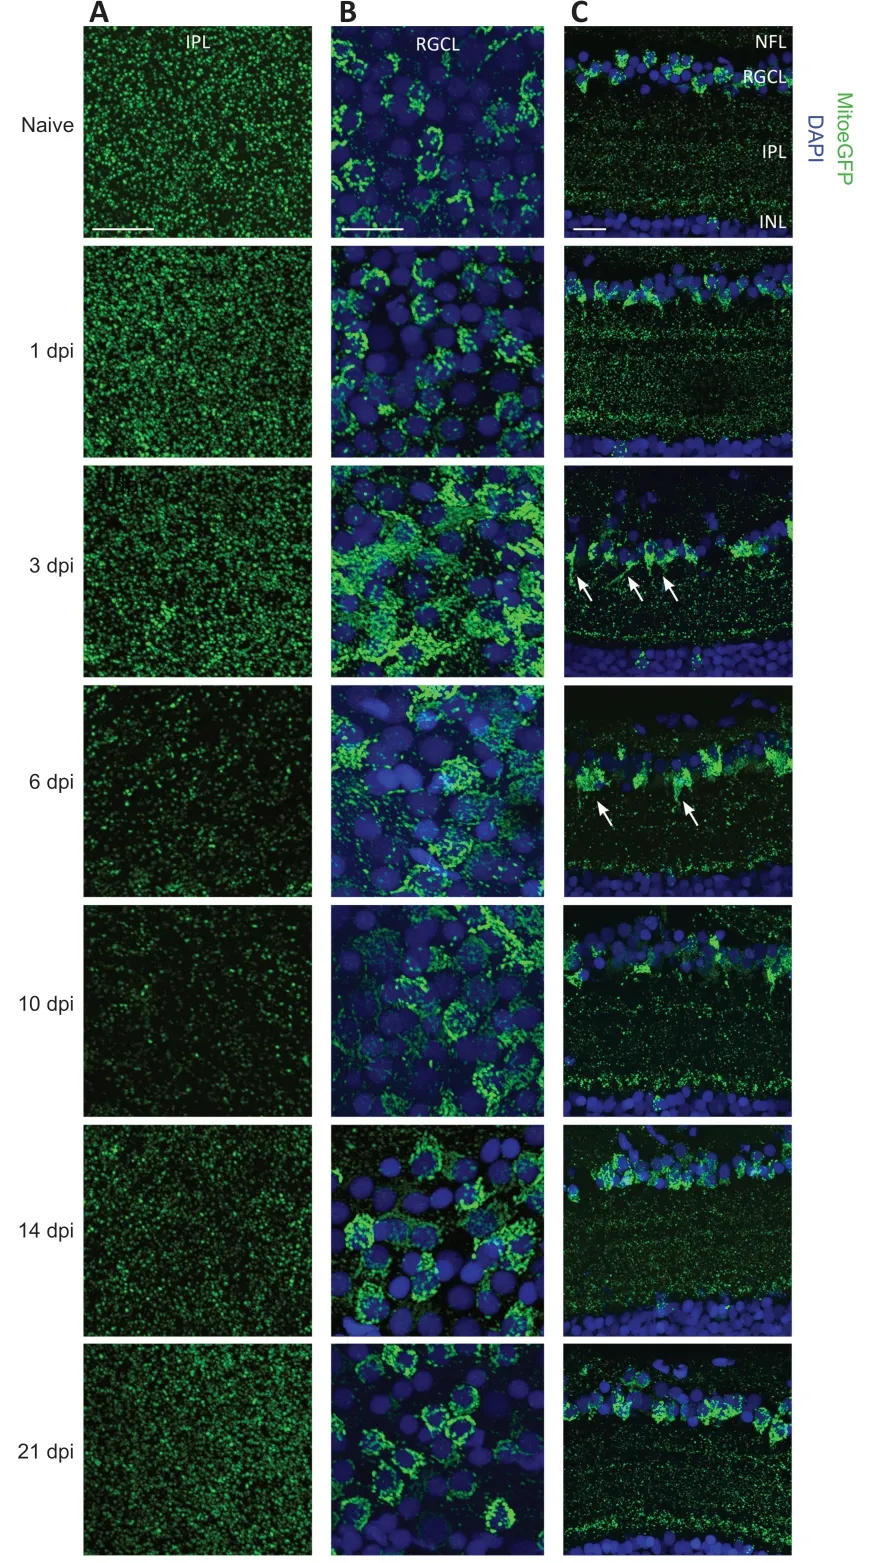
Figure 1 | Mitochondrial distribution visualized on whole mounts and cryosections of MitoeGFP+ retinas,harvested at baseline (naive) or after ONC injury.
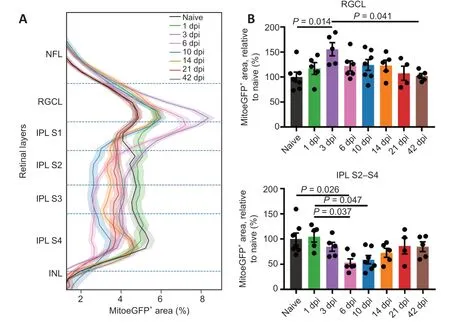
Figure 2 | Inner retinal MitoeGFP+ area profile,combined with bar graphs representing the results per retinal layer,at baseline (naive) or after ONC injury.
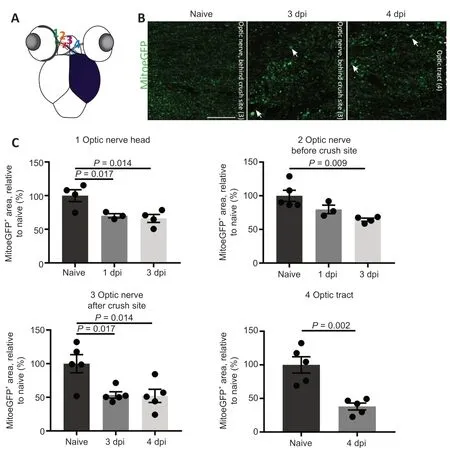
Figure 3 | Mitochondrial distribution visualized and quantified on cryosections of MitoeGFP+ visual systems,harvested at baseline (naive) or after ONC injury.
All in all,we observed in adult zebrafish subjected to ONC that (1) mitochondrial biogenesis is upregulated in two phases (1 and 6–10 dpi),(2) fission is enhanced from ±1–10 dpi,and (3) mitophagy is increased at 3 and 6 dpi.
Optic tectum (re)innervation in zebrafish with altered mitochondrial fission
To gain further insight into the role of mitochondrial fission in CNS regeneration,anterograde biocytin tracing was used to quantify injuryinduced axonal regrowth in stable transgenic zebrafish lines with disturbed mitochondrial fission specifically in RGCs.In both uninjured Drp1 dominantnegative (DN) and Drp1 overexpression (OE) fish,tectal innervation was found to be similar in comparison to uninjured WT zebrafish (data not shown).However,at 6 dpi a significant reduction in axonal regrowth was detected in the Drp1 OE group,as compared to WT fish,suggesting that enhanced mitochondrial fission is detrimental to axon repair (Figure 6A
).Strikingly,tectal reinnervation was elevated at 6 dpi in the Drp1 DN animals,in which mitochondrial fission is (partly) blocked due to the presence of DN Drp1 proteins (Figure 6B
).Both findings thus indicate that augmented fission has a delaying effect on axon regrowth.As mitochondrial size can affect energy production,i.e.large mitochondria can produce more ATP and vice versa (Hoitzing et al.,2015),we estimated energy expenditure after optic nerve injury of transgenic and WT zebrafish using a resazurin assay.Strikingly,the resorufin fluorescence of the water samples that contained the ONC-subjected Drp1 OE animals was significantly lower,compared to those containing crushed WT or Drp1 DN fish (Additional
Figure 6
).As such,it is tempting to speculate that the lower level of energy expenditure in these fission-enhanced animals might underlie the reduced axonal regeneration.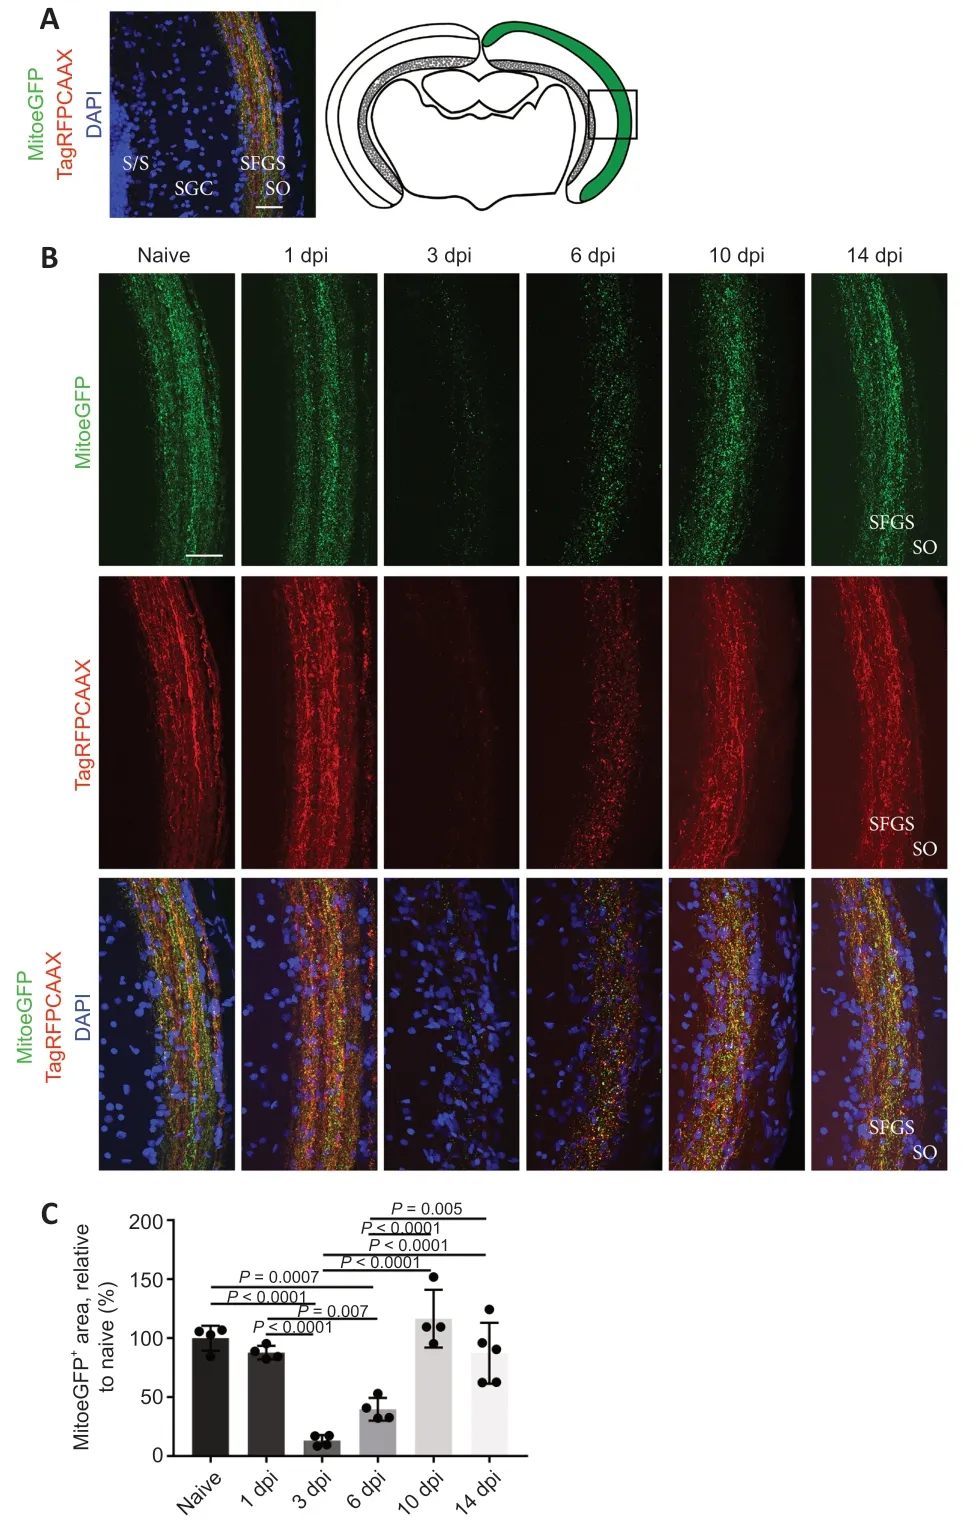
Figure 4 | Mitochondrial distribution visualized on vibratome sections of MitoeGFP+optic tecti,harvested at baseline (naive) or after ONC injury.
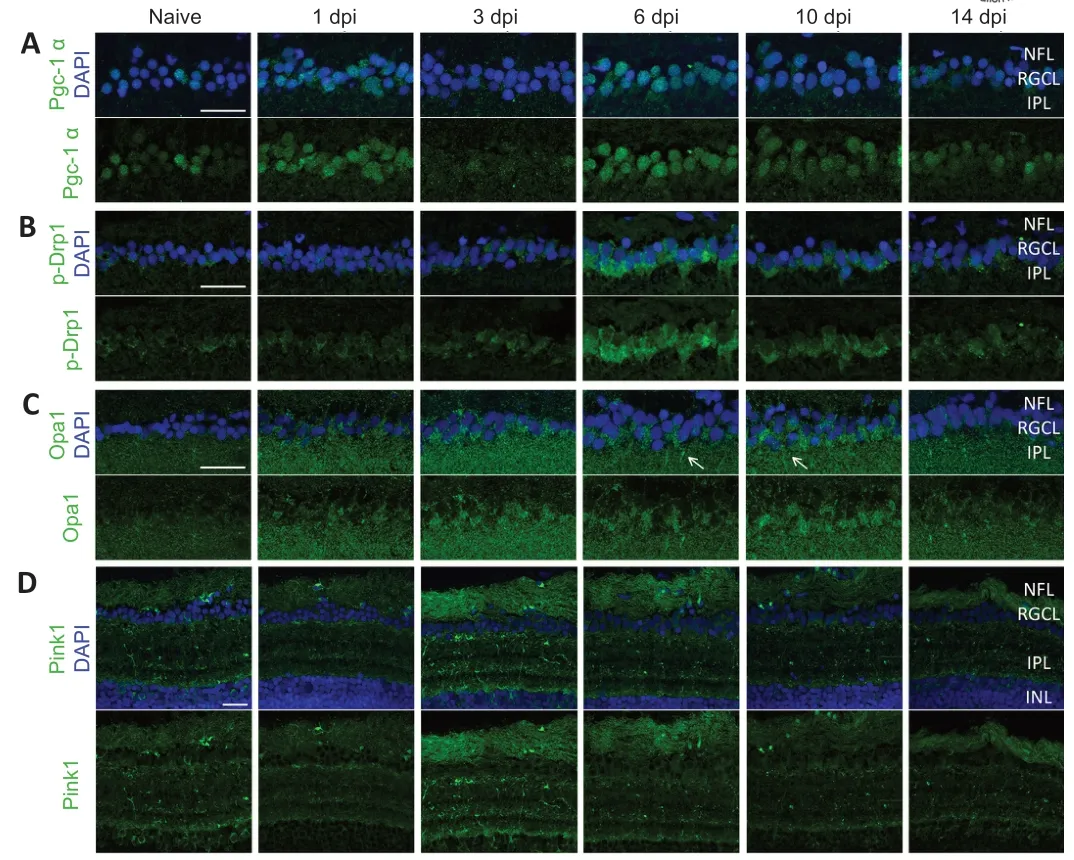
Figure 5 | Immunofluorescent stainings for Pgc-1α,p-Drp1,Opa1,and Pink1 on cryosections of WT retinas,harvested at baseline (naive) or after ONC injury.
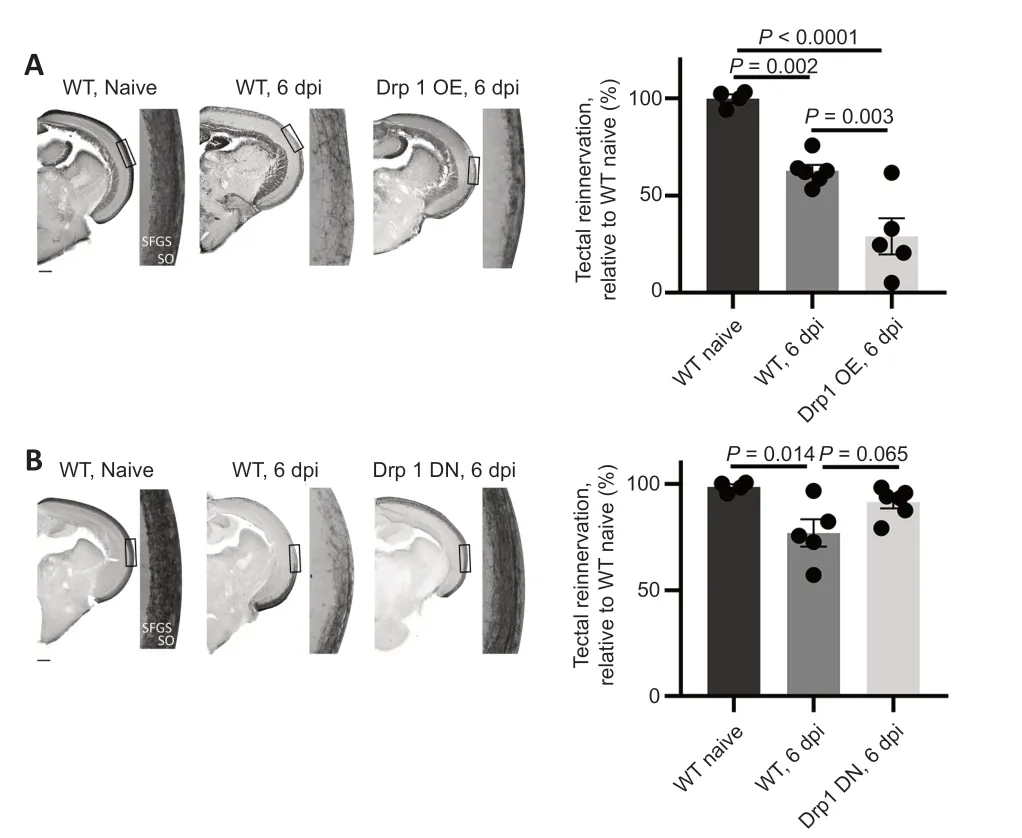
Figure 6 | Quantification of tectal (re)innervation in WT,Drp1 OE,and Drp1 DN zebrafish at 6 days post-ONC (overview images and high magnification images from boxed areas).
Discussion
Axonal regrowth after injury highly depends on sufficient energy to enable growth cone formation and motility (Letourneau,2016;Zhu et al.,2018).Unfortunately,axonal trauma triggers mitochondrial depolarization at the injury site,so the resident pool of mitochondria is incapable of supporting axonal repair (Patrón and Zinsmaier,2016;Zhou et al.,2016).We previously showed that in adult zebrafish the dendrites of the RGCs immediately retract after axonal injury,prior to the start of spontaneous axonal regeneration,and that they are only triggered to regrow after synaptic contact restoration(Beckers et al.,2019).Based on these data,we hypothesized that energy reallocation in the RGC neuronal compartments underlies this ‘dendrites for regeneration’ paradigm.
In this study,we have shown that both the mitochondrial distribution and dynamic processes change during the different regeneration phases after ONC (an overview is given inAdditional Figure 7
).In the retina,a transient reduction of mitochondria in the RGC dendrites was observed within the first days after ONC (1–3 dpi,dendritic retraction phase),possibly linked to anterograde dendritic mitochondrial transport towards the somas/axons.Both the ‘dendrite-like’ mitochondrial clustering in the primary dendrites located in the inner IPL (IPL S1),and the higher mitochondrial levels in the RGC somas,support the idea of dendrite-to-soma/axon movement.The observed fission response in the RGC cell bodies at this time,probably underlying the scattered mitochondrial appearance in the RGCL,could also be beneficial to improve mitochondrial trafficking,as smaller mitochondria are more mobile(Misgeld and Schwarz,2017).In addition,mitochondrial biogenesis in the RGC somas noted early after ONC (1 dpi) might be helpful to enlarge the pool of mitochondria that support axon repair later on.At these early time points after optic nerve injury,the overall mitochondrial mass was reduced in the optic nerve/tract.However,enlarged mitochondria were observed after the crush site in the optic nerve and tract at 1,3,and 4 dpi,which could be key for energy production here.At the level of the optic tectum,axonal degeneration and mitochondrial removal take place immediately after ONC.In the following regenerative phase,axons start to regrow and elongate(3–6 dpi,axonal regrowth phase),potentially aided by mitochondrial energy production due to (fission-mediated) transport of somatodendritic mitochondria.Moreover,recycling of mitochondria via mitophagy in the IPL and NFL could provide more mitochondria for transport to the distal axons,where they are highly needed.
When the axons ultimately reach the optic tectum (target reinnervation phase,6–10 dpi),the mitochondria are also again detected here,indicating that mitochondria are closely involved in axon regrowth.Upon synaptic restoration in the brain,RGC dendrite regrowth and synaptogenesis in the IPL are triggered (dendritic restoration phase,10–14 dpi),which possibly also depends on mitochondrial energy,as suggested by the concurrent mitochondrial reappearance in the IPL at the start of synapse/dendrite restoration.Mitochondrial biogenesis observed just before dendrite regrowth (10 dpi) might aid in the delivery of the necessary energy-producing organelles for the dendritic/synaptic restoration process.All in all,our data indicate a compartmentalized,timed and multi-step mitochondrial response potentially underlying axonal and dendritic regrowth.Of note,although we observed a slightly augmented fusion response in the NFL and IPL,we do not mention fusion in this general overview.No firm conclusions regarding this mitochondrial dynamic process could be drawn based on our Opa1 immunofluorescent staining as we only observed marginal changes in Opa1 immunoreactivity after injury.Moreover,it is known that Opa1 expression does not always correlate perfectly with mitochondrial morphology (Khraiwesh et al.,2013).
At first sight,the mitochondrial distribution data gathered from the optic nerve/tract do not fit our hypothesis that mitochondria should accumulate in the distal part of the regrowing axons to support axonal regrowth,as less mitochondria were present in the injured optic nerve/tract,compared to naive ones.However,quantifying mitochondrial numbers specifically inside distal axons of the injured optic nerve is difficult for multiple reasons.First of all,a combination of multiple processes simultaneously ongoing in the optic nerve at early time points after ONC (axonal degeneration combined with the outgrowth of pioneering axons) makes it difficult to solely zoom in on the regrowing axons.Moreover,although we spatiotemporally mapped injury-induced axonal regeneration in adult zebrafish and thus can estimate the position of the axonal leading front in the optic nerve/tract,not all RGC axons perfectly grow in parallel.Additionally,the optic nerve/tract most likely still contains less axons compared to the uninjured condition early in the regeneration process,resulting in ‘blank spaces’ without axons.Although the use of the red membrane tag might be an ideal method to visualize individual axons,it could not be used in the optic nerve.The RFP positive signal did not show clear labeling,most likely due to axonal de-and regeneration simultaneously ongoing here.Importantly,despite the lower number of mitochondria in the injured nerves,we did observe larger MitoeGFPentities in the optic nerve/tract after injury,which might indicate a dense mitochondrial accumulation at the growth cones or the presence of fused mitochondria that allow for higher energy generation (Verreet et al.,2019).
Another alternative explanation for the reduced mitochondrial area in the optic nerve/tract early after injury is that energy in the regrowing axons might not only be produced by oxidative phosphorylation within mitochondria but also by glycolysis,the second main energy-yielding pathway.Indeed,a limited number of papers support the idea that local glycolysis might also be important for axonal regeneration in adult neurons.Taylor and coworkers reported that genes linked to mitochondria were significantly downregulated in regenerating rat cortical neurons after axonal injuryin vitro
,and proposed that these neurons regrow in a more glycolytic mode (Taylor et al.,2009).In addition,during regeneration of the damaged central branch of dorsal root ganglia (DRG) neurons in mice,induced by injury of the peripheral DRG branch,axonal transport of different cargoes is enhanced,including that of different glycolytic enzymes (Mar et al.,2014).Also,it already has been suggested that mammalian neurons should shift from a more oxidative phosphorylation state to a more glycolytic one to enhance axonal regrowth(Steketee et al.,2012;Lathrop and Sketee,2013).It is thus possible that in the spontaneously-regenerating zebrafish RGCs,in addition to oxidative phosphorylation,also glycolysis plays a role in axonal extension.Based on a recent publication by Ketschek et al.,reporting that the glycolytic pathway is locally operative in the distal axons of outgrowing embryonic chicken sensory neurons (Ketschek et al.,2021),we could assume that also a timed and spatial(neuronal compartment-specific) shift in bioenergetics processes is key for a successful axonal extension.Finally,using two stable transgenic zebrafish lines with altered mitochondrial fission/fusion inside the RGCs,we revealed that enhanced fission might have a detrimental effect on axonal regrowth.These results were surprising as mitochondrial fission is spontaneously upregulated in the RGC soma during successful axonal regeneration after ONC in adult zebrafish,and fission is known to increase mitochondrial motility and enhance mitochondrial entry into axons (Ito and Di Polo,2017).As supported by the resazurin data,a lower energy production after ONC in the Drp1 OE fish might be one of the underlying mechanisms for this reduced capacity to regenerate axons.It might also be linked to a failure to generate larger mitochondria in the distal axonal ends,which we observed in the regenerating optic nerve/tract of MitoeGFP fish after injury.Of note,several studies reported additional negative effects of mitochondrial fission on neuronal health,including a higher susceptibility to apoptosis,axonal degeneration,and mitochondrial depolarization (Ito and Di Polo,2017;Wang et al.,2021).While we cannot exclude at this time that excessive fission could also induce degenerative events in our fish ONC model,we do believe that fission can boost axonal repair.However,it most likely needs to be very accurately controlled in a spatial (compartmentalized)and timed manner,to profit from all beneficial effects of fission (increased numbers of mitochondria,more mobile organelles,quality control step),and simultaneously prevent its harmful effects (apoptosis,axon degeneration,mitochondrial depolarization).
While our data provide the first evidence for intraneuronal mitochondrial reshuffling during axonal regeneration,our study has some limitations that should be tackled in future research.First,the mitochondrial distribution was morphologically characterized in bulk,i.e.in all RGCs simultaneously and not at the single-cell level.As,most likely,not all RGCs respond in a similar time window to optic nerve injury,visualizing all RGC mitochondria potentially masks the true relationship between dendritic remodeling/axonal regrowth and ongoing mitochondrial processes.Secondly,our conclusions are based on post-mortem analyses meaning that the regeneration process could not be followed over time in one fish.These two constraints could be solved by the creation of transgenic albino fish lines with fluorescent mitochondria in sparse-labeled RGCs and the performance ofin vivo
mitochondrial imaging in the retina-brain pathway at different time points after injury.Needless to say,such analyses will take time and fall beyond the scope of this study.All in all,our findings suggest that an intraneuronal energy shift underlies the successful axonal regrowth and functional recovery in the spontaneously regenerating adult zebrafish.Future studies focusing on the contribution of different bioenergetic processes at single-neuron and neuronal compartmentspecific levels during injury-induced regeneration in these teleost fish could generate pivotal insights into how mitochondrial trafficking/functioning may promote neuronal repair in the mammalian CNS.
Acknowledgments:
The authors thank Lut Noterdaeme,Marijke Christiaens and Véronique Brouwers (all affiliated to Katholieke Universiteit Leuven,Belgium) for their technical assistance.
Author contributions:
Study conception and design:AB,LMoons.Data acquisition:AB,LM,AZ.Data analysis and interpretation:AB,SB,LM,AVD,SV,LMoons.Methodology:TV,FP.Statistical analysis:AB,LM.Drafting of the article:AB.Critical revision of the article:AVD,TV,KF,LMoons.Study supervision:LMoons.All authors approved the final version of this paper.
Conflicts of interest:
The authors declare no conflict of interest.No conflicts of interest exist between Imec and publication of this paper.
Availability of data and materials:
All data generated or analyzed during this study are included in this published article and its supplementary information files.
Open access statement:
This is an open access journal,and articles are distributed under the terms of the Creative Commons AttributionNonCommercial-ShareAlike 4.0 License,which allows others to remix,tweak,and build upon the work non-commercially,as long as appropriate credit is given and the new creations are licensed under the identical terms.
Open peer reviewers:
Satish Bodakuntla,National Institutes of Health,USA;Guadalupe Álvarez-Hernán,Lund University,Sweden.
Additional files:
Overview of the steps to quantify the MitoeGFP area throughout the inner retina using an in-house developed Python script.
Overview of retinal layer separation based on the DAPI intensity and Chat immunofluorescent area profiles.
Metabolic assay estimating energy expenditure of zebrafish during a 2-day period after sham or ONC surgery.
Mitochondrial distribution inside the primary dendrite visualized on cryosections of MitoeGFP retinas harvested at baseline (naive) or 3 days after ONC injury.
Bar graphs representing the MitoeGFP area in the IPL S1,S2,S3,and S4,and in the NFL at baseline (naive) or after ONC.
Metabolic assay estimating energy expenditure of Drp1 OE and Drp1 DN zebrafish after ONC surgery.
Overview of the observed and hypothesized mitochondrial dynamic changes in RGCs of adult zebrafish subjected to ONC.
Open peer review reports 1 and 2.
- 中国神经再生研究(英文版)的其它文章
- Neuroaxonal and cellular damage/protection by prostanoid receptor ligands,fatty acid derivatives and associated enzyme inhibitors
- Extracellular vesicles in Alzheimer’s disease:from pathology to therapeutic approaches
- Molecular approaches for spinal cord injury treatment
- Sex-biased autophagy as a potential mechanism mediating sex differences in ischemic stroke outcome
- Adipose tissue,systematic inflammation,and neurodegenerative diseases
- Interleukin-1:an important target for perinatal neuroprotection?

