Effect of stocking density on growth performance of monosex Nile Tilapia(Oreochromis niloticus) in the aquaponic system integrated with lettuce(Lactuca sativa)
Josih Sw Ani, Julius O. Mnyl, Frnk O. Msese, Kevin Fitzsimmons
aSchool of Natural Resources, Department of Fisheries and Aquatic Sciences, University of Eldoret, Eldoret, 30100, Kenya
bSchool of Spatial Planning and Natural Resource Management, Jaramogi Oginga Odinga University of Science and Technology, Bondo, 40601, Kenya
cDepartment of Soil Water and Environmental Science, College of Agriculture and Life Sciences, University of Arizona, Tucson, 85721-0038, Arizona, USA
Keywords:
Aquaponics
Nile tilapia
Lettuce
Stocking density
A B S T R A C T
Aquaponics is a fish-plant recirculating system where nutrients received from the fish culture are absorbed by the plants for growth. The technology is relatively new for fish culture in Kenya, and the principles and operations remain largely untested for many fish species. This study determined how stocking density affects the growth performance and water quality in a Nile tilapia-lettuce (Lactuca sativa) aquaponics system. The experimental design included five replicates for each of the aquaponic systems stocked at densities of 150, 300, and 450 fish/m3 for a rearing period of 56 days. Each treatment had a planting density of 16 lettuce/m2. The water quality parameters ranges during the rearing period were 3.83–5.35 mg/L for dissolved oxygen, 7.44 to 7.6 for pH,0.014 mg/L to 0.032 mg/L for total ammonium nitrate (TAN), 1.11–1.34 mg/L for nitrate, and 0.01–0.08 mg/L for nitrite, and all decreased with increasing stocking density. The final weight of fingerlings was 25.2 ±4.2 g,32.0 ± 3.8 g and 42.6 ± 3.1 g for 450, 300, and 150 fish/m3 respectively. Specific growth rate (SGR) was reduced with increasing stocking density whereas food conversion ratio (FCR) increased with stocking density. Aquaponic systems with the lowest stocking densities performed better than 300 and 450 fish/m3 respectively.
1.Introduction
There has been tremendous growth in the world’s population over the last decades (FAOSTAT, 2018), thereby reducing food supply per capita from natural food resources (FAO, IFAD, UNICEF, WFP, & WHO,2019). Declining land devoted to food production has seen food security also declining over the past five decades at the global, regional, and local levels (Cottrell et al., 2019). Current estimates indicate that global food demand may exceed 350 million metric tons by the year 2030 while the production will probably stagnate at 200 million metric tons creating a shortfall of over 100 million metric tons (FAOSTAT, 2018). Food insecurity is dire in African countries especially in Sub-Saharan Africa (SSA)due to over-reliance on natural food sources as well as the dominance of agrarian and subsistence forms of agricultural production (Nsiah &Fayissa, 2019). Consequently, the adoption of better food production methods has been recognized as a remedy for food insecurity in many countries in SSA (Hall et al., 2017; Rademaker & Jochemsen, 2019).
Aquaculture as a food production practice has therefore been growing rapidly, often exceeding 20% in most countries of Sub Saharan Africa (SSA) during the last five decades (Tran et al., 2019), thus helping combat food insecurity in areas it has been adopted (Kara et al., 2018).Due to the increasing adoption of aquaculture (Msangi & Batka, 2015),FAO projected that by the year 2025, more than 50% of fish production in Sub Saharan Africa would be generated by aquaculture to contain food insecurity in the region (FAOSTAT, 2016). However, aquaculture in most SSA countries, Kenya inclusive, is still dominated by both extensive and semi-intensive practices (B´en´e et al., 2016), which has resulted in low unit production and often fall short of the projected demand for the human population.
In recent deliberations, the African Union (AU) has identified advancement in Science, Technology and Innovation (STI) under the theme of Science, Technology and Innovation Strategy for Africa(STISA) in 2024, under Agenda 2063, to spearhead the development of aquaculture in SSA (African Union Commission, 2014). There has been a suggestion that low aquaculture production techniques should be abandoned and those that upscale or increase fish production employing Science, Technology, and Innovation is encouraged (Mavhunga, 2017;Saidi & Douglas, 2018). Several reports have therefore recommended solutions that integrate aquaculture and other production technologies to help in the development of the sector (Ampadu-Ameyaw et al., 2016;Kraemer-Mbula et al., 2018, pp. 39–63).
Aquaponics is one of the integrated sustainable food production technologies (Lennard & Goddek, 2019, pp. 113–143) that link hydroponics with a recirculating aquaculture system (RAS) intending to increase fish and vegetable production (König et al., 2018). The Aquaponics system combines both recirculating aquaculture with hydroponics in a symbiotic environment. Ef fluents from the aquaculture unit supply nutrients to the plants which are grown hydroponically hence purify the water. This is made possible by actions of the nitrifying autotrophic bacteria consortium which is mainly composed of nitroso-bacteria (Nitrosomonasspecies) and nitro-bacteria (Nitrospiraspeciesand Nitrobacterspecies) (Goddek, 2017). The nitroso-bacteria converts the ammonia in the system into nitrite before the nitro-bacteria transforms it into nitrate which is absorbed by the plant for growth purposes (Goddek et al., 2015).
This fish and vegetable production system has gained attention and popularity as a bio-integrated model for sustainable food production(Savidov et al., 2005; Kloas et al., 2015; König et al., 2016. Several fish species can be optimally reared in aquaponic systems so as they meet the required culture requirements for fresh, brackish, and marine water environments. Such include species like African cat fishClarias gariepinus(Baβmann et al., 2020), carpsCyprinus carpio (Filep et al., 2016),TilapiaOreochromis niloticus(Rakocy et al., 2004), barramundiLates calcarifer(Shete et al., 2015), rainbow trout (Oncorhynchus mykiss(Adler et al.2000), among many others, have been reared successfully in aquaponic systems. Different species of vegetables such as iceberg, butterhead,romaine, and leaf varieties of lettuce (Lactuca sativa), tomatoes (Solanum lycopersicum), and basil (Ocimum basilicum) have been grown successfully in aquaponic systems (Pantanella et al.,2010; Sace & Fitzsimmons,2013; Salam et al., 2014; Filep et al., 2016). Their overall growth performance varies depending on the fish production system used and their management. Aquaponics helps in solving water scarcity problems when the same water is recycled. It also solves the issue of the treatment of wastewater generated from the fish culture (Kledal et al., 2019). In this system, nutrients from the fish growing unit are used by the plants in the hydroponics component (Goddek & Körner, 2019). In the process, the plants remove nutrients hence improving the quality of the ef fluent and which also enhances fish production (Endut et al., 2014).
In Kenya, aquaponic is still a new technology in its initial developmental stages but one that has great potential in agri-food systems(Dijkgraaf et al., 2019; van Gorcum et al., 2019). Its adoption is still at the infancy stage with people trying to understand how the system works, consumer perception of its products, the economic viability of the system in comparison to the stand-alone RAS and hydroponic systems (van Gorcum et al., 2019), which fish and plant species to use and the optimal stocking density of fish.
Stocking density is one of the most critical factors that can influence the fish reared in the aquaponic system. It affects fish growth, feed utilization, survival, behaviour, health, water quality, and production of gross fish yield (Ok´e & Goosen, 2019; Maucieri et al., 2019). When running an aquaculture unit close to its carrying capacity (CC) allows one to efficiently use space, reduce variation in the amount of feed input,and eventually maximizing on production (Boxman et al., 2016).Stocking fish at lower density results in inefficient utilization of space and low yields, whereas stocking fish at densities above the CC impairs the growth performance of fish due to the accumulation of metabolic wastes such as faeces, impairment of fish social interaction, and deterioration of water quality (Tolussi et al., 2010). According to Irwin et al.(1999), there exists a both positive and negative relationship between the stocking density and fish growth, which is usually species-specific.When fish are stocked at higher stocking densities, their growth decreases as well as their size-variation increases due to the intraspecific competition (Lambert & Dutil, 2001).
This, therefore, makes it important to determine the optimal stocking density for any aquaponic system to optimize both fish and vegetable performance without compromising the water quality and the economic returns associated with the system.
2.Materials and methods
2.1.Study area
This study was carried out at the University of Eldoret located at 0◦32′51.3972′′N, 35◦12′16′11.2044′′E and an altitude of 2140 m above sea level. This area has a temperature range of between 17 ℃ and 26 ℃ and receives an average annual rainfall of about 1124 mm. The allmale sex-reversedO. niloticusfingerlings used for the study were procured from the University hatchery. The experiment was done in a greenhouse structure located at the departmental of fices.
2.2.Preparation of the aquaponic system
The aquaponic system consisted of a 0.1 m3recirculating aquaculture and 0.1 m3hydroponic units, a 0.05 m3improvised columnar filter system (for mechanical filtration), and 0.02 m3sumps. The system had a 2 m3reservoir that had de-chlorinated municipal tap water. The flow rate into each system was set at 1.5 L/min. Fifteen (15) floating Styrofoam boards of dimensions 1 m × 0.5 m × 0.03 m (length, width, and thickness) were used. The boards were placed on the hydroponic unit and used for anchoring the plants. The plantlets (7 days after germination) were anchored in the planting pots placed on the floating boards at a spacing of 6 inches apart.
2.3.Experimental design and set up
The experimental setup included fifteen plastic rectangular tanks(100 L capacity; dimensions 0.5 m by 0.5 m by 0.6 m length, width, and depth respectively) that were used in a randomized design (Fig. 1).There were three aquaponic treatments each stocked with monosexed Nile tilapia fingerlings of an average size of 17.9 ±1.7 g (35 days old).The fish were stocked at densities of 150 fish/m3, 300 fish/m3,and 450 fish/m3for treatments D1, D2, and D3 respectively. These three treatments were replicated five times. Each treatment was being subjected to a 16 lettuce/m2as the planting density. The fish were fed to satiation three times a day at 1000 h; 1200 h and 1600 h respectively using a 35%crude protein (CP) formulated diet. The average amount of feed consumed was 3.1, 5.9 and 6.5 g/tank/day for densities of 150 fish/m3,300 fish/m3,and 450 fish/m3respectively.
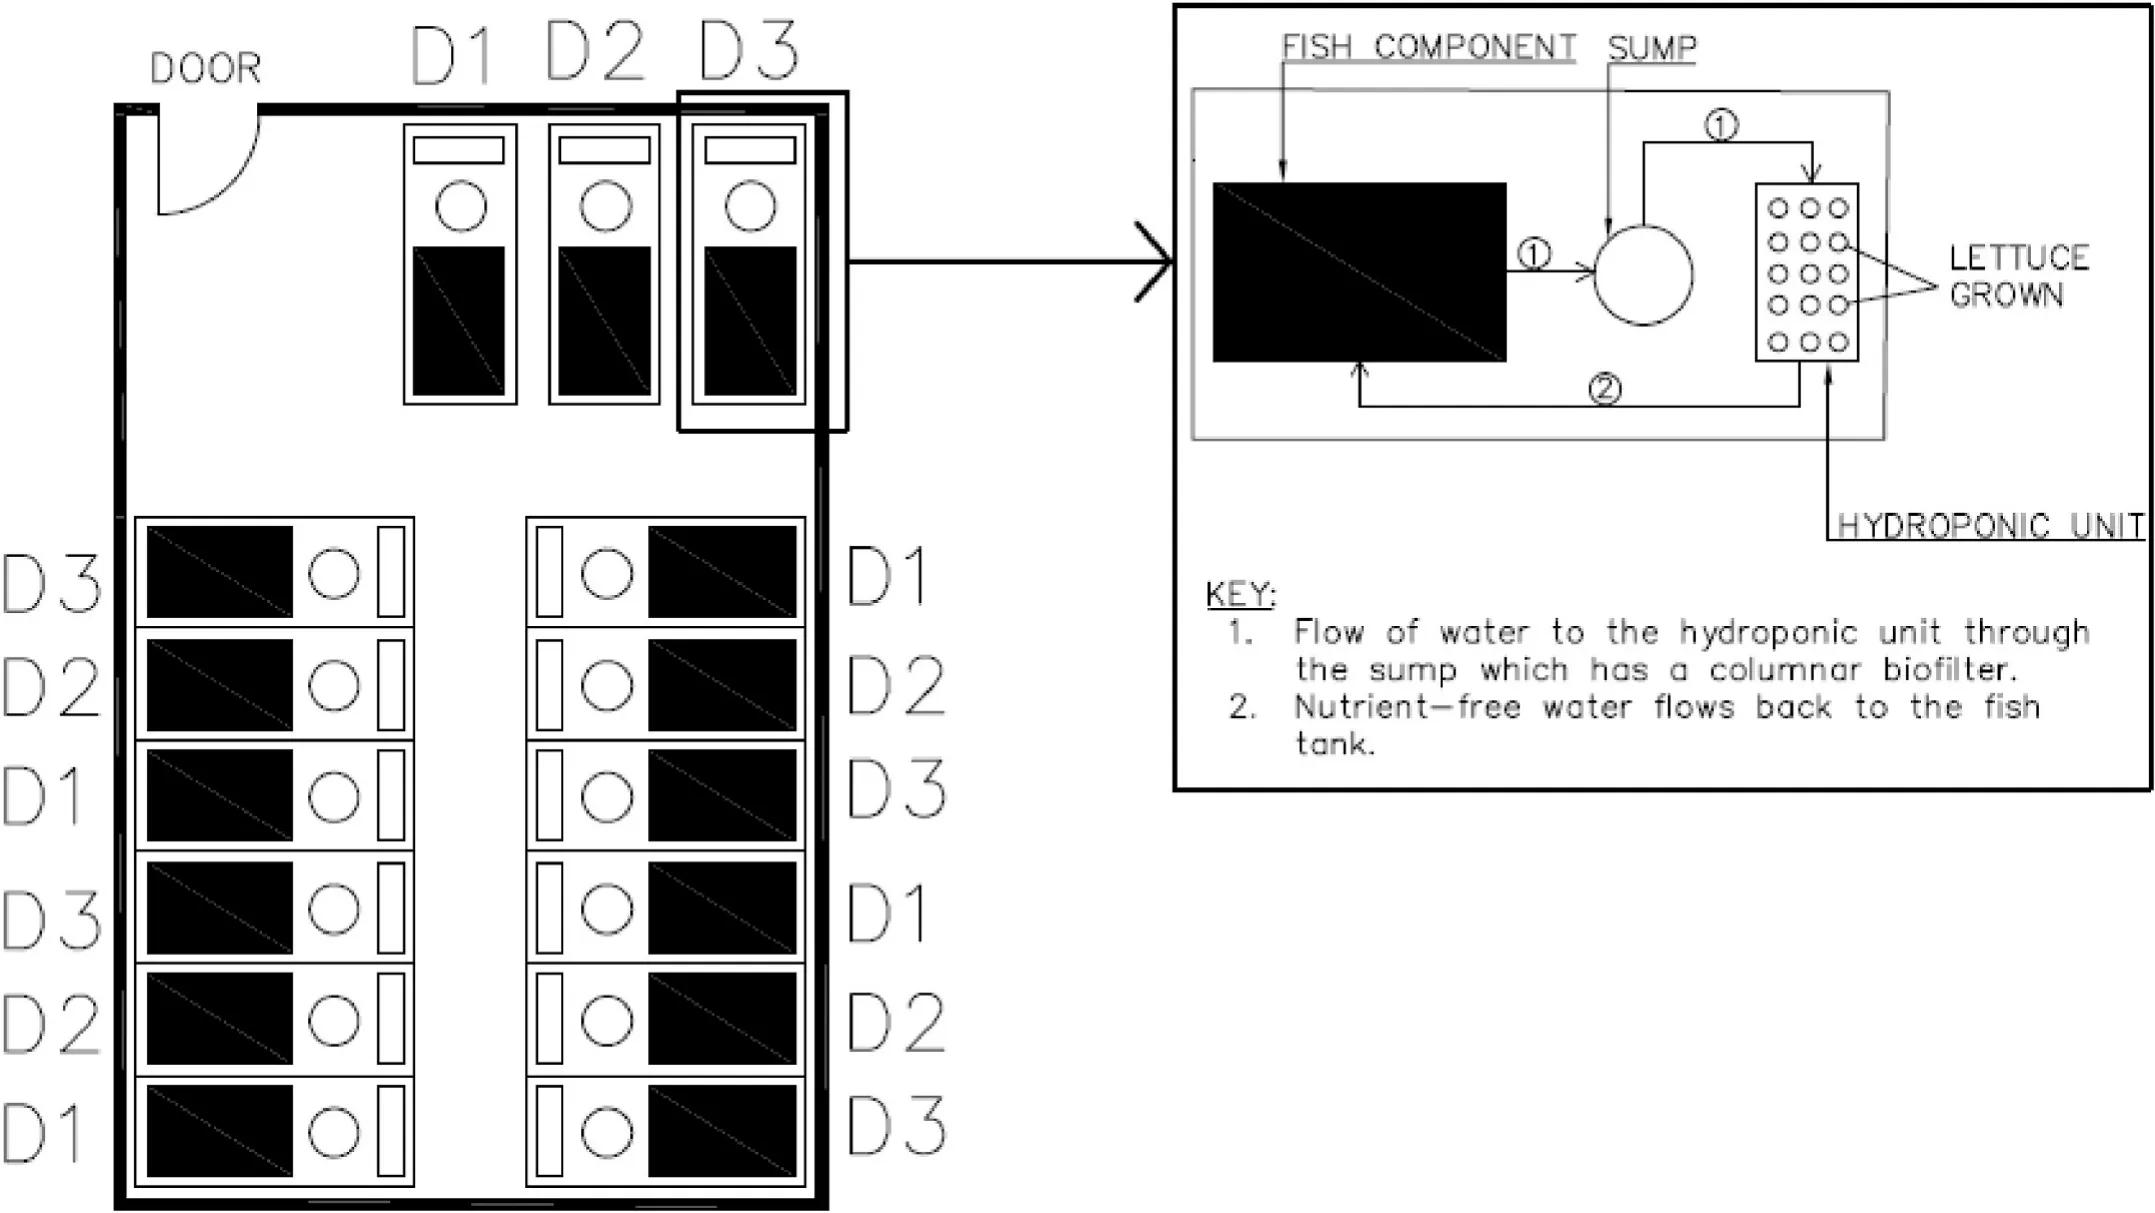
Fig. 1.Experimental setup for the aquaponic system. D1, D2 and D3 are stocking densities for O. niloticus fingerlings at 150, 300 and 450 fish/m3, respectively.
2.4.Monitoring of water quality
Data on dissolved oxygen (DO) concentration, pH, water hardness,and temperature were checked daily in the recirculating fish rearing tank and the hydroponic tank using a YSI 540 DO meter and an EcoSense pH10A Pen Tester. Once every week the water samples were collected from the two units for analysis of TAN, nitrates, nitrite, potassium, and soluble reactive phosphorus (SRP) following the methodologies described by the manufacturer using an optical photometer YSI 9500(YSI Incorporated, Yellow Springs, OH, USA) (±1% precision) (YSI, I.2014). The amount of water entering and that leaving the system before and after treatment was maintained at a flow rate of 1.5 L/min with a help of pre-set automatic gate valves. The water lost through transpiration, evaporation, and periodic flushing was replaced weekly.
2.5.Measurement of growth parameters
A random sample of 10, 10 and 20 fingerlings per tank was collected for weight and length measurements weekly for eight weeks (56 days)for stocking densities 150, 300 and 450 fingerlings/m3respectively.Each week individual fingerlings were weighed to the nearest 0.01 g(WJEUIP, Model WA50002Y, W&J Instrument Co. LTD, China) and their lengths were measured using a pair of callipers to the nearest 0.1 mm.
2.6.Data analysis
Weekly means (±SD) for all water quality parameters were calculated per treatment (stocking density). Fingerlings growth per treatment was determined using a specific growth rate (SGR) and food conversion ratio (FCR). SGR % Body weight/day (BW/D) was determined

where: W1and W2are initial and final weights, respectively while t is time in days.
The FCR was calculated weekly as the ratio between total feed fed (g)ad weight gain (g) for that period. The survival of the fingerlings was monitored weekly per stocking density and was calculated as a percentage of live fingerling.
Generalized linear mixed-effects models (GLEMs) was used to test the effect of stocking density on water quality variables pH, water hardness,nitriteand nitratesSRP, potassium (K) and TANwith the lme function in thenlmepackage in R (Pinheiro et al., 2016; R Core Team 2019). Similar to water quality variables, we used GLEMs to test the effect of stocking density on fish growth using length, weight, SGR and FCR as response variables. GLEM was used instead of Generalized Additive Models (GAMs) after residuals demonstrated largely linear responses to fish stocking density. For each response variable, the GLEM models included stocking density (150, 300 and 450 fingerlings/m3; categorical variable) and time (week 1- week 7)as fixed effects, and tank as a random effect to test whether the position of the tanks affected water quality and fish growth. We included time and its interaction with stocking density (stocking density ×time) as fixed factors. The model setup included the following equation;Response ~ Stocking density ×Time, random =~1| Tank, where the response variables included water quality and growth parameters. A separate model for each variable was run with the 8 observations (7 weekly measurements, including day 1).
An initial GLEM ‘full’ model was fitted that included fingerlings stocking density and time as fixed effects, and ‘tank’ as a random effect with Poisson distribution and a log link function (Bolker et al. 2009).The distribution of all response variables and their residuals were inspected for normality using q-q plots and histograms. To identify the most parsimonious model including only significant predictor variables for water quality and fish growth, a step-wise ANOVA approach based on the Akaike Information Criterion (AIC) was used to achieve an optimal model that explained most variation without the random effect and interaction, with the lowest AIC among non-significant models indicating the best model (Burnham & Anderson, 2004). For each model, we computed marginalR2(R2m, variance explained by fixed factors) and conditionalR2(R2c, variance explained by the entire model,i.e. by fixed and random factors) coefficients with the ‘r.squared GLMM’function in theMUMINpackage (R Core Team, 2019). All analyses were conducted with an alpha of 0.05.
3.Results
3.1.Water quality
Stocking density had a significant effect on water hardness, nitrite,nitrate and SRP in the RAS and hydroponic components (Tables 1 and 2).Potassium (K) and TAN did not vary with stocking density (Table 2). The GLEM model was performed for the RAS component only because this had a direct effect on fish condition and growth. Generally, as fingerlings stocking density increased, the concentrations of the water quality variables were also affected (Table 1). The RAS component recorded higher levels than the hydroponic unit for almost all variables, indicating the ameliorating effects afforded by the lettuce. Nutrients were particularly lower suggesting uptake for plant growth.
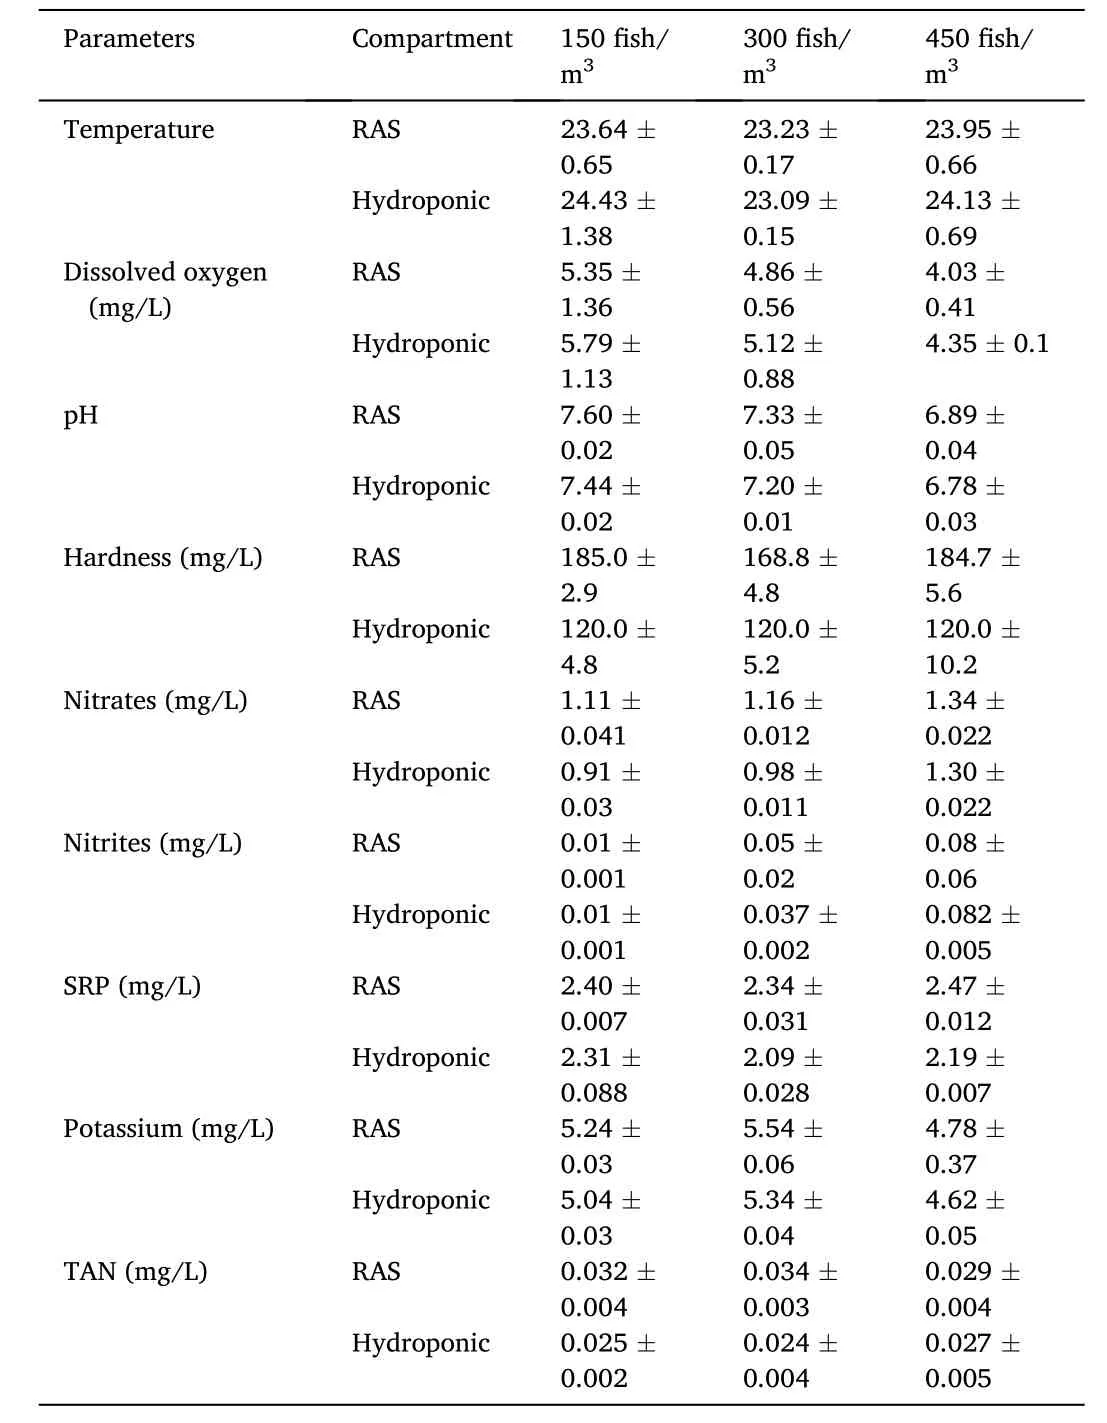
Table 1Water quality parameters (means ±SD) in the aquaponics system stocked with O. niloticus fingerlings at different stocking densities.
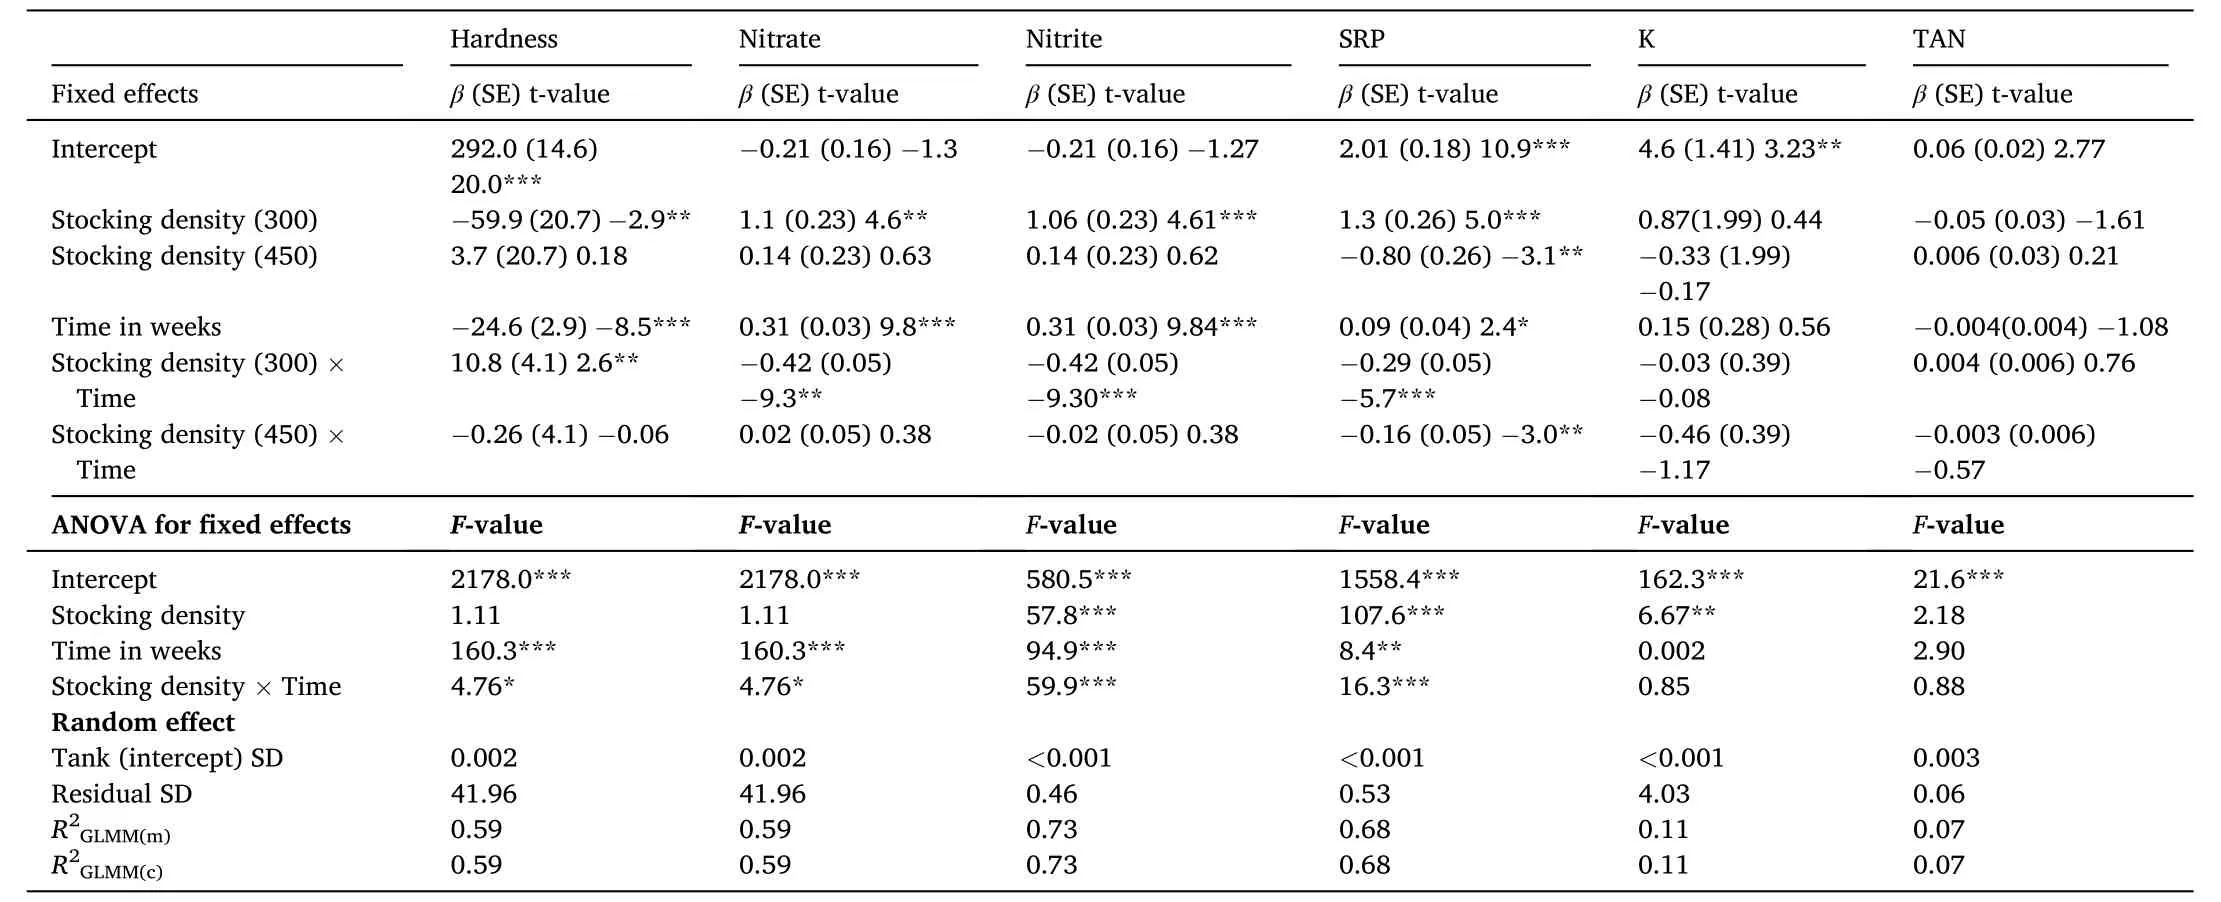
Table 2Results of generalized mixed-effects models for water quality variables.
3.2.Growth performance of the fingerlings
There was a significant effect of stocking density on fish growth measured by length and weight (Fig. 2, Table 3) and SGR and FCR(Fig. 3, Table 3). Fingerlings stocked at 150 fish/m3grew from 17.9 ±1.7 g to 42.6 ±3.1 g, while those stocked at 300 fish/m3grew from 18.2±2.2 g to 32.0 ±3.8 g, while fish stocked at 450 fish/m3grew from 18.2±1.9 g to a weight of 25.2 ±4.2 g. At the end of the experimental period(56 days), fish stocked at 150 fish m−3weighed approximately 33%heavier than fish stocked at 300 fish/ m3and 70% heavier than fish stocked at 450 fish/m3. Meanwhile fish stocked at 300 fish m−3weighed approximately 27% heavier than fish stocked at 450 fish/m3.
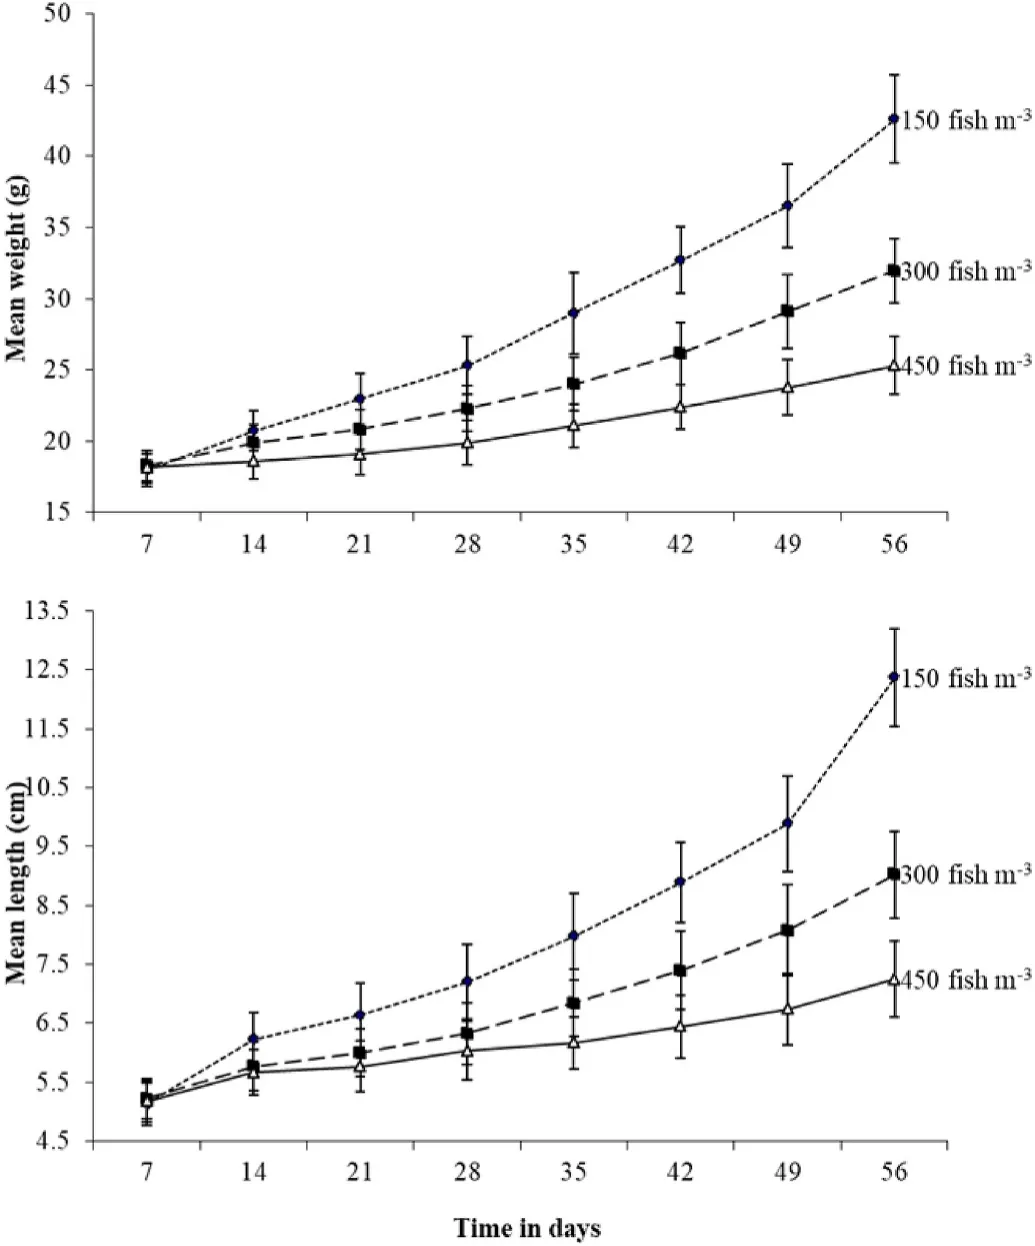
Fig. 2.Growth of O. niloticus larvae in terms of length (upper panel) and weight(lower panel) under different stocking densities in an aquaponic system integrated with lettuce (Lactuca sativa). Dotted line =150 fish/m3, dash-line =300 fish/m3 and solid line =450 fish/m3.
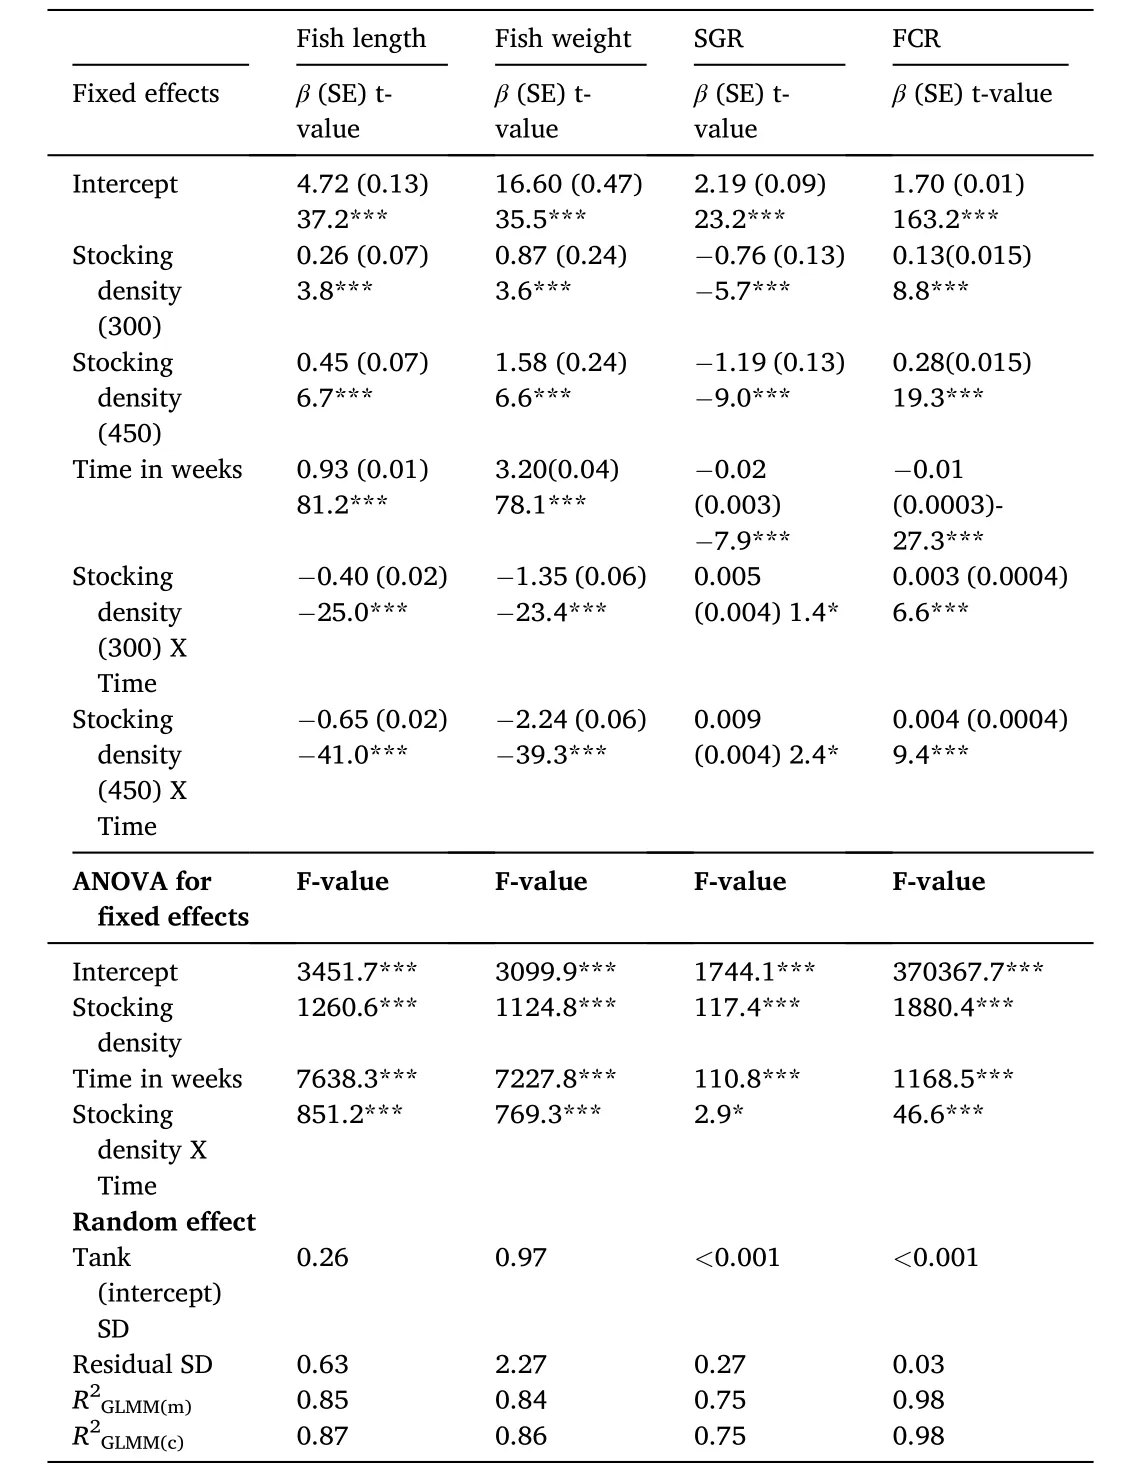
Table 3Results of generalized mixed-effects models for fish length (cm) and weight (g),SGR (% body weight/day) and FCR over the experimental period.
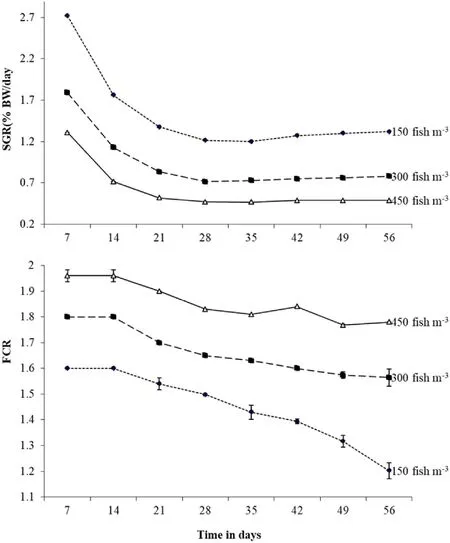
Fig. 3.The SGR (upper panel) and FCR (lower panel) of O. niloticus fingerlings reared under different stocking densities in an aquaponic system integrate with lettuce (Lactuca sativa). Dotted line =150 fish/m3, dash-line =300 fish/m3 and solid line =450 fish/m3.
To facilitate direct comparison between fish growth at different stocking densities, SGR, and FCR were calculated for each stocking density per week (Fig. 3). Generally, SGR decreased with the growth of fingerlings over time, with the greatest decrease recorded in fingerlings stocked at 150 fish/m3. Based on the analysis of the rate of change, fish stocked at 150 fish/m3grew faster than fish stocked at 450 fish/m3and fish stocked at 300 fish/m3.
On the contrary, FCR was inversely related to stocking density, with the highest stocking density (450 fish/m3)also recording the highest FCR. The FCR was significantly higher at stocking density 450 fish/m3followed by fish stocked at density 300 fish/m3and least in fish stocked at 150 fish m−3(Fig. 3). By the end of the 56 days, the FCR was 1.45 ±0.13, 1.66 ± 0.1, and 1.86 ± 0.07 for 150, 300, and 450 fish/m3respectively.
There were differences in the survival of fingerlings across treatments over the experimental period. At the end of the study period,survival was significantly highest (H=13.445, df=2,P=0.0002) at stocking density 150 fish/m3(93.85% ±2.11%), followed by fish stocked at density 300 fish/m3(89.73% ±2.35%), which was similar to fish stocked at 450 fish/m3(82.05% ±2.9%).
4.Discussion
4.1.Water quality
Except for a few cases in this experiment, water quality variablesacross treatments were within the favourable range required for fish culture even under high stocking density but was significantly influenced by stocking density. This phenomenon was also observed by Rahmatullah et al. (2010). The dissolved oxygen range in all the three stocking densities was within the tolerable levels for a fish culture unit of 4–8 mg/L as suggested by Hillary and Claude (1997), Xu et al. (2006),and Rahmatullah et al. (2010) without taking account of stocking density. The decrease in DO levels as stocking densities increased(Jørgensen et al., 1993) could probably result in the mortalities observed in the current experiment (Yang et al., 2020). The low DO levels could also be associated with reduced water circulation (Teichert-Coddington& Green, 1993). Low concentrations of dissolved oxygen in the aquaponics system may probably be due to the fast decomposition of the fish metabolites and feed materials and present in the culture system (Yildiz et al., 2017).
The pH decreased with increasing stocking density of fish in the system, an observation also reported by several authours Goddek et al.,2015; Kloas et al. ., 2015; Yildiz and Bekcan (2017). Yildiz and Bekcan(2017) for example recommended that for the success of the nitrification process in the aquaponic unit pH should be kept around 7. pH below 6.5 can disrupt the nitrification process causing the aquaponic system to fail(Goddek et al., 2015; Yildiz and Bekcan., 2017). Regardless of the stocking density used the pH levels were within the recommended levels for both fish and plant culture.
There were significant interactions between stocking density and time (weeks) in water hardness, nitrite, nitrate and SRP (Table 2),implying that as fish grew, they added more nutrients into the system and their uptake by the plants (lettuce) could not keep up with the loading rates. This phenomenon is equally reported by both Graber and Junge (2009) and Rakocy et al. (2016). Interestingly, TAN did not respond to stocking density, as expected, and this could be attributed to a number of factors. Firstly, ammonia is very volatile and highly labile,suggesting that it was likely the N species that was most up taken by the plants. Similar sentiments on plant uptake of ammonium in the aquaponic systems were also made by Gichana et al. (2018). Secondly, it is likely that it was transformed into other species of N (nitrite and nitrate)by biogeochemical processes mediated by changes in pH and dissolved oxygen concentrations (Goddek et al., 2015; Goddek, 2017).
The concentration of nitrite and nitrate in this study increased with increasing stocking density a phenomenon also directly related to the amount of feed administered. Rahmatullah et al. (2010) report a linear increment of TAN and nitrate with increasing stocking density and feed input. The removal of TAN, nitrite, and nitrate from the water as indicated by the lower values in the hydroponic unit as compared to the RAS unit was probably due to plant uptake (Suresh & Lin, 1992). Microorganisms present in the system assimilate NO3–N in the water or the root of the plants grown with the help of bio films (Azam & Ifzal, 2006). These nutrients are important for the growth of lettuce.
4.2.Growth performance of fish
There were significant interactions between stocking density and time (weeks) in all parameters of growth examined; length, weight, SGR and FCR (Table 3). Fish stocked at 150 fish m−3had the highest mean weight and final length. Based on the analysis of change, this fish also demonstrated faster growth as compared to fish stocked at densities 300 and 450 fish m−3. Rayhan et al. (2018) obtained comparable outcomes,where stocking density was identified to relate with the average weight gain and length in tilapia. The present results, therefore, suggest that the weight of fish decreased inversely with increasing stocking density and the patterns appeared consistent throughout the experiment period which concurs with those established by Ferdous et al. (2014) and Rayhan et al. (2018). Generally, the fish weight increased with decreasing stocking density. An increase in fish weight by approximately 250% during a similar rearing period has been obtained in studies done in tanks (Siddiqui & Al-Harbi, 1999; Yoo & Lee, 2016) and recirculating aquaculture systems (Wang et al., 2019).
At the end of the 8 weeks, the SGR was highest at the stocking density of 150 fish/m3, followed by a stocking density of 300 fish/m3and least in fish stocked at 450 fish/m3. Palm et al. (2014) working also in the aquaponic system reported a specific growth rate of 0.71% per day in Nile tilapia whose initial weight was 174 g and were initially stocked at 5.6 kg/m3and 0.65%/day, which are nearly similar to those found in the present study. Greenfeld et al. (2018) additionally revealed that the SGR of Koi Carp (Cyprinus carpio) whose initial weight of 4.24 g raised in an aquaponic system reduced with increasing density of fish from 1.4 kg/m3to 2.1 kg/m3to 2.8 kg/m3. Maucieri et al. (2019) also observed a substantial reduction of SGR with increasing stocking density in juveniles of tilapia reared in aquaponic systems.
The FCR increased with increasing stocking density and this could probably be due to the amount of feed given in each treatment a phenomenon also reported by Al-Harbi and Siddiqui (2000). Several studies report a negative effect as stocking density increases on the feed conversion ratio of fish in both the aquaponic and conventional aquaculture systems (Maucieri et al., 2019; Tran et al., 2019). However, other authors still working in aquaponic systems did not report any significant changes in FCR being affected by the changes in the stocking density(Hayat et al., 2018; Maucieri et al., 2019).
The survival rate decreased with increasing stocking density. This may probably be due to the crowded condition created as a result of the higher densities and the resulting competition, even though the fish were fed to satiation. Similar results were also reported by Suresh and Lin (1992) and Gibtan et al. (2008).
However, higher values of weight and length gain, SGR, FCR and survival rates than what the present study described have been reported in experiments done in commercial aquaponics (Endut et al., 2009).According to Baβmann et al. (2017) and Maucieri et al. (2019), fish that are grown in aquaponic systems can achieve a growth performance similar to those raised in conventional aquaculture and recirculating aquaculture systems. This, therefore, suggests that the current growth performance may have been lower than in other commercial aquaponics, perhaps because of the better water recirculation used in those reported studies.
5.Conclusions
Stocking density had a significant effect on the water quality of aquaponic systems such that the lower the stocking density the better the water quality in terms of pH, DO, TAN, nitrite, nitrate and SRP.Regardless of the stocking density used, the water quality parameters measured were within the recommended concentrations.
The growth performance of Nile tilapia fingerlings in terms of weight and length and growth parameters FCR and SGR was significantly influenced by the stocking density. The mean weight and length and the SGR decreased with increasing stocking density whereas the FCR increased with increased stocking density. Generally, the fish performed better at lower than at higher stocking densities. This, however, doesn’t rule out the fact that higher stocking densities can still be used especially when good water quality parameters are maintained.
CRediT authorship contribution statement
Josiah Sabwa Ani: Conceptualization, Methodology, Formal analysis, Data curation. Julius O. Manyala: Supervision, Writing – review &editing, Funding acquisition, Project administration. Frank O. Masese:Formal analysis, Writing – review & editing. Kevin Fitzsimmons:Funding acquisition, Methodology, Writing – review & editing,Supervision.
Acknowledgements
Special thanks go to AquaFish Innovation Lab under the United States Agency for International Development (USAID) Cooperative Agreement Number EPP-A-00-06-00012-00 and the National Research funds (NRF) formerly known as the National Commission for Science Technology and Innovation (NACOSTI) for funding this project.
 Aquaculture and Fisheries2022年3期
- Aquaculture and Fisheries的其它文章
- Anthropogenic temperature fluctuations and their effect on aquaculture: A comprehensive review
- Recent advances in application of moving bed bioreactors for wastewater treatment from recirculating aquaculture systems: A review
- Characterization and expression analysis of gonad specific igf3 in the medaka ovary
- Liver DNA methylation and transcriptome between 1- and 3-year-old grass carp
- Screening and validation of reference genes for qPCR analysis in gonads and embryos of Takifugu bimaculatus
- Assessment of genetic diversity, detection of strain-specific single nucleotide polymorphisms and identification of the Bangladesh and Vietnam strain of Channa striata by PCR-RFLP analysis of the mitochondrial COI gene fragment
