
Screening and validation of reference genes for qPCR analysis in gonads and embryos of Takifugu bimaculatus
2022-05-18 13:59ZhoweiZhongLuluAoLipingZhoZeyuZhngYonghuJing
Aquaculture and Fisheries 2022年3期
Zhowei Zhong, Lulu Ao, Liping Zho, Zeyu Zhng, Yonghu Jing,*
aKey Laboratory of Healthy Mariculture for East China Sea, Ministry of Agriculture, Fisheries College, Jimei University, Xiamen, 361021, China
bCollege of Animal Sciences, Fujian Agriculture and Forestry University, Fuzhou, 350002, China
cCollege of Food and Biological Engineering, Jimei University, Xiamen, 361021, China
Keywords:
Reference gene screening
qPCR
Gene expression
Takifugu bimaculatu
A B S T R A C T
Suitable reference genes are one of the necessary conditions for obtaining reliable results by real-time fluorescence quantitative PCR (qPCR). In this study, the expression of the 10 common candidate reference genes (18s rRNA, rps27, cnbp, rpl7, ube2, hsp-at, gapdh, β-actin, rpl13a, 1-ef1a) at different developmental stages of gonad and embryo of Takifugu bimaculatus were analyzed by qPCR. And the expression stability of these reference genes is analyzed by GeNorm, NormFinder and Bestkeeper softwares. The results showed that the expression stability of 1-ef1a was the highest (p <0.05) combined with the results of three analysis softwares, and the optimal number of reference genes was 3, which were 1-ef1a, hsp-at and rps27. Based on this result, we analyzed the expression of objective genes (foxl2 and dmrt1) at different developmental stages (early, medium-term and late) of gonads and embryos (eye vesicle stage, motility stage, heart anlage stage, retinal pigmentation stage, newly hatched larva) of T. bimaculatus by qPCR. Among which the highest expression level of foxl2 was in the middle stage of ovary (p <0.05), and dmrt1 was expressed in the early stage of testis with the highest level (p <0.05). The expression levels of foxl2 and dmrt1 in the early stages of embryonic development were low or even almost non-existent, and had a slight increase in the late embryonic development (newly hatched larva). The expression pro file of objective genes are consistent with their roles in the development of gonads and embryos, which indicates that 1-ef1a, hspat and rps27 are the suitable reference gene combination for detecting the expression of objective genes by qPCR in gonads and embryos of T. bimaculatus. This research also provides the reliability data for screening the reference genes by qPCR in fish.
1.Introduction
Takifugu bimaculatus,a kind of puffer fish belonging to Tetraodontiformes, Tetraodontidae, is a carnivorous, demersal fish which prefers to live near coral reefs and the distribution ranges from the southern Yellow Sea to the South China Sea (Sheng et al., 2020; Shi et al., 2020).Because of its high economic and nutritional value, it has become a commercial breed for culturing in Fujian in recent years (Zhou et al.,2019). The reproductive capacity ofT. bimaculatushas been reduced to some extent, and the excessive stress in the environment will induce many diseases (Blandford, Taylor-Brown, Schlacher, Nowak, & Polkinghorne, 2018; Stride, Polkinghorne, & Nowak, 2014), which has become the main restricting factor ofT. bimaculatusculture. In order to solve these problems, the mechanism of their growth, reproduction and various diseases needs to be researched at first. The first genetic linkage map forT. bimaculatushas been constructed via double digestion restriction-site association DNA sequencing, and a chromosome-level assembly has been constructed for comparative genomics analysis (Shi et al., 2020). A chromosome-level reference genome ofT. bimaculatushas been produced using the PacBio single molecule sequencing technique (SMRT) and High-through chromosome conformation capture(Hi-C) technologies to facilitate genome selection and related genetic studies (Zhou et al., 2019). To understand the role of twomstngenes ofT. bimaculatus, the full-length cDNAs ofTbmstn1(1131 bp) andTbmstn2(1080 bp) were obtained from the genomic database ofT. bimaculatus,and their expression patterns have been also analyzed in detail by quantitative real-time PCR (qPCR) (Sheng et al., 2020). Up to now, there have been no reports on the screening of reference genes by qPCR inT. bimaculatus. Therefore, it’s necessary to screen reference genes ofT. bimaculatusfor study on objective gene function.
In order to obtain accurate experimental results and high quality quantitative analysis of qPCR, it is necessary to rely on the reliability of reference genes. The selection of suitable reference genes can efficiently eliminate the interference of factors such as the quality of extracted RNA and differential expression between tissue samples (Xia et al., 2017).The ideal reference genes should not be affected by the intervention of many experimental conditions and corresponding speciation, and many housekeeping genes such as ribosomal RNA (18s rRNAor28s rRNA) andactinhave been used as reference genes (Shi, Lu, Wang, & Wang, 2014).However, a large number of studies showed that the expression of these common reference genes also changed under different experimental conditions (Rocha-Martins, Brian, & Silveira, 2012; Shi, Lu, Wang, &Wang, 2016), which can lead to serious deviation of qPCR results. Thus,it is critical to screen suitable reference genes.
GeNorm mainly determines the most stable gene by analyzing the expression stability (M) of genes in different samples. The data was transformed the originalCTvalue by 2 (ΔCT) (Kidd et al., 2007). The higher the value of M, the worse the stability; on the contrary, the better the stability. In gene expression analysis, in order to reduce experimental errors, it is usually necessary to use two or more reference genes to correct the objective genes, so as to obtain more accurate results.GeNorm determines the appropriate number of reference genes (V value) by calculating the Pairwise variation (Vn/n+1) of reference genes(Zhang et al., 2014). The default threshold of V value is 0.15, that is, if Vn/n+1is less than 0.15 for the first time, it means that the n number of reference genes can be used to correct the objective genes in qPCR, and there is no need to use the (n+1) one. NormFinder evaluated the stability of reference genes based onCTvalue (after 2 (ΔCT) transformation) and the stability value (Sagri et al., 2017). Under the experimental conditions, the smaller stability value of the reference genes were, the more stable reference gene were; on the contrary, the higher the stability value were, the more unstable reference gene were.At the same time, Bestkeeper software was used to analyze the stability of candidate reference genes (García-Fern´andez, Castellanos-Martínez,Iglesias, Otero, & Gestal, 2016). The standard deviation and variation coefficient of reference genes were smaller, the stability were better;conversely, the stability were poor. In addition, when SD>1, the expression of reference genes were unstable.
Foxl2is closely related to ovarian development and functional maintenance and is regarded as a marker of sex differentiation in vertebrates (Wang et al., 2007).Foxl2can up-regulate the gene expression ofcyp19a1aand female pathway, promote the proliferation of ovarian cells, and thus influence the decision of gender (Yarmohammadi et al.,2016). The expression offoxl2increases first and then decreases with gonad development, and the lowest expression is at gonadal maturation,indicating that this gene is associated with sexual maturation, such as in great sturgeonHuso(Yarmohammadi, Pourkazemi, & Kazemi, 2017),Clarias fuscus(Deng et al., 2015; Li et al., 2013), Scatophagus argus(Liu et al., 2015) and Rainbow Trout (Oncorhynchus mykiss) (Xu et al., 2017).dmrt1plays a key role in the male differentiation of fish, anddmrt1of fish has similar characteristics in structure, function and evolution (Li,Fu, & Luo, 2016; Zarkower, 2013).dmrt1ofClarias Fuscuswas cloned by homologous cloning method, anddmrt1mRNA mainly existed in the testis without in other tissues, showing the characteristics of sex-determining genes (Deng, Wang, Wu, Zhu, & Li, 2012).
In this study, the expression of 10 candidate reference genes in the early, medium-term and late developmental stages of ovary and testis and the five developmental stages of embryo (eye vesicle stage, motility stage, heart anlage stage, retinal pigmentation stage, newly hatched larva) were analyzed by qPCR. GeNorm, NormFinder and Bestkeeper(García-Fern´andez et al., 2016; Olias Adam, Meyer, Scharff, & Gruber,2014; Sagri et al., 2017) were also used to evaluate the expression stability of these candidate reference genes to screen suitable qPCR reference genes comprehensively. At the same time, based on the suitable reference genes, the expression offoxl2anddmrt1in different development stages of ovaries, testes, and embryos ofT. bimaculatuswere analyzed by qPCR. The relative expression offoxl2anddmrt1in each sample ofT. bimaculatuswas analyzed by the Livak method for understanding theirs role in the process of gonadal development, which is helpful for the follow-up research of functional genomics.
2.Materials and methods
2.1.Material sources
The study was approved by the Key Laboratory of Healthy Mariculture for East China Sea Ministry of Agriculture & Fisheries College Jimei University. All surgery was performed under sodium pentobarbital anesthesia, and all efforts were made to minimize suffering.
In the experiment, the gonads were taken from 96T. bimaculatus(16 females and 16 males in the early stage, 16 females and 16 males in the medium-term stage, 16 females and 16 males in the late stage) and stored in RNA later solution at −80 ℃ for long-term storage. Four samples at the same stage was mixed as one sample.
In the Key Laboratory of Healthy Mariculture, we collected embryos at different developmental stages, including eye vesicle stage (44 h);motility stage (78 h); heart anlage stage (99 h); retinal pigmentation stage (120 h) and newly hatched larva (120 h later) (Sun et al., 2019).The number of embryo samples per period was 100 and the samples were stored in RNA later liquid and stored in the refrigerator at −80 ℃ for a long time.
2.2.Extraction of total RNA and synthesis of cDNA
RNA was extracted from the preserved gonads and embryos at different developmental stages using the TRIzol Reagent kit (Vazyme,Shanghai, China). RNA concentration and purity were determined using the NanoDrop 1000 Spectrophotometer (Thermo Scientific, MA, USA).Samples with A260/280 values of 1.8–2.0 could be utilized for downstream experiments. The integrity of the RNA was tested by 1.0%agarose gel electrophoresis, and reverse transcription was performed immediately after the RNA samples were qualified. The trace amount of genomic DNA was removed from RNA samples by DNAse I treatment.The first strand of cDNA was then synthesized using the RevertAid First Strand cDNA Synthesis Kit (Thermo Scientific, MA, USA) from 3.0 μg total RNA samples. The cDNA was diluted with distilled water by 10 times and frozen at −20 ℃ as a PCR template.
2.3.Design of reference gene primers
According to the reported fish reference genes, the multiple candidate reference genes including18sribosomal RNA (18s rRNA), epinephelus coioides ribosomal protein S27 (rps27), cellular nucleic acidbinding protein (cnbp), ribosomal protein l7 (rpl7), ubiquitinconjugating enzyme 2 (ube2), heat shock protein-at (hsp-at),glyceraldehyde-3-phosphate dehydrogenase (gapdh), Beta actin(β-actin), ribosomal protein L13A (rpl13a) and elongation factor 1-alpha(1-ef1a) were selected. We used Primer 5.0 software to designed the primer sequence of the reference genes (Table 1). PCR amplification was performed using a 25 μL reaction system: 12.5 μL of 2 × Mix Taq Buffer(Mg2+), 1 μL of upstream and downstream primers (10 μmoL), 1 μL of template, and 9.5 μL of RNase free water. PCR amplification procedure was as follows: pre-denaturation at 94 ℃ for 4 min; 35 cycles of denaturation at 94 ℃ for 30 s, annealing at 59 ℃ for 30 s, and extension at 72 ℃ for 1 min; followed by a final extension at 72 ℃ for 10 min. The amplification specificity of the primer was then determined by 1.0%agarose gel electrophoresis.
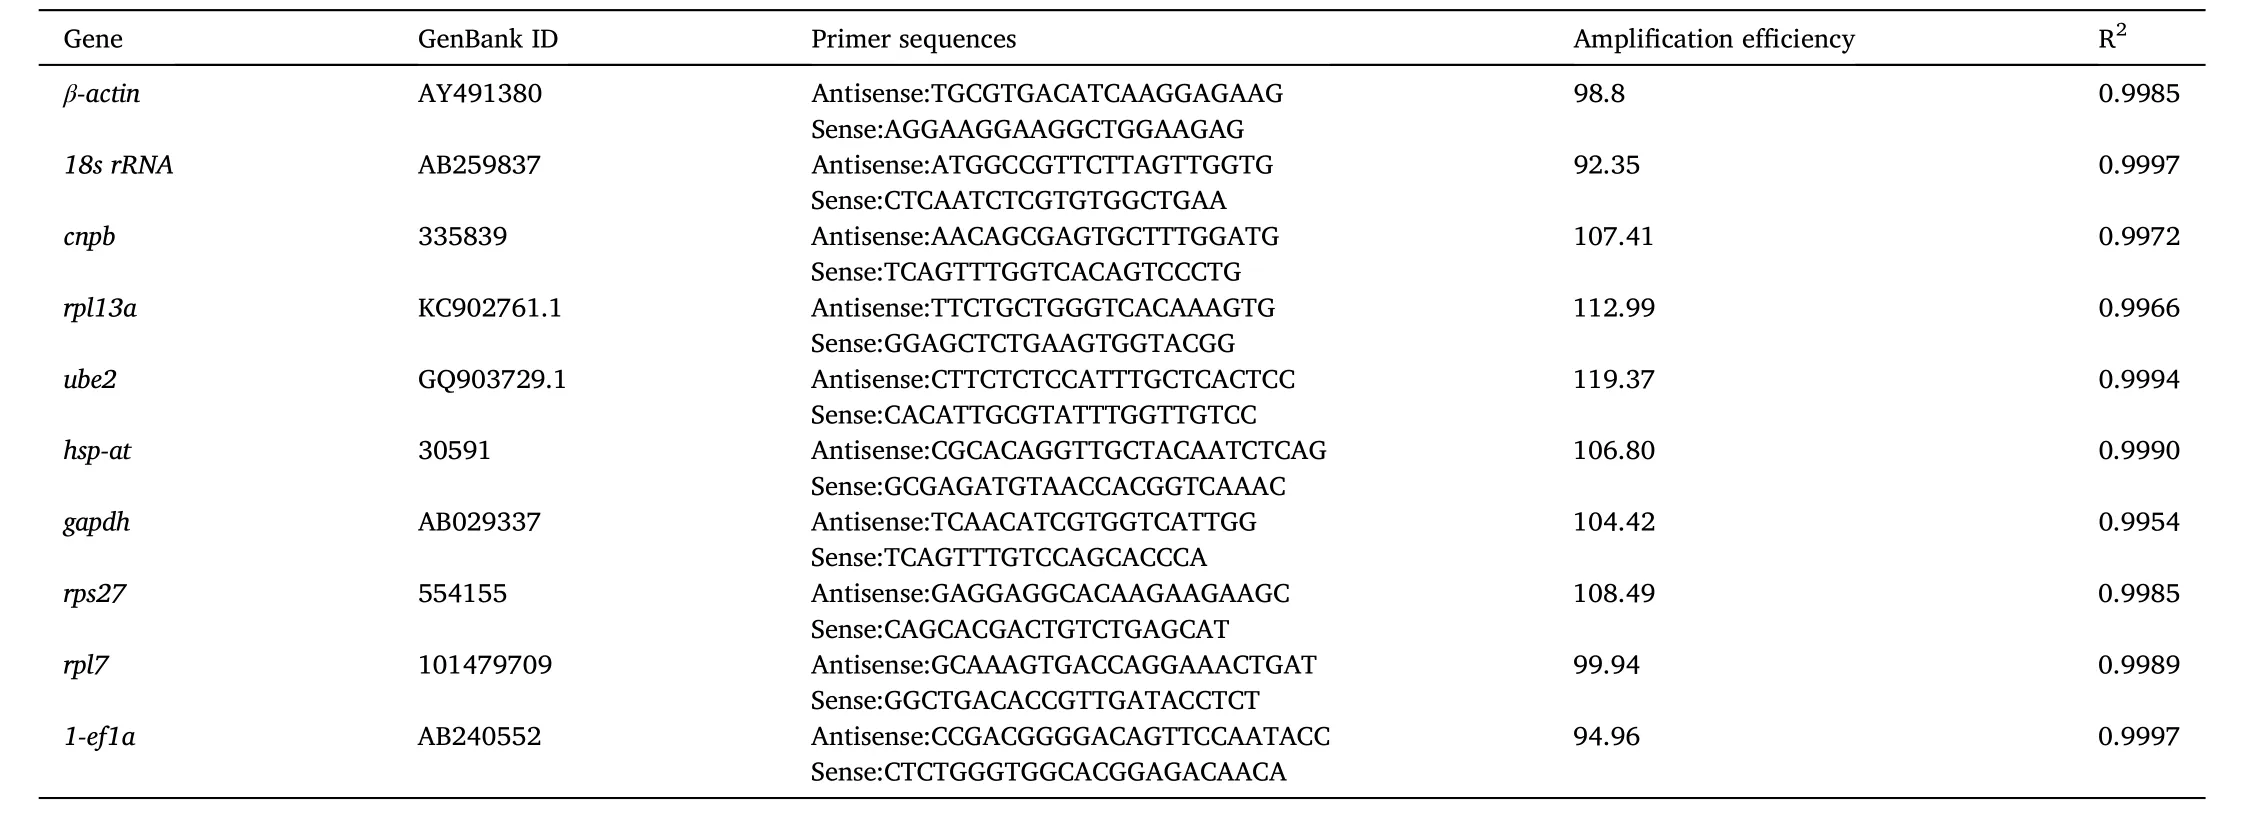
Table 1Primer sequences and the amplification efficiency of reference genes for qPCR.
2.4.qPCR
All cDNA samples were equally divided and mixed into a total cDNA sample, and 6 dilution gradients were set at 10 dilution multiples each gradients. The qPCR was performed to construct the standard curve of each candidate reference gene, and the correlation coefficient R2was obtained according to the formula E (%)=(10 (-1/slope)-1) ×100 to calculate the amplification efficiency. The expression of all candidate reference genes in different tissues was analyzed by qPCR. The amplif i cation of cDNA was based on the QuantiFast SYBR Green PCR Kit(Qiagen, Nangjing, China) on 384-well PCR plates. The 10 μL reaction system: SYBR Green Realtime PCR Mster Mix was 5 μL, the positive and negative primers were 0.25 μL (10μmol/L), the cDNA template was 4.5 μL, and the reaction was conducted at 95 ℃ and denatured for 5 min.Then denaturation at 95 ℃ for 10s, annealing at 59 ℃ for 10s, extension at 72 ℃ for 10s and circulation for 45 times. After the amplification curve was completed, the quantitative PCR was cooled down and the fluorescence value was read. Then the solution curve was analyzed to ensure that the product of each pair of quantitative primers was single.In this experiment, there were 4 biological replicates for each sample and three technical replicates.
The genes expression levels offoxl2anddmrt1were calculated by Livak method (Livak & Schmittgen, 2000), TheCTvalues of ovaries,testes and embryos at different developmental stages were homogenized with the screened out reference genes, and the minimum mRNA expression level in each sample was taken as the benchmark. The relative genes expressions (RGE) offoxl2anddmrt1in different samples ofT. bimaculatuswere determined by 2-△△CT. And then we were going to use the log2 function to get log2 (RGF). The heatmap was showed using pheatmap package of R program.
△CT=the ct value of objective gene - the ct value of reference gene(in the same sample);
△△CT=the △ct of objective gene - the calibration of the △ct;
2.5.Preparation and observation of tissue sections
The gonads of different developmental stages were dehydrated with gradient ethanol, transparency with xylene, embedded with paraf fin,and sliced consecutively, respectively with the thickness of the sections 6 μm. Then stained by hematoxylin-Eosin (H.E), and sealed with neutral balsam. The images were observed and photographed using a Nikon DSFI2 microscope.
2.6.Statistical analysis
The relative stable expression of reference genes in the different developmental stages ofT. bimaculatuswas screened through the analysis of the above softwares. All statistical analyses were performed using SPSS20.0 software and One-way ANOVA was used to compare the relative expression levels. The level of significance was less than 0.05.
3.Results and analysis
3.1.Stages of gonadal development
The structure of gonads was studied by histological method for staging gonadal development. The results are shown in Fig. 1, Fig. 1A–C shows the histological structure of early, medium-term and late ovary,and Fig. 1D–F shows the histological structure of early, medium-term and late testis.
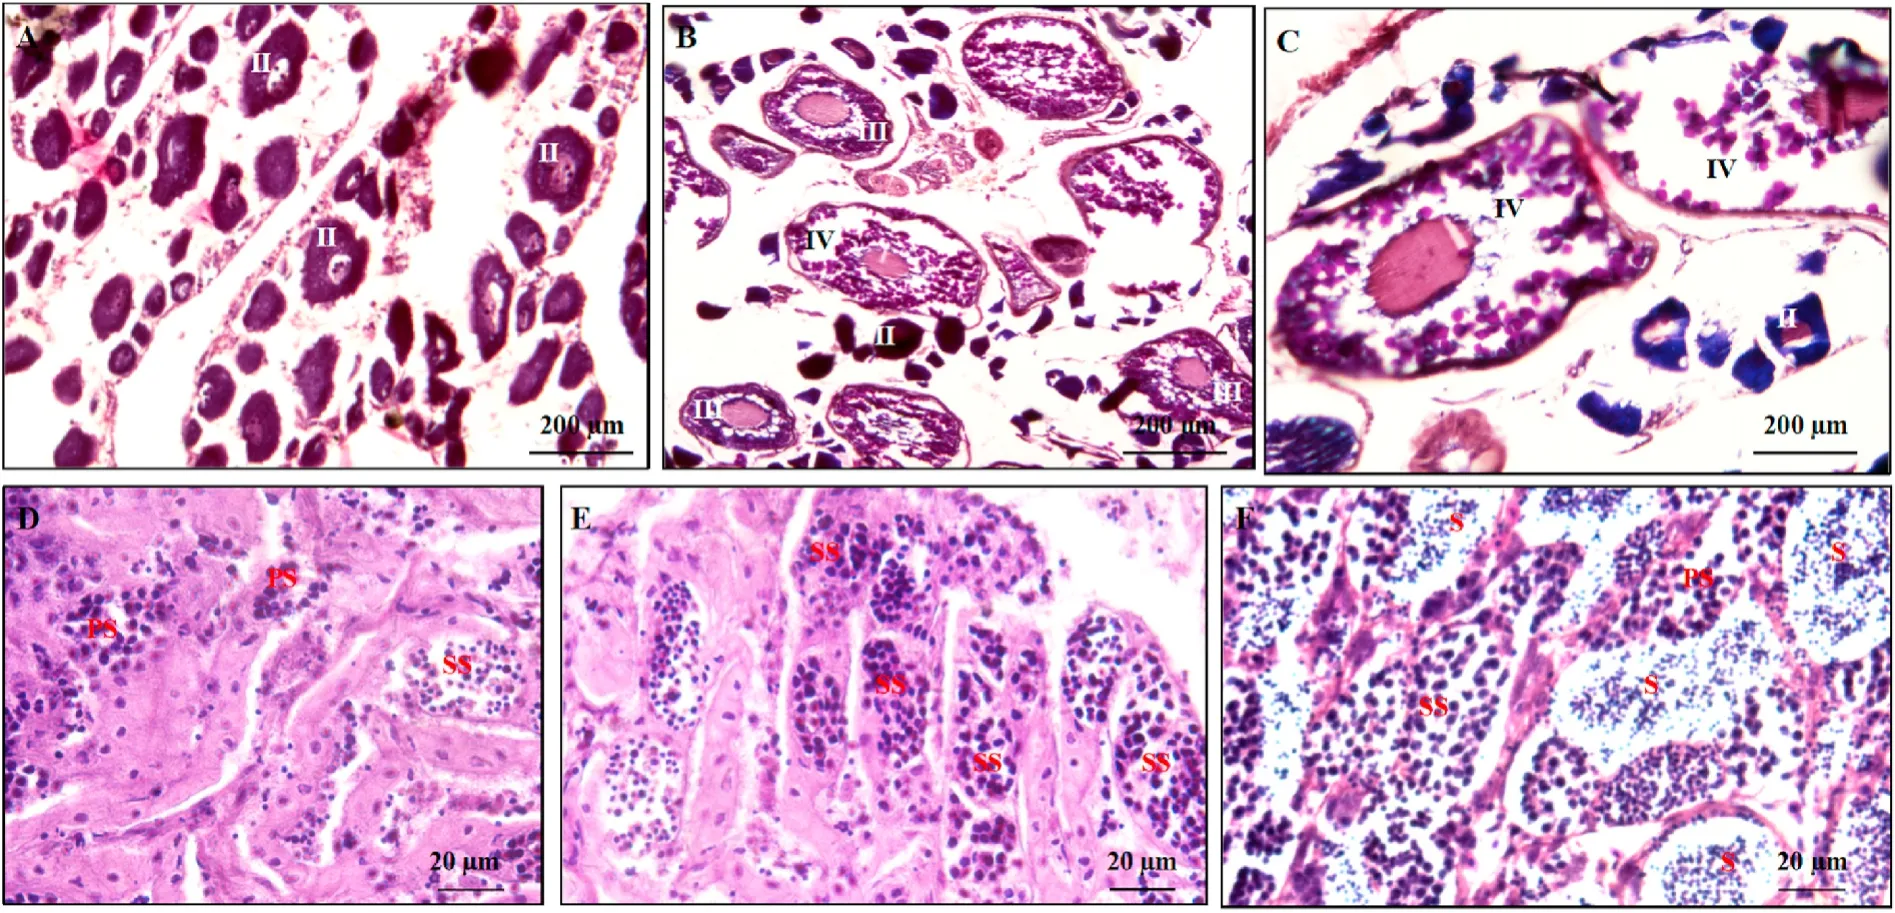
Fig. 1.-The histological structure of gonads at different developmental stages.
A. Histological structure of ovary at early stage, which is at mediumterm stage II; B. Histological structure of ovary at medium-term stage,which is at late stage III; C. Histological structure of ovary at late stage,which is at stage Ⅳ; D. Histological structure of testis at early stage; E.Histological structure of testis at medium-term stage; F. Histological structure of testis at late stage.
II: oocyte (II), III: oocyte (III), Ⅳ: oocyte (Ⅳ), PS: primary spermatocyte, S: mature sperm, SS: secondary spermatocyte.
3.2.RNA electrophoresis and reference gene primer specific detection results
The RNA quality of each sample was good (Fig. 2A) and could be used for downstream experiments through 1.0% agarose gel electrophoresis. RT-PCR was used to detect the specificity of 10 candidate reference genes which all have the high specificity (Fig. 2B), and could be used for the experimental analysis of qPCR.
Fig. 2.-The quality of extracting RNA samples and the specificity of primers.
A. Electrophoresis results of total RNA; B. Electrophoresis of amplif i ed fragments from a single experiment of 10 reference genes.
EO: Early ovary (EO); MO: Medium-term ovary (MO); LO: Late ovary(LO); ET: Early testis (ET); MT: Medium-term testis (MT); LT: Late testis(LT); EVS: Eye vesicle stage (EVS); MS: Motility stage (MS); HAS: Heart anlage stage (HAS); RPS: Retinal pigmentation stage (RPS); NHL: Newly hatched larva (NHL).
G1~G10:18s rRNA;rps27;cnbp;rpl7;ube2;hsp-at;gapdh;β-actin;rpl13a;1-ef1a; M: Marker #2501.
3.3.Amplification efficiency of reference gene primers
The melting curves of the 10 candidate reference genes were almost unimodal, in which18s rRNA,gapdhandube2had a few low peaks with high expression levels. The correlation coefficient R2obtained through the standard curve was all greater than 0.99, and the amplification efficiency ranged from 92% to 120% (Table 1). It indicates that the primers of candidate reference genes have high amplification efficiency with good amplification specificity, and were suitable for qPCR experiment.
3.4.Ct value analysis of reference gene
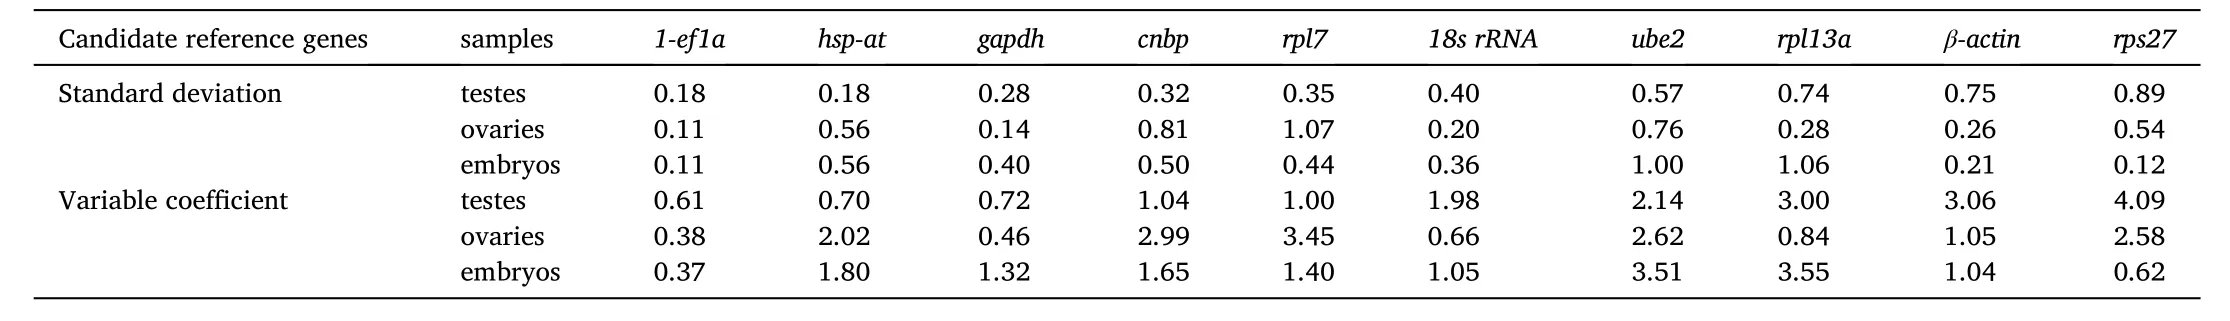
Gene expression was analyzed according to meanCTvalue and standard deviation (Fig. 3). Among all the candidate reference genes, theCTvalues ofrpl13a,β-actinand18s rRNAat the different developmental stage of testes were smaller. Among the ovaries at different developmental stages,β-actin,rps27andcnbphad smallerCTvalues. At the different developmental stages of embryos, theCTvalues ofβ-actin,rps27andube2were smaller with their relative expression levels were higher. However, theCTvalue ofgapdhin testis,rpl13ain ovary,18s rRNAin embryos were larger and the relative expression is lower. TheCTvalue ofrps27 has a larger range, whilehsp-athas a smaller range in testes. In ovary, theCTvalue ofrpl7had a larger variation range, whilegapdhhad a smaller range. In embryos, theCTvalue ofrpl13ahas a large range, whilerps27 has a small range. According to the standard deviation, theCTvalue of1-ef1aat different developmental stages of testes showed the smallest difference with the standard deviation of 0.18,while theCTvalue ofrps27showed the greatest difference with the standard deviation of 0.89. At different developmental stages of ovaries,theCTvalue of1-ef1ashowed the smallest difference with a standard deviation of 0.11, while theCTvalue ofrpl7showed the greatest difference with a standard deviation of 1.07. At different developmental stages of embryos, theCTvalue of1-ef1ashowed the smallest difference with a standard deviation of 0.11 andCTvalue ofube2showed the greatest difference with the standard deviation of 1.00.
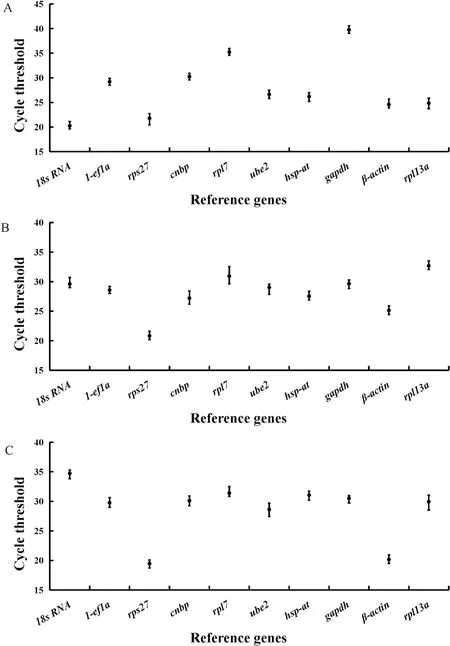
Fig. 3.Expression level of candidate reference genes in T. bimaculatus.
A. Expression levels of candidate reference genes in testes; B.Expression levels of candidate reference genes in ovaries; C. Expression levels of candidate reference genes in embryos.
The black dots (●): the mean Ct value; Vertical lines: the error bars(standard deviation).
3.5.Analysis of gene stability
GeNorm, NormFinder and Bestkeeper software were used to evaluate the expression stability of all candidate reference genes and screen suitable reference genes.
3.5.1.GeNorm analysis
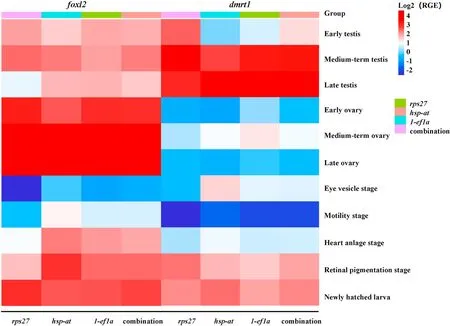
According to the analysis results of GeNorm software the M value of the 10 candidate reference genes in each sample ofT. bimaculatuswas all less than 1.5. The M values of testes in different developmental stages were1-ef1a Fig. 4.The analysis of expression stability of reference gene by GeNorm software. A. The expression stability of reference gene in testes at different developmental stages; (B) The expression stability of reference gene in ovary at different developmental stages; (C) The expression stability of reference gene in embryos at different developmental stages; (D) The optimal number of candidate reference genes analyzed by GeNorm. The value of V was less than 0.15 at the first time in V3/4. 3.5.2.NormFinder analysis According to the results of NormFinder software analysis the stability of the 10 reference genes also varied in gonads and embryos. In testes of different developmental stages, the order of M value from small to large is1-ef1a Fig. 5.The analysis of stability of reference genes by Norm finder. 3.5.3.Bestkeeper analysis Standard deviation (SD) and coefficient of variation (CV) of reference genes were calculated by Bestkeeper software to analyze the expression level of objective genes. The results showed that the standard deviation of 10 reference genes at different developmental stages of testis was1-ef1a Table 2The expression analysis of reference genes by Bestkeeper softwares. Based on the analysis results of the three softwares, the expression of1-ef1awas the most stable, so1-ef1awas recommended as the reference gene of qPCR in ovaries, testes and embryos at different developmental stages. Moreover,1-ef1a,hsp-atandrps27were recommended as reference gene combination to correct for the expression of objective genes according to Genorm analysis. The expression offoxl2anddmrt1in ovary, testis and embryo at different developmental stages ofT. bimaculatusby qPCR using1-ef1a,hsp-atandrps27as reference genes showed as the genes expression heat map (Fig. 6). The average expression level offoxl2anddmrt1in each sample (average level) was stable by usingrps27,hsp-atand1-ef1atogether as reference genes. While using1-ef1aas single reference gene,the variation trend was closer to the average level, but the variation trend of the two objective genes was slightly different from the average level usingrps27orhsp-at assingle reference gene. Therefore, a single gene of1-ef1awas suitable to be selected as the reference gene, or gene combination of1-ef1a,rps27andhsp-atwas suitable to be selected to jointly correct the expression of objective genes. Fig. 6.The genes expression heat map. The expression offoxl2anddmrt1in gonads and embryos ofT. bimaculatusat different developmental stages showed thatfoxl2was highest expressed in the late ovary, and significantly higher than that in testes and embryos (p <0.05); the expression ofdmrt1was highest in the late stage testis, followed by the medium-term testis, and significantly higher than that in ovaries and embryos (p <0.05). As a result, the expression levels offoxl2anddmrt1in the early stages of embryonic development are lower or even almost non-existent. In the late embryonic development (newly hatched larva), the relative expression offoxl2anddmrt1had a slight increase, but not obvious enough. RGE: The relative genes expression by using different candidate genes as reference gene. The expression of reference gene is not likely the same in all tissues and research conditions, so the study of gene expression is inseparable from the screening of reference gene. Ideally, the expression of reference gene should be relatively consistent and expressed continuously in the original tissues. The expression of reference gene is susceptible to the influence of many external environments to a certain extent (Jakub et al., 2015), that is to say, the expression of most of the reference gene is not always stable, and its expression state varies in the corresponding experimental environment. At the same time, the differential expression of each tissue in different species, the optimal reference gene and their stability will change accordingly (Shi et al., 2016). Therefore, it is particularly important to screen the suitable reference gene for each study. Most previous studies have directly used housekeeping genes such as ribosomal RNA (18s rRNAor28s rRNA) and actin as reference gene (Shi et al., 2014). The expression ofβ-actinwas relatively stable among 6 housekeeping genes in rock bream (Oplegnathus fasciatus), thus it was screened out as an suitable reference gene for qPCR analysis of rock bream (Zhang, Sun, Xiao, & Hu, 2014). Comparing the expression of reference genes in the transcriptional analysis of Nile tilapia (Oreochromis niloticus) in different conditions,ubcewas the most stable and suitable single reference gene in the tissues afterStreptococcus iniaeinfection with PBS (phosphate-buffered saline) injection as a control,whilegapdhwas the most suitable gene in intestinal and brain tissue,ef1awas the most suitable gene for heart and muscle afterStreptococcus agalactiaeinfection (Yang et al., 2013). In blotched snakehead (Channa maculata), the expression ofβ-actinandtmem 104was the most stable in different tissues of adult fish, whilesep15andtmem 256were the most stable in different stages of embryo development (Mao, Chen, Zhu, Luo,& Xu, 2017). In zebra fish, 44 candidate reference genes was identified,andube2a andtmem50awere the most stable genes at different developmental stages of embryos, whilerpl13aandrp1p0were expressed stably in chemically treated tissues (Xu et al., 2016).In this paper, the expression of1-ef1awas the most stable, thus it was screened out as reference gene of qPCR in testes, ovaries and embryos at different developmental stages ofT. bimaculatus. NormFinder, geNorm, Bestkeeper and other software are commonly used to screen reference gene. In order to obtain the ideal reference genes, the stability of 10 candidate reference genes was evaluated by NormFinder, geNorm and Bestkeeper softwares. GeNorm software can calculate the average expression stability (M) of reference genes at first;each time the software calculated, it excluded a gene with the highest M value, then, the remaining genes were resequenced and screened one by one. Finally, the smaller the M value of the reference gene is, the more stable the gene is (Lefever et al., 2009; Olias Adam, Meyer, Scharff, &Gruber, 2014). GeNorm software also estimates the pairwise variation(Vn/n+1) to determine the optimal number of reference genes. The optimal number of reference genes is necessary to satisfy Vn/Vn+1below the threshold value of 0.15 (Vandesompele et al., 2002). In this study,V3/4=0.147 (less than 0.15) at the first time, which indicated that the optimal number of reference genes was 3. NormFinder screens the most stable reference genes by an ANOVA-based model and calculates intra-group and inter-group variations, and genes with the least variations are the most stable reference genes (Andersen, Jensen, & Rntoft,2004). According the result of Norm finder,1-ef1awas the highest stability among the 10 candidate reference genes in testes, ovaries and embryos at different developmental stages ofT. bimaculatus. BestKeeper calculates the SD and CV based on the Ct values of each candidate reference gene. Genes with an SD value of<1.0 are stable, and the gene with the lowest SD and CV values is identified as the most stable (Pfaf fl,Tichopad, Prgomet, & Neuvians, 2004). In this study, the SD and CV of1-ef1aare both the smallest and most stable according to the analysis of Bestkeeper software. In a word, the expression of1-ef1awas relatively high, with the smallest SD and CV, the most stability of M value, which could be used as the single reference gene to analyze the expression of objective genes (foxl2anddmrt1). Otherwise, according to the result of GeNorm,1-ef1a,hsp-atandrps27were also selected as reference gene combination to analyze the expression of the objective genes. Bothfoxl2anddmrt1are key sex-determining genes.foxl2gene was expressed in ovary, brain and pituitary, and with the highest expression in ovary and the lowest expression in testis, such asGobiocypris rarus(Wang, Wu, Qin, Wang, & Wang, 2012),Cat fish(Bha, Rather, Dar, &Sharma, 2016) andCyprinus carpo(Barney, 2010), it suggested thatfoxl2may be involved in the upstream regulation of ‘brain-pituitary-gonad’.In this study, The expression offoxl2anddmrt1in ovary, testis and embryo at different developmental stages ofT. bimaculatuswas detected by qPCR based on optimal reference gene. Among whichfoxl2was expressed highest in the late stage of ovary, which was significantly higher than that in the testes and embryos at different developmental stages (p <0.05). The expression ofdmrt1was only in gonads and significantly higher in testis than in ovaries in zebra fish (Danio rerio)(Webster et al., 2017), Japanese flounder (Paralichthys olivaceus) (Wen et al., 2014) and Chinese sturgeon (Acipenser sinensis) (Leng, Du, Li, &Cao, 2015), indicating thatdmrt1is involved in male differentiation. InT. bimaculatus,dmrt1was expressed highest in the early stage of testis,followed by the late stage of testes, and significantly higher than that in ovaries and embryos at various stages (p <0.05). Thefoxl2anddmrt1play an antagonistic role in the sexual differentiation of Nile Tilapia,with degeneration of testis lackingdmrt1and sexual reversal in some females lackingfoxl2, suggesting thatfoxl2anddmrt1also take part in regulating gonadal phenotypes (Li et al., 2012). Thefoxl2anddmrt1may participate in the molecular and morphological sex differentiation by interacting to present an expression of sexual duality in Amur sturgeonAcipenser schrenckii(Okada, Hagihara, Yamashita, Ijiri, & Adachi, 2017).Consistent with the above report, inT. bimaculatus, the expression offoxl2in ovaries increased first and then decreased, with highest level in the medium-term ovary, anddmrt1was expressed highest in the early testes. However, whenfoxl2expression was high in ovary at different stages,dmrt1expression is relatively weak; similarly, when the expression ofdmrt1is high in testes at different stages, the expression offoxl2was low. The expression levels offoxl2anddmrt1in early embryonic development were lower or even no, which may be due to the fact that sex differentiation has not yet taken place in early embryonic development. In the late embryonic development (newly hatched larva), the expression offoxl2anddmrt1increased slightly, which indicating that sex differentiated may begin soon. In summary, the analysis of GeNorm, NormFinder and Bestkeeper softwares showed that the most suitable reference gene for the study of gene expression by qPCR in gonads and embryos ofT. bimaculatuswas single reference gene (1-ef1a) or reference gene combination (1-ef1a,rps27andhsp-at). The expression offoxl2was the highest in mediumterm ovary, and significantly higher than that in testes and embryos at different developmental stages. The expression ofdmrt1was the highest in late stage testis, and significantly higher than that in ovaries and embryos. The result provided reliability data to screen the reference genes in different development stages gonads and embryos ofT. bimaculatusby qPCR, at the same time, it also provided references for the selection of reference genes in other fishes. CRediT authorship contribution statement Zhaowei Zhong: Writing - original draft, perception and design;real-time PCR; RT-PCR; and drafted the manuscript, final approval of the version to be published. Lulu Ao: Formal analysis, Data curation. Liping Zhao: Formal analysis, Data curation, and. Zeyu Zhang: Formal analysis, Data curation, participated in sample collection and data analysis.Yonghua Jiang: Writing - original draft, edited the manuscript and provided overall oversight of the study. All authors reviewed the manuscript. Acknowledgments This work was supported by Natural Science Foundation of Fujian Province (2018J01451); Regional Demonstration of Marine Economy Innovative Development Project (16PZY002SF18); Fujian Engineering Research Center of Aquatic Breeding and Healthy Aquaculture(DF201905); Ornamental Aquarium Engineering Research Center in University of Fujian Province; Undergraduate Innovation Project of Fujian Province (201810390064, 201910390047); College Students innovation and entrepreneurship training program of Jimei University(2020xj053, 2020xj059) Appendix A.Supplementary data Supplementary data to this article can be found online at https://doi.org/10.1016/j.aaf.2020.10.002.

3.6.The expression of objective gene
4.Discussion
5.Conclusion
 Aquaculture and Fisheries2022年3期