
Liver DNA methylation and transcriptome between 1- and 3-year-old grass carp
2022-05-18 13:59LngGuiWenjieLuMijunShiRuiqinHuYnZhouYubngShenXioynXuJieLiuHuiminXiYpingWngWenhoLiYingLu
Aquaculture and Fisheries 2022年3期
Lng Gui, Wenjie Lu, Mijun Shi, Ruiqin Hu, Yn Zhou, Yubng Shen, Xioyn Xu,Jie Liu, Huimin Xi, Yping Wng, Wenho Li,**, Ying Lu,*
aKey Laboratory of Exploration and Utilization of Aquatic Genetic Resources (Shanghai Ocean University), Ministry of Education,Shanghai Ocean University, Shanghai,201306, China
bInnovation Academy for Seed Design, Institute of Hydrobiology, Chinese Academy of Sciences, Wuhan, 430072, China
cState Key Laboratory of Freshwater Ecology, Institute of Hydrobiology, Chinese Academy of Sciences, Wuhan, 430072, China
Keywords:
DNA methylation
Grass carp
Transcriptome
GPCRs
Immunity
Development
A B S T R A C T
Diseases of grass carps often occur in juveniles but not in adults that may have established disease resistance during development. We performed both DNA bisul fite and transcriptome sequencing on liver libraries of 1- and 3-year-old grass carps.Differentially DNA-methylation analysis exhibited a declined methylation level through development. Functional annotation revealed that identified differentially methylated genes (DMGs) and differentiallyexpressed genes were enriched in immune-related pathways such as PI3K-Akt signaling pathway and its related pathways. Both differentially methylated and differentially expressed genes were clustered into the growth- and immune-related function networks. Subcellular localization analysis indicated that the DMGs localized on cell membrane were significantly enriched in calcium signaling pathway and neuroactive ligandreceptor interaction pathway, implying the importance of G protein-coupled receptors to development. These findings will broaden our understanding of the key genes and pathways that affect the immune system at different development stages and the developing protective strategies in grass carp.
1.Introduction
Grass carp (Ctenopharyngodon idellus) is the most important cultured fish species in China (Wang et al., 2015; Xie et al., 2018). However, fish diseases have emerged as a bottleneck in the further development of grass carp aquaculture industry. The disease resistance varies during the development of grass carp. Relationships between immunity and growth have been reported when the infection of grass carp are observed to be age-restricted. The outbreak of viral diseases in grass carp occurs more in juveniles (earlier than one year old) than in adults (over three years old) (Zhang et al., 2006). For instance, one-year-old grass carps (GC1Y)are susceptible to reovirus-induced hemorrhage, while three-year-old grass carps (GC3Y) do not show symptoms (Chen et al., 2019). The similar findings in mammal revealed that neonates are more susceptible to infections and tend to experience more severe outcomes than older children and adults (Prendergast et al., 2012). In contrast, the adults may surfer more bacterial diseases than fingerlings, owing to accumulation of the microbiota during growth, such as the incidence of bacterial septicemia in 46% of adults but only in 25% of juveniles (Zu et al.,2000). Hence, understanding the associations of different genes that affect the immune system at different development stages is important for developing protective strategies in grass carp.
In the past decades, immunity studies were focused on the identi fication and characterization of immune-related genes in grass carp, such as growth hormone receptor (GHR; Hu et al., 2009), C-X-C chemokine receptor type 3 (CXCR3) (Chang et al., 2007), signal transducer and activator of transcription 3 (STAT3) (Guo et al., 2013) and toll-like receptor genes (Pei et al., 2015). Transcriptome and DNA methylation sequencing of immune-related organs have discovered novel functional genes (Tang et al., 2019; Xiong et al., 2018). Combination of these two approaches revealed the mechanism of age restriction of virus infection in grass carp (Chen et al., 2019). However, there are few reports on regulation mechanism of grass carp immune-related genes in different developmental stages.
In this study, we performed bisul fite and transcriptome sequencing of liver samples of GC1Y and GC3Y to investigate DNA methylation and gene expression pro files during the development. Liver is a critical immunological organ with a high exposure to circulating antigens and endotoxins from the gut microbiota, which contributes to immune surveillance against pathogens entering via the gut. In the presence dysfunction of liver may result in bacteria in the systemic circulation,sepsis associated with liver failure, and many intestinal diseases which contributing to spontaneous peritonitis and bacteremia (Trivedi &Adams, 2016). Liver is an organ of complex immunological activity mediated by a diverse immune cell repertoire as well as non-hematopoietic cell populations (M. W. Robinson et al., 2016),which particularly enriches for innate immune cells (macrophages,innate lymphoid cells, mucosal-associated invariant T cells) (Heymann& Tacke, 2016). Since liver is suitable for identification of immune responses and genes association with fish immunity, the comparison and integration of epigenetics and transcriptome might help to reveal the molecular mechanism that involves disease resistance during development in grass carp.
2.Materials and methods
2.1.Sample collection and preparation of whole genome bisul fite sequencing (WGBS) libraries
Healthy GC1Ys with average body weight at 10 g and GC3Ys with average body weight at 2 Kg were collected. Genomic DNA was extracted from the liver of each individual and the quality was analyzed using Bioruptor (Diagenode, Belgium). To avoid individual difference,we used the two DNA pools from 30 individuals, respectively, to perform Methy-Seq, instead of the replicates of individual samples, as described in human epigenetic study (Wockner et al., 2014). Total RNAs from 30 GC1Ys and 30 GC3Ys individuals were also pooled, respectively, for the following preparation of RNA-Seq sequencing libraries.
Genomic DNA of the GC1Ys and the GC3Ys pools was fragmented to an average size of 250 bp by sonication, followed by DNA-end repair, dA addition at the 30and ligation of sequencing adaptors and index, which were used for bisul fite treatment with ZYMO EZ DNA Methylation-Gold kit (Zymo Research, USA). Using the Pippin-Prep platform (Sage Science, Beverly, USA), the fragments of target size of 300–350 bp were selected for construction of the WGBS libraries with TruSeq DNA Methylation Kit (Illumina). The 2 100 bp paired-end reads were generated using Illumina HiSeq-2000 (Illumina, San Diego, USA).
2.2.Identification of differentially methylated sites (DMSs) and differentially methylated genes (DMGs)
The reads cleaned with Trimmomatic (Bolger et al., 2014) were aligned to the reference grass carp genome (http://www.ncgr.ac.cn/g rasscarp/; Wang et al., 2015) to detect the methylated sites using Bismark v0.17.0 (Krueger & Andrews, 2011). The DMSs were identified using R package methylKit (delta>0.25 andP <0.05). The genes carrying DMSs within upstream 2.5 kb of translation start sites (TSS), exons,introns, and downstream 2.5 kb of transcription termination sites (TTS)were extracted to calculated the methylation rate (MR), of which the DMGs were determined by a chi square test (P <0.0001).
2.3.Preparation of RNA-Seq sequencing library and identification of differentially expressed genes (DEGs)
The GC1Y and GC3Y liver RNA pools were extracted using TRIzol(Life Technologies). Quantity of the total RNA was determined with a Qubit fluorometer (Life Technologies) and assessed by measuring RINs with Bioanalyzer Chip RNA 7500 series II (Agilent). Approximately 1 μg of each RNA pool was used to prepare an mRNA-Seq library with NEBNext UltraTM RNA Library Prep Kit for Illumina (NEB, USA). The libraries with fragment length at preferentially 240bp were purified with AMPure XP system (Beckman Coulter, Beverly, USA) and library quality was assessed on the Agilent Bioanalyzer 2100 system. The libraries were sequenced using Hiseq 2000 (Illumina).
The clean reads were mapped to the reference genome using HISAT v2.0.4 with default values (Kim et al., 2015). The software Cuf flinks(Trapnell et al., 2011) normalized gene expressions to the quantified transcription levels (FPKM; Fragments per kilobases per million). The DEGs were calculated using R package edgeR (M. D. Robinson et al.,2009). Fisher’s exact test was then used to identify DEGs between GC1Y and GC3Y, and Benjamini-Hochberg correction (also known as false discovery rate, FDR) was performed. Genes with expression fold change 2 (log2FC 1) and FDR<0.05 were considered as DEGs.
2.4.Functional annotation of screened DMGs and DEGs
Functions of the DMGs and DEGs were annotated with the Nr (NCBI non-redundant protein sequences), Nt (NCBI non-redundant nucleotide sequences), Pfam (Protein family), KOG/COG (Clusters of Orthologous Groups of proteins), Swiss-Prot, KEGG (Kyoto Encyclopedia of Genes and Genomes) pathway and GO (Gene Ontology) databases. The significantly clustered pathways were annotated with DAVID Bioinformatics Resources (P <0.05; https://david.ncifcrf.gov/tools.jsp; Huang et al., 2009). The subcellular localizations of DMGs were predicted by CELLO subcellular localization predictor (v.2.5; http://cello.life.nctu.edu.tw; Yu et al., 2004).
3.Results and discussion
3.1.Distribution of DNA methylated site and comparison of DMSs
A total of 17,032.35 Mb and 19,049.74 Mb WGBS reads were generated from GC1Y and GC3Y, respectively (Table 1). Methylation of CpG islands (mCG) is the predominant type in grass carp, compared with CHG or CHH (H ¼A, T or C), which is similar to mammals and fishes(Goll & Halpern, 2011). Comparison of methylated sites and gene loci revealed higher MR in GC1Y (Fig. 1a), suggesting a decreased MR with the age, which reinforced the previous views that more genes are methylated at early development stages but unmethylates in adults (E.Li, 2002). However, the promoter region (upstream 500-251 bp), Exon 1 and Intron 1 displayed increased MR in GC3Y, which might be associated with expression regulation of certain genes involved during development. To investigate the dynamics of DNA methylation levels in genic region, we illustrated distribution of the MRs in Exon 1, Exon 2,Intron 1 and Intron 2 (Fig. 1b). In general, GC1Y and GC3Y possessed high densities of the DMSs at both ends of the Exon1 and Exon2. This might provide a potential connection among DNA methylation, the selection of splice sites and alternative exons, like the other species (Lev Maor et al., 2015; Riffo-Campos et al., 2018).
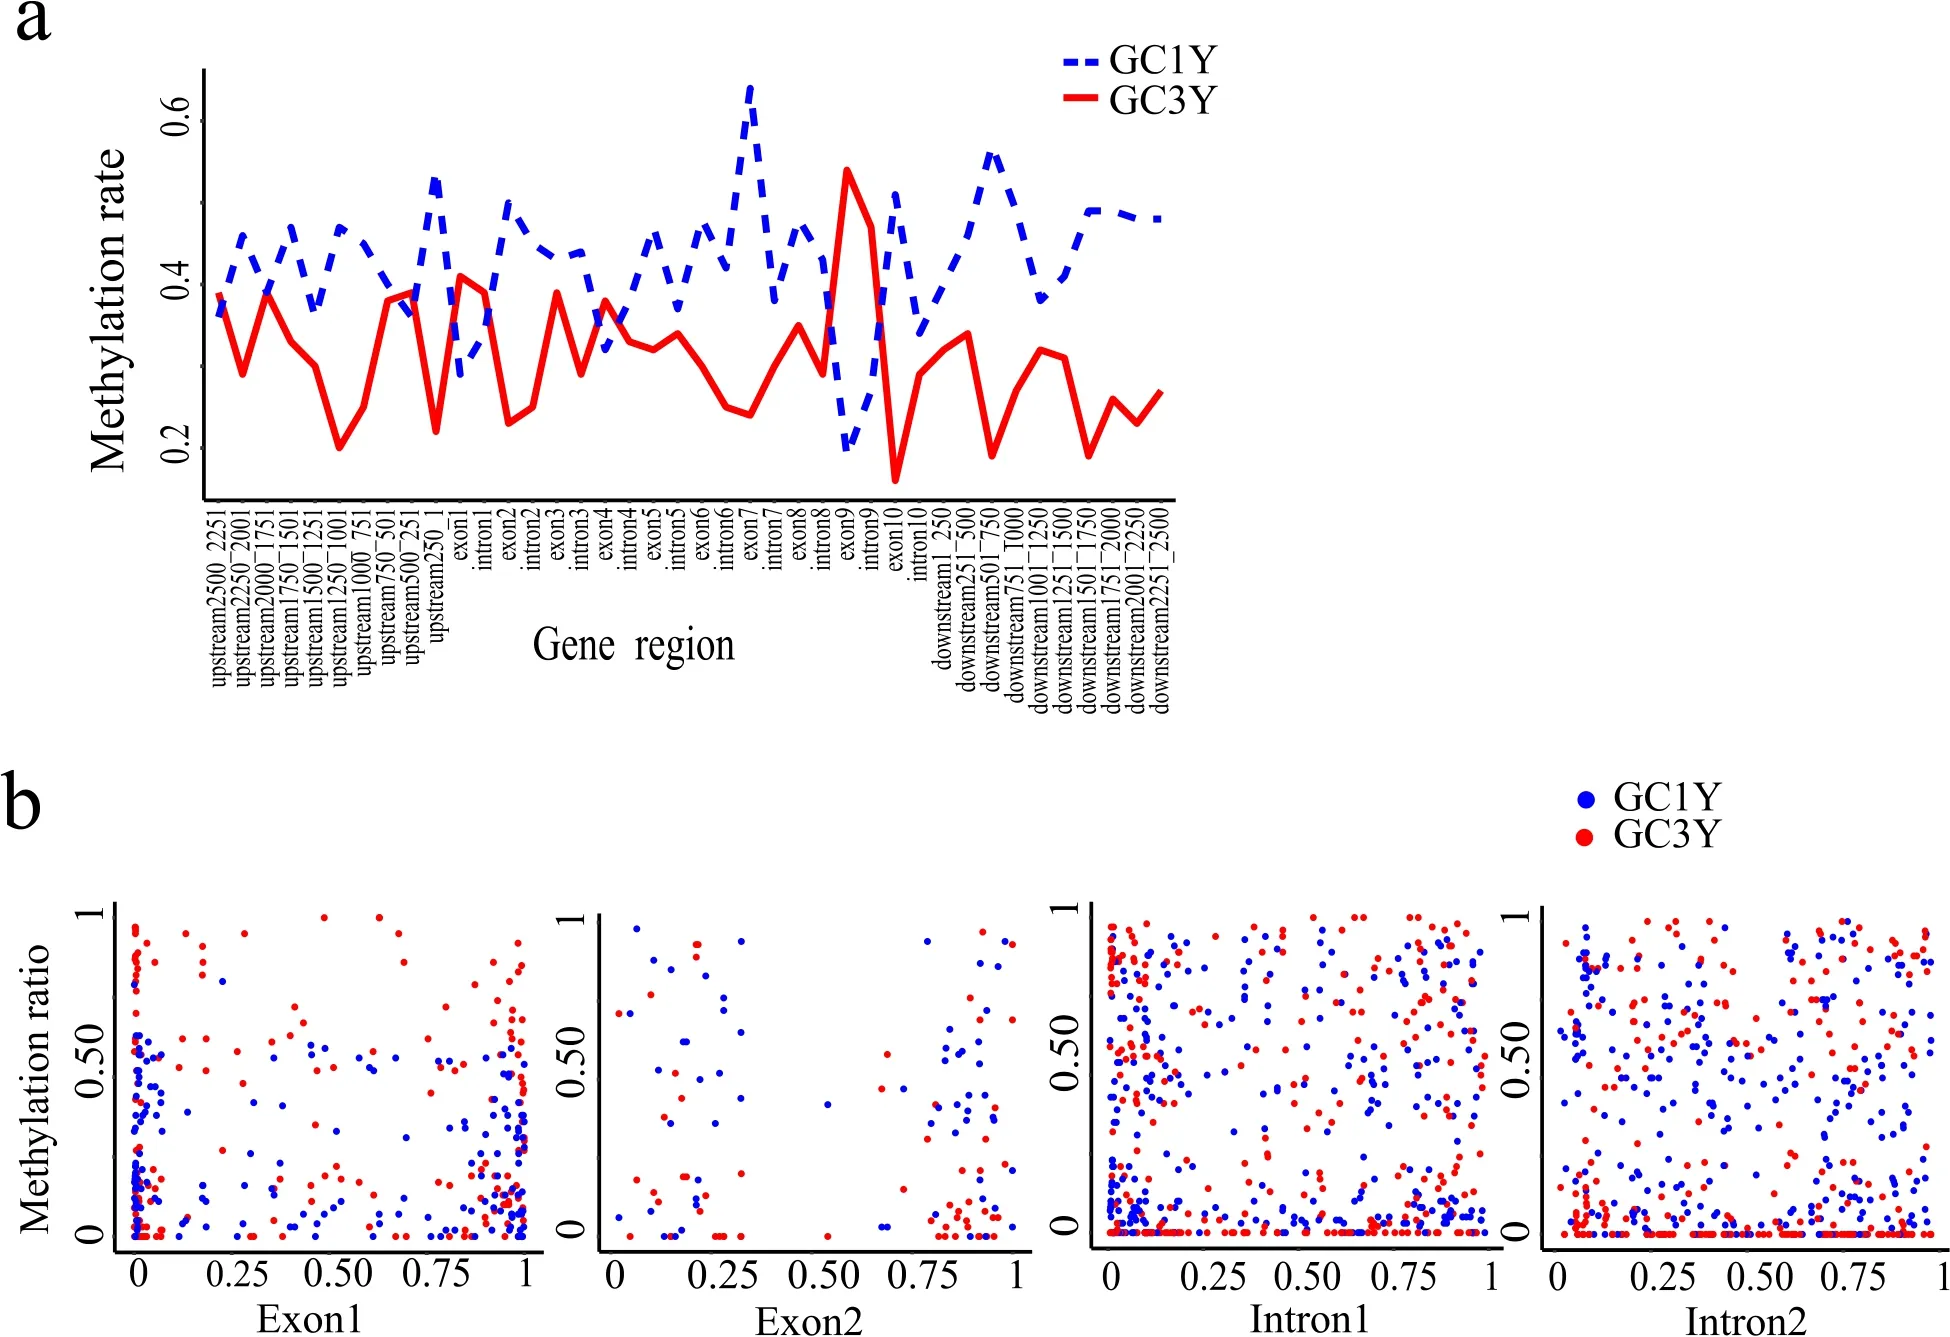
Fig. 1.Distribution of methylation sites surrounding the gene regions.(a) An index of methylation rate (y axis) versus the gene region (x axis) from ?2500 (relative to TSS) to þ2500 bp (relative to TTS). Upstream regions were de fined as?2500 to -1bp of TSS, downstream regions were de fined as þ1 to þ2500 bp of TTS. (b) The scatterplot for DNA methylation rate (y axis) versus the relative length (x axis). Each point represents a methylated site.
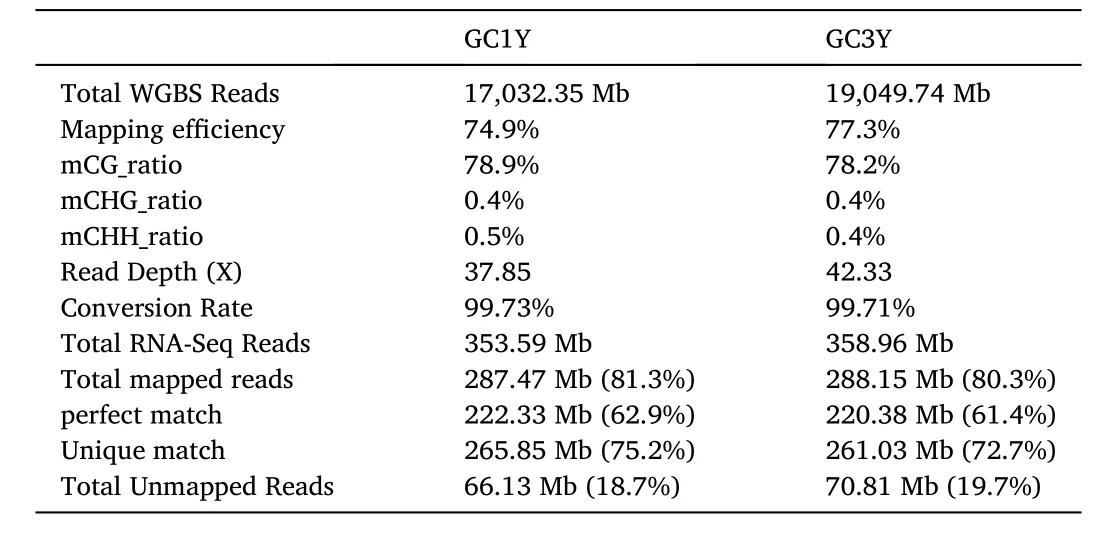
Table 1Overview of whole genome bisulphite sequencing (WGBS) and RNA-Seq.
A total of 3440 DMSs were identified between GC1Y and GC3Y,which were enriched in Exon 1, Intron 1 and Intron 2. Especially,methylation of the first intron was probably linked with gene expression(H. Li et al., 2012), which suggested an important role of the first intron in DNA methylation (Anastasiadi et al., 2018). In addition,down-regulated DMSs with a higher proportion of 60% in grass carp were similar to other vertebrates (Madrigano et al., 2012).
3.2.Functional enrichment analysis of DMGs and DEGs
In total, 2048 DMGs (797 with increased MR and 1251 with decreased MR;P <0.001; Supplementary Table 1) and 4,992 DEGs (535 up-regulated and 4457 down-regulated;P <0.05; Supplementary Table 1) were identified as developing from one-to three-year-old, of which 377 genes overlapping DMGs and DEGs were de fined as DMGs &DEGs (Supplementary Table 2). GO term enrichment clustered functions of the up-regulated DMGs in membrane transport system, such as channel activity, passive transmembrane transporter activity and ion channel activity, and the down-regulated DMGs in cardiovascular system development, vasculature development and ATPase activity (Supplementary Figs. 1a and b). The up-regulated and down-regulated DEGs were mainly enriched in structural molecule activity and mitochondrial part, respectively (Supplementary Figs. 1c and d).
Annotation with the KEGG pathway database revealed that the upregulated DMGs were significantly enriched (adjustedP <0.05; Supplementary Table 3) in “glycosaminoglycan biosynthesis-heparan sulfate/heparin”, “purine metabolism”, “focal adhesion” and “ECM-receptor interaction” pathways (Fig. 2a) and the down-regulated DMGs enriched in “focal adhesion”, “ECM-receptor interaction” and “calcium signaling pathway” pathways (Fig. 2b). The “ECM-receptor interaction”was enriched in both up-regulated and down-regulated DMGs. Extracellular matrix (ECM) consists of a complex mixture of structural and functional macromolecules including fibrous proteins and glycosaminoglycans (Mariman & Wang, 2010). These results indicated that the epigenetic regulation of membrane transport system took place through development of grass carp. In DEGs, “Ribosome” and “RNA degradation”were the abundant pathways in up-regulated DEGs (Fig. 2c), while“spliceosome”, “ribosome biogenesis in eukaryotes”, “protein processing in endoplasmic reticulum” and “oxidative phosphorylation” pathways in down-regulated DEGs (Fig. 2d). “Ribosome” was one of the most enriched pathways that were active in the large yellow croaker during bacterial infection (Mu et al., 2010). “Oxidative phosphorylation” activity was required by antiviral innate immunity (Yoshizumi et al.,2017). These results revealed changes of multiple signaling pathways involved in immunity of the grass carp during development. Moreover,in DMGs & DEGs, the genes of up-regulated DMGs and down-regulated DEGs were enriched in “oocyte meiosis” and “calcium signaling pathway” (Fig. 2e). The genes of down-regulated DMGs and up-regulated DEGs were mainly enriched in “neuroactive ligand-receptor interaction” and “calcium signaling pathway” (Fig. 2f).Calcium acts as a second messenger in many cell types and affects the development and maturation of immune cells (Monika Vig, 2009). The“calcium signaling pathway” was the only enriched pathway in DMGs &DEGs, which revealed the important role of calcium signaling pathway in immunity during the development of grass carp.

Fig. 2.Function enrichment of the DEGs with the KEGG pathway database.(a) Up-regulated DMGs, (b) Down-regulated DMGs, (c) Up-regulated DEGs, (d) Down-regulated DEGs, (e) Up-regulated DMGs & DEGs and (f) Down-regulated DMGs& DEGs. Abscissa is enrichment factors. Ordinate shows the enriched pathways. The circle size represents the number of genes (Count) annotated with the pathway.The color of circle represents P value. (For interpretation of the references to color in this figure legend, the reader is referred to the Web version of this article.)
KEGG pathway annotation revealed the enrichment of phosphoinositide 3-kinase (PI3K) - serine/threonine kinase (Akt) receptor signaling pathway and its related pathways, of which many genes were involved in immune responses, such as Toll-like receptor signaling pathway, T cell receptor signaling pathway, cAMP signaling pathway, Rap1 signaling pathway, JAK/STAT receptor signaling pathway (Supplementary Tables 4 and 5). A map-based pathway analysis illustrated that the PI3K gene was involved in regulation of numerous immune-related biological processes, including cell growth, differentiation, survival,proliferation, migration and metabolism (Okkenhaug & Vanhaesebroeck, 2003)(Fig. 3). Several membrane receptors in PI3K-Akt signaling pathway were differentially methylated or differentially expressed. For instance, the ternary complexes of integrin alpha (ITGA),integrin beta (ITGB) and focal adhesion kinase (FAK) were differentially methylated, and the downstream signaling cascades played a key role in the regulation of protein synthesis, cell cycle and survival, and apoptosis. These complex processes might lead to the different responses between GC1Y and GC3Y when stimulated by the same pathogen.
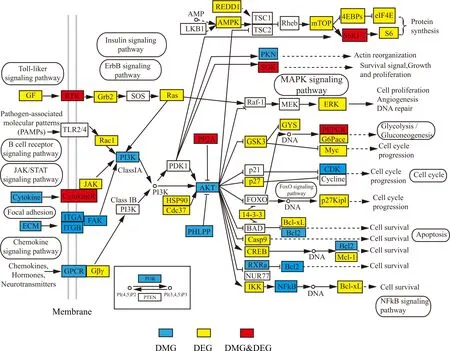
Fig. 3.P13K-AKT signaling pathway annotation of genes generated by KEGG.Blue rectangle indicates DMGs; yellow, DEGs; red, DMGs & DEGs. White rectangle denotes genes that were not identified in the KEGG analysis. White bubble represents the important pathways associated with the genes. (For interpretation of the references to color in this figure legend, the reader is referred to the Web version of this article.)
3.3.The molecular network of the growth- and immune-related genes of DMGs & DEGs
To explore the relationship between the signaling pathway and the enhanced immunity of grass carp during growth, we collected 121 genes, 114 with differential MR>1 and differential gene expression log2FC1, from DMGs & DEGs to study the methylation and gene expression. Prediction of these genes suggested a network of growth- and immune-related genes of AKT, mitogen-activated protein kinase kinase 4 (MAP2K4),mitogen-activated protein kinase 8 interacting protein 3 (MAPK8IP3),mitogen-activated protein kinase kinase kinase 7 interacting protein 1(MAP3K7IP1), signal transducer and activator of transcription 3(STAT3), vascular endothelial growth factor (VEGFA) and epidermal growth factor receptor (EGFR) (Fig. 4a; Supplementary Table 6). AKT,VEGFA (Leung et al., 1989) and EGFR (Aguirre et al., 2010) are critical growth factors, which promote cell proliferation and migration.MAP2K4 (Sanchez et al., 1994), MAPK8IP3 (Iwasawa et al., 2019) and MAP3K7IP1 (Shibuya et al., 2018; Ge et al., 2002) are acting as signal transmissions and regulations in the signaling pathways. STAT3 gene encodes a transcription factor that plays a critical role in mediating cytokine-induced changes in gene expression (Milner et al., 2015). The STAT3 as the down-regulated gene was only detected in the DEGs,however it played a crucial role in the molecular network. A qRT-PCR confirmed different expression in most of these genes (Fig. 4b; Supplementary Table 7). Furthermore, most of them exhibited opposite changes between methylation and expression (Fig. 4c and d), reflecting that transcription was repressed by DNA methylation (Bird, 2002).ITGA9 encodes an alpha integrin that mediate cell-cell and cell-matrix adhesion (Vjugina et al., 2009). The methylated sites of ITGA9 were located in upstream and initial introns while its expression was decreased during growth of grass carp, which suggested that the crucial determinants of gene expression patterns might be the methylated site in the upstream promoter.
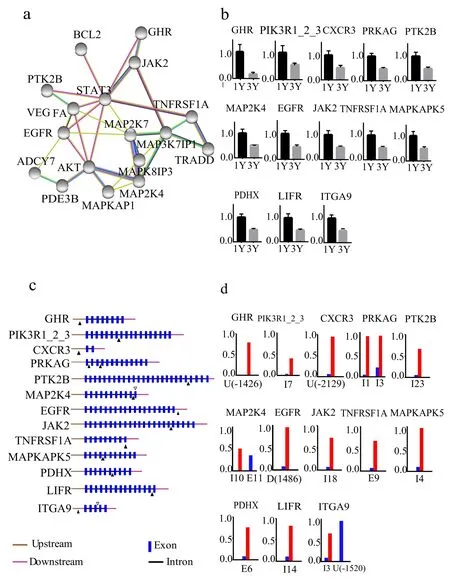
Fig. 4.Characterization of the DMGs &DEGs.(a) Predicted molecular network of the growth-related DMGs & DEGs. The nodes represent the core genes; lines of different color indicate the interaction relationship.(b) The qRT-PCR analysis of the selected DMGs & DEGs. The x axis indicates GC1Y and GC3Y. The y axis indicates the relatively expression level with associated standard error bars. (c) The schematic diagram of the locations of DMSs. Brown line indicates upstream region of gene; red line, downstream region; blue rectangle, exon; black line,intron. The black triangles show the upregulated DMSs, while the white triangles show the down-regulated DMSs. (d) Methylated levels of the selected DMGs & DEGs.The x axis indicates the locations of DMSs.The gene regions of upstream, downstream,exon and intron are abbreviated to U, D, E and I, respectively. Numbers in parentheses represents the distance relative to TSS or TTS. The y axis indicates the relative methylated level. (For interpretation of the references to color in this figure legend, the reader is referred to the Web version of this article.)
3.4.Analysis of the plasma membrane DMGs
Prediction of subcellular localization indicated that DMGs were mainly localized in nuclear and plasma membrane (Fig. 5a), of which the plasma membrane genes were significantly enriched in neuroactive ligand-receptor interaction (KEGG map ko04080, DAVIDP¼ 9.36 10?26) and calcium signaling pathway (KEGG map ko04020, DAVIDP¼3.46 10?6) (Fig. 5b; Supplementary Table 8). Calcium plays a crucial role in regulating cellular division, proliferation, and differentiation during development (Tu et al., 2016; Immler et al., 2018). The calcium signaling pathway regulates diverse functions of the nervous system and is integral to learning and memory formation (Nakamura et al., 2017).We also observed that lots of G protein-coupled receptors (GPCRs) genes involved in neuroactive ligand-receptor interaction pathway exhibited the differential methylation (Fig. 5c). GPCRs constitute a large protein family of cell surface receptors that respond to a variety of external signals and help regulate an incredible range of bodily functions, from sensation to growth to hormone responses and inflammation (Hilger et al., 2018). The ligands, such as somatostatin and Neuropeotide Y,have been reported to be associated with the growth process, appetite and body weight regulation (Hallschmid et al., 2004; Tannenbaum et al.,2003). The visual pigment present in photoreceptor cells is GPCRs that receives light signals from the outer environment (Shichida & Imai,1998), and the light influence on hormone levels that do effects on fish growth (Boeuf & Le Bail, 1999). Consequently, GPCRs appear to be involved in certain age-related development and maturational phases(Bai et al., 2011).
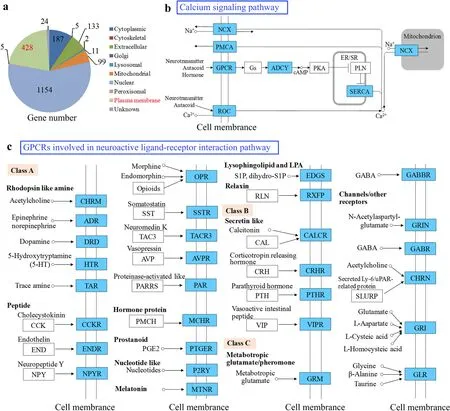
Fig. 5.Characterization of DMGs.(a) Pie chart of 2048 DMGs classified into subcellular localization types with the gene numbers. (b) Enriched pathways of DMGs & DEGs. Blue rectangle indicates the DMGs located in plasma membrane. NCX, PMCA, GPCR, ROC locate in cellular membrane, SERCA in endoplasmic reticulum/sarcoplasmic reticulum (ER/SR)membrane, and NCX in mitochondrial membrane. White rectangle denotes genes that are not identified from DMGs. (c) The GPCRs involve in neuroactive ligandreceptor interaction pathways (reference KEGG map ko04080). Blue rectangle indicates the GPCRs from DMGs involve in neuroactive ligand-receptor interaction pathways. White rectangle denotes genes that are not identified as GPCRs but not DMGs. The GPCRs are divided into three classes (A, B and C). The GPCRs locates in the cell membrane and detect molecules (neurotransmitter, autacoid or hormone) outside the cell. Class A bind rhodopsin like amine, peptide, hormone protein,prostanoid, nucleotide like, melatonin, lysophingolipid and LPA, and relaxin; class B bind secretin like; class C bind metabotropic glutamate/pheromone and channels/other receptors. (For interpretation of the references to color in this figure legend, the reader is referred to the Web version of this article.)
To confirm the gene expression pro files, we conducted the qRT-PCR analysis of the immune-related or growth-related DEGs. The analysis outputs indicated that sequencing of the DNA pools did not reduce the accuracy of data analysis, which was re flected in the following aspects:1) Functional genes were significantly concentrated in PI3K and related immune metabolic pathways. If there were many errors caused by individual differences, the background noises would be too high to observe the significant findings; 2) The correlationship between methylation and transcriptome was tight in the important growthrelated genes; 3) In the study of the subcellular localization of DMGs,many identified genes had been experimentally reported to play key roles in the processes of growth and immunity. Noticeably, all of the results were obtained without any presupposition, but in good agreement with the results of predecessors.
3.5.Expression patterns of DNA methyltransferases
DNA methyltransferases (DNMTs) are essential enzymes involved in DNA methylation (Hermann et al., 2004). Five grass carp DNMT homologs, dnmt1, dnmt3bb, dnmt3ab, dumt3aa and dnmt3bb.1, were identified by the alignment to the zebra fish annotations. The grass carp homologs were de fined according to the phylogenetic relationship with the zebra fish DNMTs (Fig. 6a). The dnmt1 from these two species was shown to be more closely related than other homologs. Expression of grass carp DNMTs were compared between GC1Y and GC3Y (Fig. 6b),which indicated than expressions of dnmt1 were similar in GC3Y and GC1Y, while dnmt3ab, dumt3aa and dnmt3bb.1 exhibited much lower in GC3Y than GC1Y. Transcription of dnmt3bb was not detected in liver.The decreased expressions of DNMTs were consistent with the decreased DNA methylation level during growth. DNMTs not only play critical roles, but also relate with hematopoietic stem cell differentiation,age-associated cognitive and neurodegenerative functions (Challen et al., 2013). The decreased expressions of DNMTs might active the immunity-related gene for disease resistance during development in grass carp.

Fig. 6.Characterization of grass carp DNMTs.(a) Phylogenetic trees generated by the Maximum-Likelihood method. The percentages of replicates in which the associated taxa clustered together in the bootstrap test (1000 replicates) are indicated at the branches. (b) The expression levels (FPKM) of the grass carp DNMTs. The y axis indicates the quantified expression level(FPKM) of GC1Y (red rectangles) and GC3Y (blue rectangles). (For interpretation of the references to color in this figure legend, the reader is referred to the Web version of this article.)
Declaration of competing interest
We declare that we have no financial and personal relationships with other people or organizations that can inappropriately influence our work, there is no professional or other personal interest of any nature or kind in any product, service and/or company that could be construed as influencing the position presented in, or the review of, the manuscript entitled "Characterization of liver transcriptome and DNA methylaiton between one- and three-year-old grass carps".
CRediT authorship contribution statement
Lang Gui: Writing - original draft, Funding acquisition. Wenjie Lu:Formal analysis, Investigation, Writing - original draft. Mijuan Shi:Methodology, Formal analysis. Ruiqin Hu: Investigation. Yan zhou:Investigation, Funding acquisition. Yubang Shen: Resources. Xiaoyan Xu: Resources. Jie Liu: Visualization. Huimin Xia: Visualization.Yaping Wang: Supervision. Wenhao Li: Formal analysis, Supervision.Ying Lu: Conceptualization, Writing - review & editing, Supervision,Funding acquisition.
Acknowledgments
This work is supported by the National Key Research and Development Program of China (2018YFD0900601, 2018YFD0900101), Doctor Fund of Shanghai Ocean University (A2-2006-00-200301) and Science and Technology Development Fund of Shanghai Ocean University (A2-2006-00-200205).
Appendix A.Supplementary data
Supplementary data to this article can be found online at https://doi.org/10.1016/j.aaf.2020.07.003.
Data record
The raw data are deposited in NCBI with SRA accessions numbers:SRR1109833~SRR1109836. The BioSample is available with accession number SAMN14086225 and SAMN14086225 at NCBI and the Bio-Project number is PRJNA606137.
 Aquaculture and Fisheries2022年3期
- Aquaculture and Fisheries的其它文章
- Anthropogenic temperature fluctuations and their effect on aquaculture: A comprehensive review
- Recent advances in application of moving bed bioreactors for wastewater treatment from recirculating aquaculture systems: A review
- Characterization and expression analysis of gonad specific igf3 in the medaka ovary
- Screening and validation of reference genes for qPCR analysis in gonads and embryos of Takifugu bimaculatus
- Assessment of genetic diversity, detection of strain-specific single nucleotide polymorphisms and identification of the Bangladesh and Vietnam strain of Channa striata by PCR-RFLP analysis of the mitochondrial COI gene fragment
- Assessment of dietary chaste tree (Vitex agnus-castus) fruit extract on growth performance, hemato-biochemical parameters, and mRNA levels of growth and appetite-related genes in gold fish (Carassius auratus)