
Morphometric analysis and fluorescent microsatellite markers to evaluate the genetic diversity of five populations of Penaeus japonicus in China
2022-05-18 13:59JinghoDuChunxiuHouXiuliChenJieXioYsmeenGulHunlingWng
Aquaculture and Fisheries 2022年3期
Jingho Du, Chunxiu Hou, Xiuli Chen, Jie Xio, Ysmeen Gul, Hunling Wng,*
aKey Lab of Freshwater Animal Breeding, Key Laboratory of Agricultural Animal Genetics, Breeding and Reproduction, Ministry of Education, College of Fishery,Huazhong Agricultural University, Wuhan, 430070, China
bGuangxi Academy of Fishery Sciences, Guangxi Key Laboratory of Aquatic Genetic Breeding and Healthy Breeding, Nanning, 530021, China
cDepartment of Zoology, Government College Women University Faisalabad, Faisalabad, 38000, Pakistan
Keywords:
Penaeus japonicus
Morphometric analysis
Microsatellite markers
Genetic diversity
Genetic structure
A B S T R A C T
To understand the current status of germplasm resources of Penaeus japonicus, in this study, genetic diversity was analyzed based on morphometric analysis and fluorescent microsatellite markers. For morphometric analysis, the cumulative ratios of the PC1 and PC2 (85.90%) were greater than 75%, which can explain the morphological variation among populations. For microsatellite analysis, the allele number in 10 microsatellite loci ranged from 27 to 53, and the effective allele number ranged from 21 to 42. The observed heterozygosity ranged from 0.463 to 0.983, whereas expected heterozygosity ranged from 0.932 to 0.966, and the average polymorphism information content was 0.947, which indicated a high level of genetic diversity. The unbiased genetic distance among populations ranged from 0.230 to 0.431, and the genetic similarity coefficient ranged from 0.654 to 0.782. Analysis of molecular variance (AMOVA) showed that the genetic variation within individuals was the main source of variation, accounting for 88.55%, and only 1.49% of the genetic variation came from among populations.
1.Introduction
Penaeus japonicusare widely distributed in Japan Sea, East China Sea,South China Sea and Arabian sea (P´erez & Kensley, 1999). Due to higher tolerance to low temperature, fast growth and high nutritional value,P. japonicushas a high economic status in the global shrimp market(Shigueno, 1992). It has been reported that the genetic diversity and differentiation levels ofP. japonicuspopulations on the southeast coast of China are low (Kong et al., 2011). However, it is unclear whether its natural resources have been decreasing with expansion of farming scale and deterioration of the water ecological environment.
In the classification study of aquatic animals, morphological analysis is the most simple and intuitive. The method has widely been used to distinguish different species or animal stocks, such asChamelea gallinaandC. striatula(Ru fino et al., 2006),P. japonicus(Tzeng & Yeh, 1999,2002) andPalaemonetes sinensis(Zhao et al., 2019), and identify evolution lineages of populations, such as marine snails (Vaux et al., 2018).Although morphological measurement is combined with numerical analysis of multivariate statistical traits, population morphology is easily affected by environment, so it is difficult to accurately provide population genetic structure and differentiation information.
Microsatellites also known as simple repeat sequences (SSR)compose of simple tandem repeats with 1–6 nucleotide units, and are widely distributed in the whole genomes (Babaei et al., 2017). As important molecular markers, microsatellites have characteristics with high polymorphism, genetic codominance, easy detection, and low requirements for template DNA compared with other genetic markers.Microsatellite markers can be used to trace pedigrees and monitor inbreeding inP. monodon(Li et al., 2007), and analyze genetic diversity and differentiation of different populations in shrimps (Cao et al., 2017;Dixon et al., 2008). It is found that a certain degree of genetic differentiation exists inP. vannameipopulations in Mexico based on microsatellite analysis (Soto-Hern´andez & Grijalva-Chon, 2004). To understand the current status of germplasm resources and evaluate the genetic diversity ofP. japonicus, here, we used morphological analysis and microsatellite markers to estimate the degree of genetic differentiation and diversity amongP. japonicusdifferent populations. This information will be helpful to understand the germplasm resources ofP. japonicus, and provide references for its artificial release, reproduction and utilization.
2.Materials and methods
2.1.Sample collection and DNA extraction
P. japonicuswere sampled for five populations from ZhouShan (ZS, E 122◦20′N 30◦00′), FuZhou (FZ, E 119◦30′N 26◦08′), XiaMen (XM, E 118◦08′N 24◦48′), ZhanJiang (ZJ, E 110◦35′N 21◦27′) and BeiHai (BH,E 109◦12′N 21◦48′) from autumn of 2018 to spring of 2019, with 35 individuals for each population. The muscle (about 100–150 mg) from the sixth abdominal somite ofP. japonicuswas taken and stored in anhydrous ethanol at −20 ℃. Genomic DNA was extracted by conventional method (Sambrook et al., 1989). The DNA concentration was determined by ultra-micro UV spectrophotometer and diluted to 150 ng/μL.
2.2.Morphometric analysis
The five populations were de fined as two varieties, I and II, based on characteristic bands on the lateral carapace (Tsoi, Wang, & Chu, 2005).Variety I exhibited two characteristic bands extending from the dorsal to the lateral carapace, whereas these bands without extend to the lower half of the lateral carapace were in variety II (Fig. 1). The ZS, XM and FZ populations belonged to variety I, and the other two populations belonged to variety II.

Fig. 1.The two varieties I and II characterized by different banding patterns on the lateral carapace. Arrows indicate the banding difference between the two varieties.
2.3.Genetic diversity analysis based on microsatellite markers
Microsatellite primers (Table 1) ofP. japonicuswere selected and synthesized from published study (Moore et al., 1999). The PCR reactions were performed in 20 μL volume containing 2 μL 10×PCR buffer,1.0 μL (150 ng/μL) genomic DNA, 0.6 μL (10 μmol/L) each primer, 0.3 μL dNTP, 0.3 μLTaqDNA polymerase, and 15.2 μL ddH2O. The PCR amplification procedure was conducted at 95 ℃ for 3 min, followed by 32 cycles each consisting of 30 s at 95 ℃, 30 s at 50 ℃ or 55 ℃ (an optimized annealing temperature for each primer pair), and 20 s at 72 ℃. A final extension of 7 min at 72 ℃ was then carried out.Amplification products were electrophoresed in 8% denaturing polyacrylamide gel. Finally, 10 primers with better amplification were used for PCR amplification in five different populations, and the PCR products were analyzed by ABI3730 analytical instrument. GeneMarker v1.6(Holland & Parson, 2011) was used for genotyping.
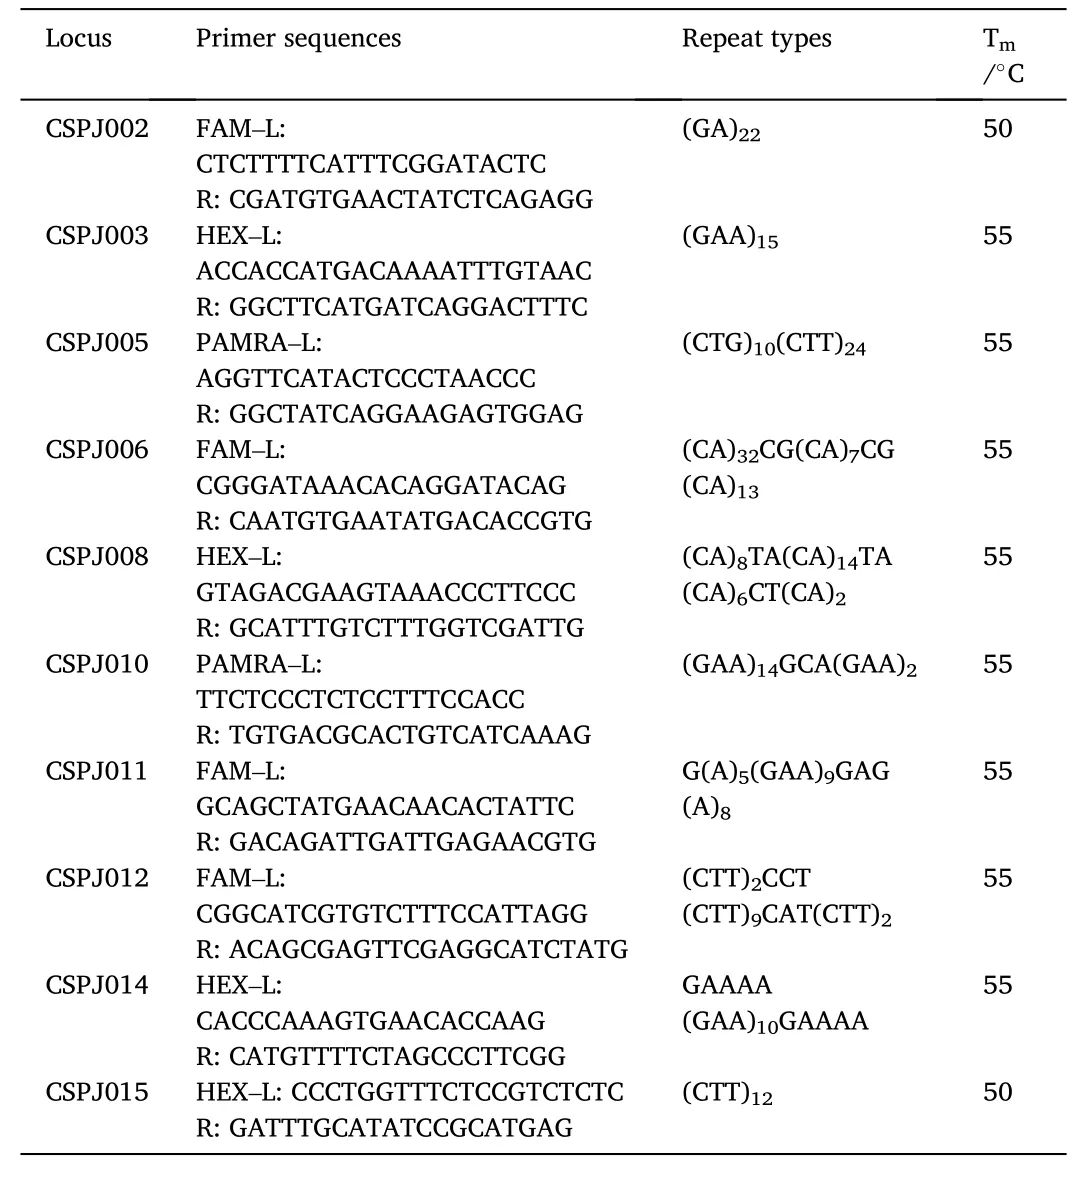
Table 1Characters of 10 microsatellite primers.
Cervus v3.0 (Kalinowski, 2010) software was used to calculate polymorphism information content (PIC), frequency of alleles and genotypes, and heterozygosity. The unweighted pair-group method with arithmetic average (UPGMA) cluster dendrogram was performed based on Nei’s genetic distance matrix with MEGA6 (Tamura et al., 2007).Arlequin v3.1 (Excof fier, 2007) was used for analysis of molecular variance (AMOVA), and calculation of population genetic differentiation index (FST). Genetic bottleneck effect was analyzed by Bottleneck v1.2.02 (Piry et al., 1999).
3.Results
3.1.Morphometric analysis
Principal component (PC) analysis was performed on 10 morphological characters of 175 samples to obtain two unrelated principal components with eigenvalues greater than 1, and the results showed that the cumulative ratios of PC1 and PC2 were 75.68% and 10.22%,respectively, based on eigenvalues and cumulative ratios corresponding to the two principal components (Table 2).
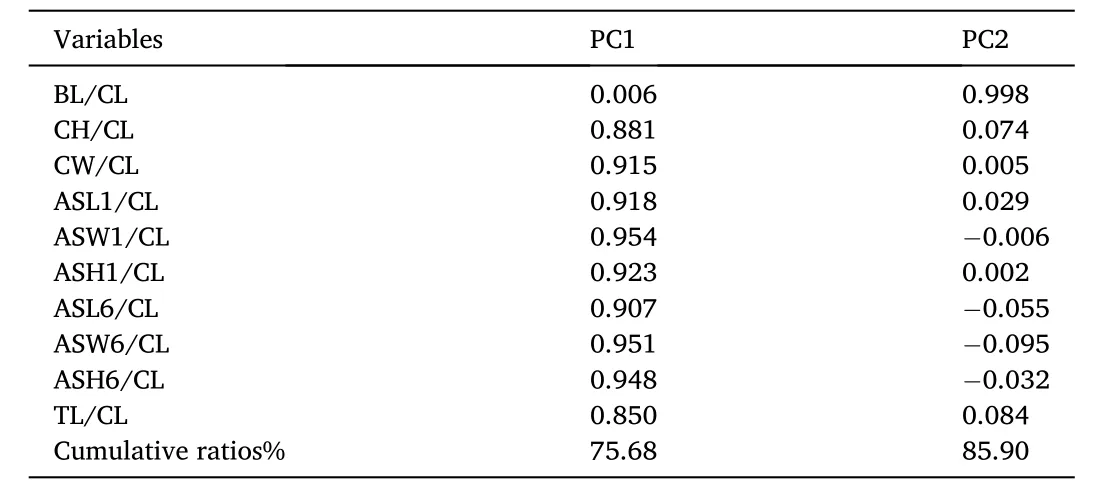
Table 2Eigenvalues and cumulative ratios of two principal components for five populations.
The principal component values were shown based on the eigenvalues and scatter plot for PC2 and PC1 (Fig. 2). But it was difficult to distinguish individuals from the four populations FZ, XM, ZJ and ZS due to overlap existed among most of four populations. The BH population and the other four populations also had a dividing line with PC2 =0.00,indicating that the BH population differed from the other four populations in CH/CL represented by PC2. These results demonstrated that the morphological differences among the five populations were mainly re flected in BL/CL and CH/CL.
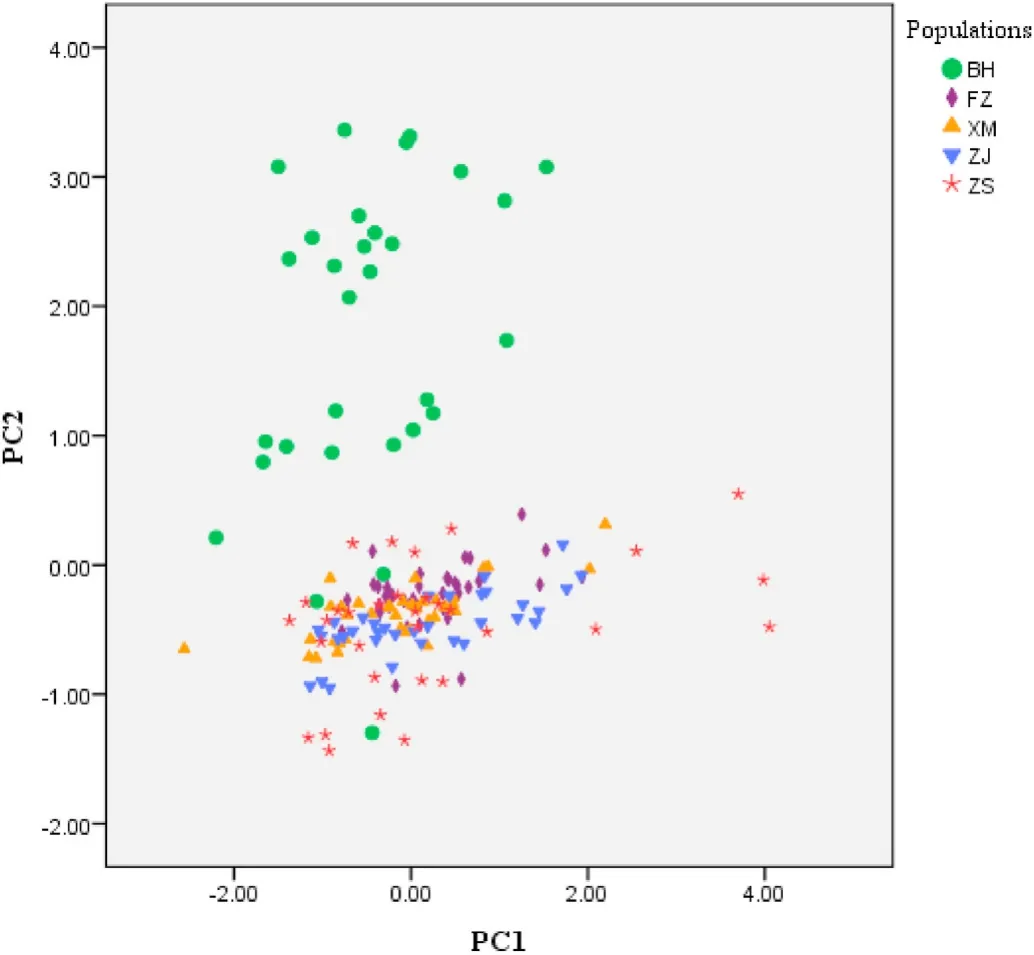
Fig. 2.Principal component analysis (PCA) plot of two principal components based on 10 characters in five populations. Missing data are treated with replaced-by-mean method. PC1 represents 75.68% mutation contribution ratios, PC2 represents 10.22% mutation contribution ratios.
Based on 10 morphological characters, the five populations ofP. japonicuswere clustered, which the XM, FZ and ZJ populations were clustered into one and then clustered with the ZS population. The BH population was clustered alone into a branch (Fig. 3).
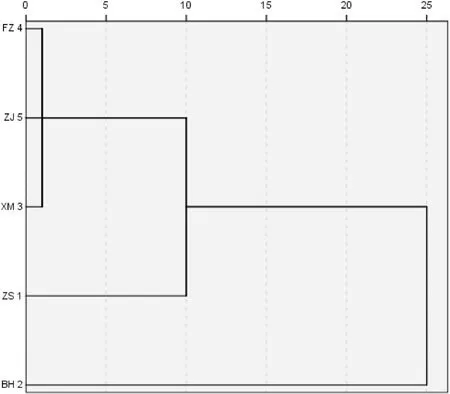
Fig. 3.Dendrogram showing the relationship of five populations based on morphometric analysis. The horizontal axis numbers indicate average joins among populations.
3.2.Genetic diversity analysis
3.2.1.Genetic diversity of microsatellite loci
The allele number of all the loci in five different populations ranged from 27 to 53 with average number of 42. The effective allele number ranged from 21 to 42, and the effective allele number of single locus was 23–43. Observed (HO) and expected (HE) heterozygosity ranged from 0.463 to 0.983 (mean value, 0.792) and from 0.932 to 0.966 (mean value, 0.952), respectively. The polymorphism information content(PIC) was 0.947, while the highest was 0.962 for the CSPJ003 locus and the lowest was 0.925 for the CSPJ015 locus. F-statistics were estimated in a fixation index as genetic differentiation (FST), inbreeding coefficient in the overall populations (FIT), inbreeding coefficient within populations (FIS), which the average values were 0.103, 0.137 and 0.129 respectively. No deviation from Hardy–Weinberg equilibrium (HWE)occurred at these loci in the five populations (Table 3).
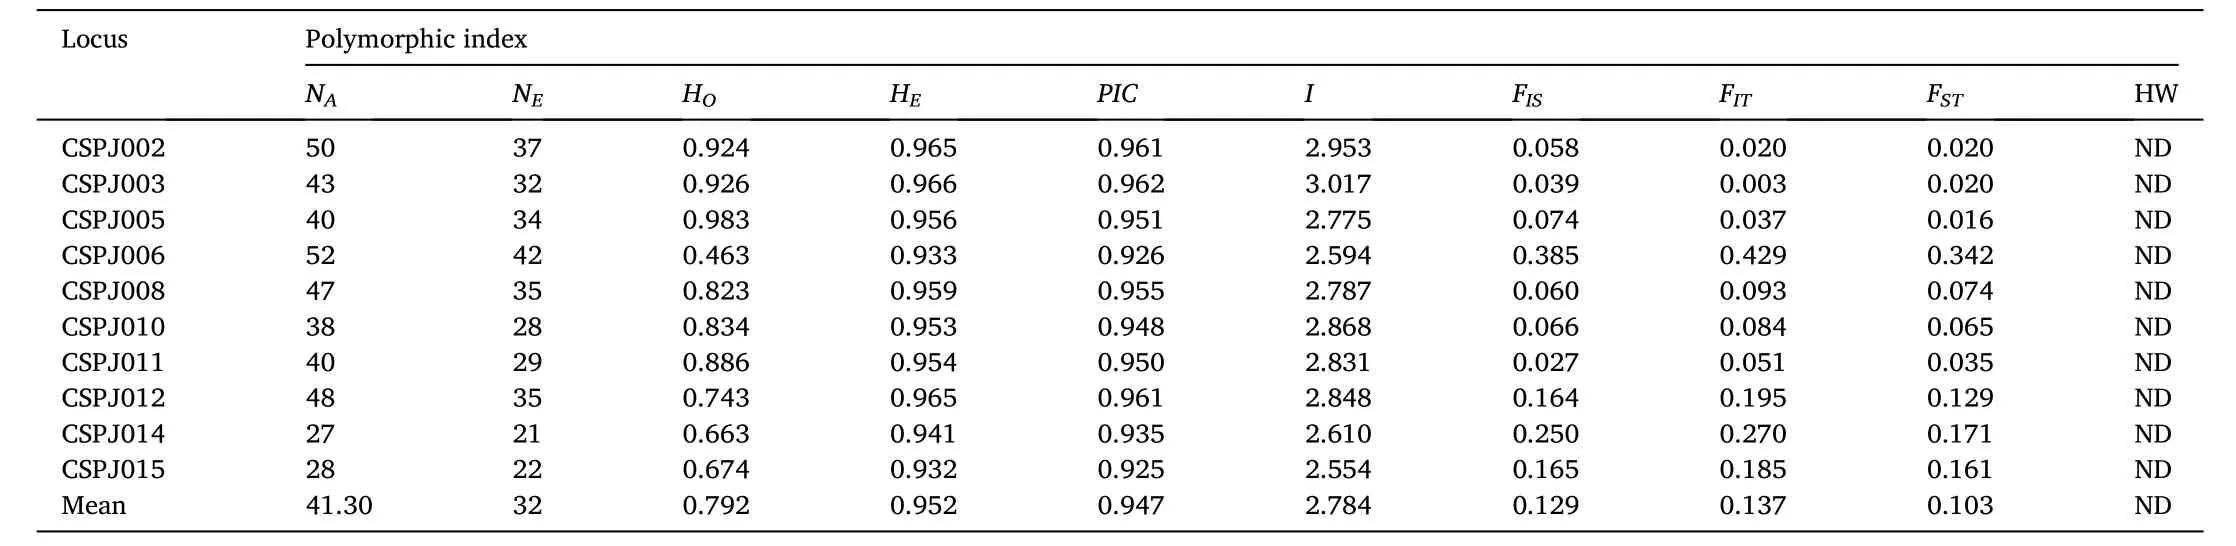
Table 3Polymorphism of 10 microsatellite loci.
3.2.2.Population genetic diversity
随着云计算、大数据、物联网等信息技术与传统物流业态深度融合,特别是移动互联网应用终端的普及,正在给公路货运行业带来深刻的变革。
The number of alleles among the five populations ranged from 20.6 to 23.80, which the average allele number was 21.92. The effective allele number ranged from 12.07 to 14.63 with the average value of 13.32. The observed heterozygosity ranged from 0.791 (BH) to 0.886(ZJ). The expected heterozygosity was between 0.912 (BH) and 0.931(ZJ). The average of the observed and expected heterozygosity was 0.833 and 0.920, respectively. The Shannon’s information index was between 2.697 and 2.906 for the lowest in the BH population and the highest in the ZJ population, with an average of 2.784. The interpopulation genetic differentiation indexFSTwere 0.048–0.133 (Table 4).
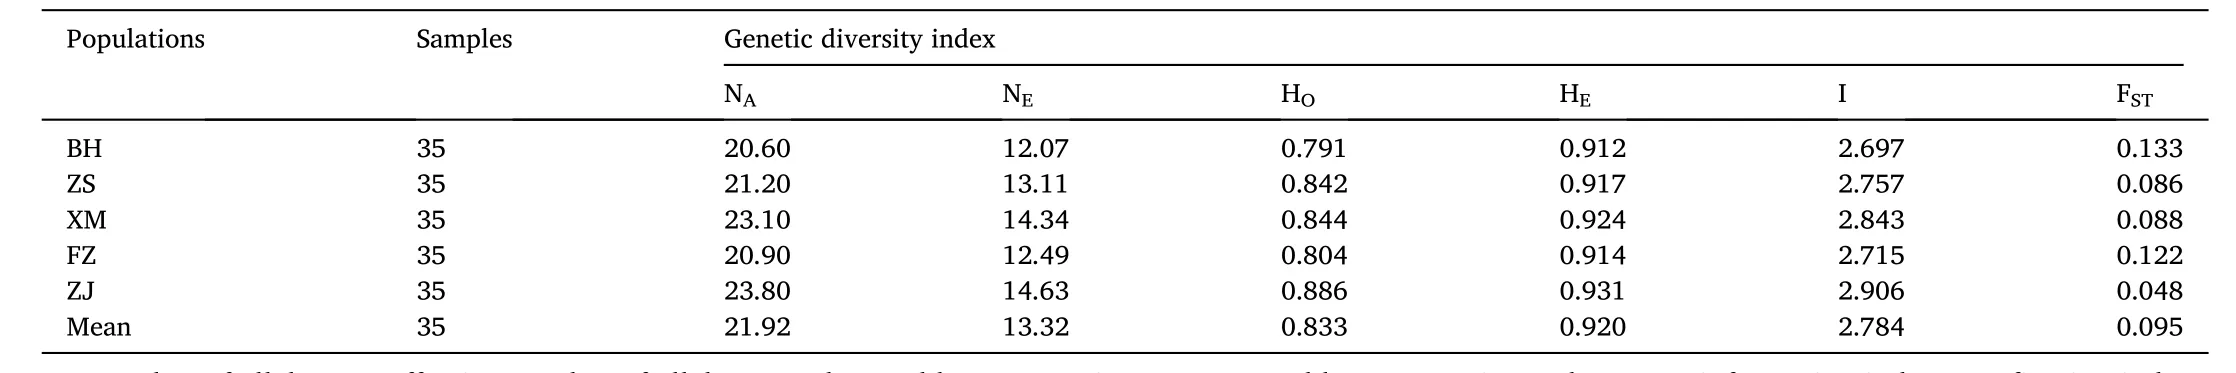
Table 4Genetic diversity of five populations.
3.2.3.Population genetic structure
The unbiased genetic distance among the five populations ranged from 0.230 to 0.431 and the genetic similarity coefficient ranged from 0.654 to 0.782. The maximum genetic distance existed between the BH and ZJ populations, while the minimum was between the XM and FZ populations. The genetic similarity coefficient between the BH and ZJ population was the smallest (Table 5).

Table 5Genetic distance (below diagonal) and genetic similarity (above diagonal)indices among five populations.
The UPMGA cluster tree was constructed based on Nei’s genetic distance matrix, and the result (Fig. 4) showed that the XM population was firstly clustered into one branch with the FZ population, followed by the ZJ and ZS populations. And then, the BH population was finally clustered together with other four populations.
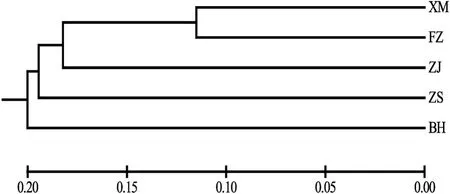
Fig. 4.The UPMGA cluster tree based on genetic distance of five populations.The horizontal axis numbers indicate genetic distance.
3.2.4.Population genetic variation analysis
AMOVA analysis revealed that most of the genetic variation in the five populations came from within populations, accounting for 88.55%and only 1.49% of the genetic variation came from among populations.The population genetic differentiation indexFSTwas 0.015 (P <0.05)(Table 6).
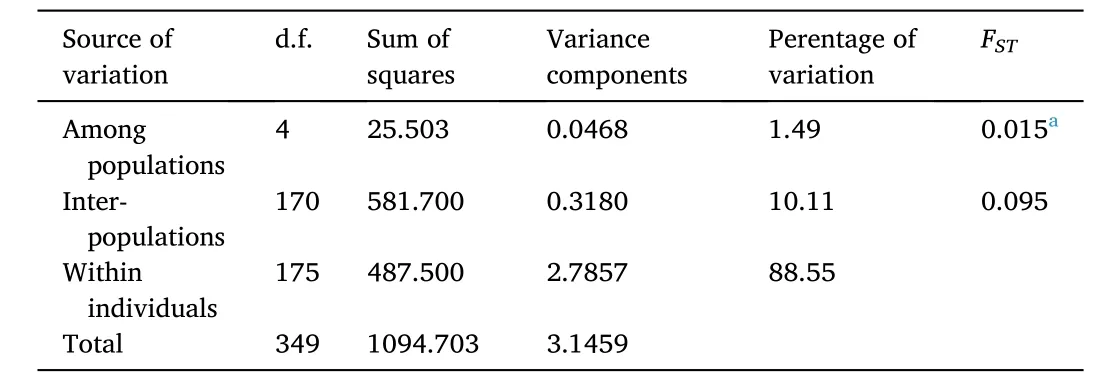
Table 6Genetic diversity parameters of five populations.
3.2.5.Bottleneck effect analysis
Based on the IAM and TPM mutation model, the BH and ZJ populations had experienced a recent bottleneck effect (P <0.05)(Table 7), while bottleneck effect was not occurred in other populations.Mutation-drift equilibrium and the allele frequencies of five populations showed normal L-shaped distribution (Fig. 5).
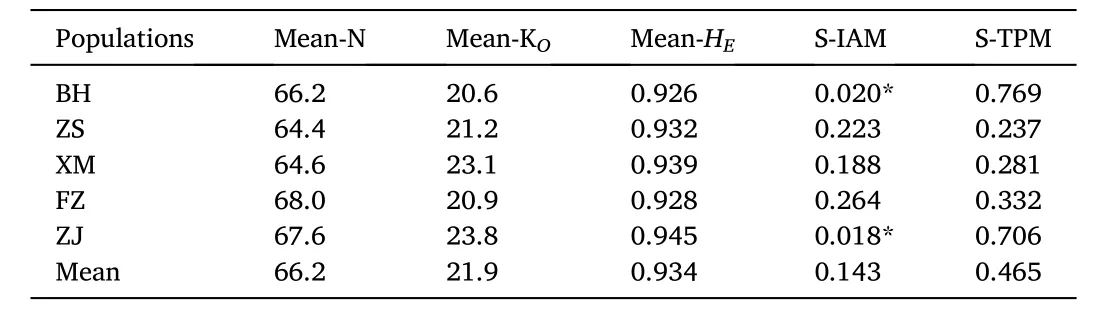
Table 7Probabilities from tests for bottlenecks in five populations under IAM model.
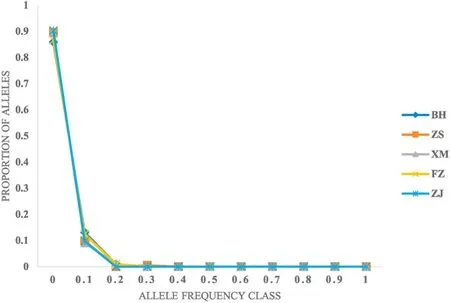
Fig. 5.Mode shift graph showing ‘L-shaped’ distribution and indicating the absence of bottleneck in five populations.
4.Discussion
4.1.Morphometric characters
Morphology is the simplest and most intuitive method for identifying differences between species and populations (Rajakumaran et al., 2014;Adams et al., 2004; Maderbacher et al., 2008). Analysis based on combined morphology and molecular markers find thatP. japonicushave occurrence morphological and genetic variation on two varieties (Tsoi et al., 2005). In this study, variety I exhibited two characteristic bands extending from the dorsal to the lateral carapace, whereas these bands without extend to the lower half of the lateral carapace were in variety II(Fig. 1). The ZS, XM and FZ populations belonged to variety I, and the other two populations belonged to variety II.
In order to investigate the differences among different geographic populations ofP. japonicus, principal component analysis is performed.The cumulative ratios of the PC1 and PC2 are 85.90% greater than 75%,indicating that these five populations may have certain differences in morphological characteristics. The cluster analysis, further confirmed that the differences in geographical environment might have effect on the morphological characteristics of different populations. The external characteristics of animals are affected by genetic and environmental factors. The same species living in different areas might have differences in morphological characteristics, living habits, and so on (Carvalho et al., 2019).
4.2.Genetic diversity and genetic structure
This study showed that the allele numbers at all loci were greater than the effective allele numbers, which were higher than that reported in other species of penaeids (Benzie, 2000; Xu et al., 2001; ). Genetic heterozygosity (also known as genetic diversity), refers to the proportion of heterozygous genotypes at all microsatellite loci and is considered to be an optimal parameter for measuring population genetic variation.The observed heterozygosity is closed to the expected heterozygosity,indicating that the population tends to be at equilibrium. Observed heterozygosity is easily affected by population size. However, expected heterozygosity is only affected by inheritance, so expected heterozygosity could more accurately re flect the level of genetic diversity. In this study, the expected heterozygosity of all loci was above 0.900, indicating that populations had a high level of genetic diversity, which was much higher than that ofAristeus antennatus(Sandra et al., 2016),P. monodon(Cyrus et al., 2017) andP. japonicus(Zhuang et al., 2000). In decapod shrimps, polymorphism levels are usually high, with abundant alleles and heterozygosity levels close to 1.000 (Scarbrough et al.,2002). In most studies in other decapods, due to the presence of null alleles, significant deviation from HWE resulted in positiveFvalues(Supungul et al., 2000; Ball & Chapman, 2003; Pan et al., 2004; Cannas et al., 2008; Dambach et al., 2013; Miller et al., 2013). However, there was no deviation from HWE, in this study, andFvalues positively,indicating that the five populations were in a relatively stable state.PICis a good measure of fragment polymorphism index. Botstein (1980) first proposedPICindex to measure the degree of genetic variation: whenPIC >0.5, it was a highly polymorphic site. In this study, thePICmean value was 0.947, indicating that these loci were highly polymorphic.Yuan et al. (2015) found that thePICmean value was between 0.25 and 0.5, most of these loci were moderate polymorphic sites. These indicate that the microsatellite loci are at higher polymorphic degree in shrimps.
The levels of genetic differentiation among populations are usually measured by genetic distance and genetic differentiation coefficient, and the greater genetic distance and genetic differentiation coefficient among different populations represent the higher level of genetic differentiation. Sharma et al. (2019) believed a suboptimal association between genetic and geographic distances of populations and indicated that the genetic structure ofP. japonicuspopulations might be affected by geographical distance. Fischer et al. (2000) found that the correlation between genetic distance and geographic distribution was mainly due to the influence of gene flow. In this study, the XM population was firstly clustered into one branch with the FZ population with the closest geographical distance, followed by the ZJ and ZS populations. Finally,the BH population was clustered together with other four populations. It was similar to the dendrogram of five population relationships based on morphometric analysis. These results suggested that the unbiased genetic distance among the five populations was not correspond to the geographical distance. Kong et al. (2011) also found that the genetic distance was not correspond to the geographical distance among the three populations ofP. japonicus. The geographical isolation of Leizhou peninsula and Hainan island reduces the chance of gene flow bewteen the BH population and other populations, resulting in less migration and hybridization among populations in different waters, and geographical isolation. In recent years, the coastal provinces actively promote the artificial release and reproduction ofP.japonicus. Under the implementation of the policy of reproduction and release, its genetic diversity has been effectively protected, which is re flected in the high level of genetic diversity of the populations after artificial release (Wei et al.,2016). It is suggested that geographical distribution is not the only factor affecting gene flow. AMOVA results showed that only 1.49% of the variation came from among populations, and within population variation accounted for 88.55% of the total variation, indicating that variation within population was the main source of variations ofP.japonicus.The genetic differentiation indexFSTmean values of among populations and inter-population were 0.015 and 0.095, respectively, suggesting low levels of genetic differentiation among populations and moderate levels inter-population (Wright, 1990). The results were similar toP.japonicus(Kong et al., 2011; He et al., 2012),Fenneropenaeus chinensis(Zhang et al., 2005) andP. vannamei(Xie et al., 2009). But, the results of genetic variation were quite different from morphological variation. Many studies have shown that the great morphological variation of populations but low genetic variation inRapana venosa(Ban et al., 2012),Conger myriaster(Yin et al., 2020) using microsatellite or mitochondrial DNA markers. Recent years, in China coastal areas, especially Fujian,Guangxi and Hainan provinces, the scale ofP. japonicusculture has greatly expanded. However, due to abnormal climate changes, disease prevalence and other reasons, many breeding individuals died, and the aquaculture water with surviving larvae discharged to the sea without treatment, causing the natural populations captured actually grew from artificially cultivated seedlings (Kong et al., 2011). R´egnier et al. (2017)found that the time span required for genetic differentiation of populations was longer than morphological differences. The variation of morphological characteristics is the result of adaptation to specific habitat conditions in their living habits, morphological structure and physiological functions. These may be the reasons for the great morphological variation ofP. japonicuspopulations but low genetic variation. Genetic similarity of the populations is between 0.622 and 0.782, indicating the cryptic species differentiation among populations(Thorp, 1994).
The BH and ZJ populations had experienced a recent genetic bottleneck, and other populations had not. It was found that mutationdrift equilibrium and the allele frequencies of five populations were L-shaped. Tang, Yang, Zhao, Wang, & Li (2016) found that populations ofOreochromis niloticusexperienced a recent genetic bottleneck and exhibited the presence of a normal L-shaped distribution. Although the populations may have experienced genetic bottlenecks recently, the size of the populations may have recovered due to new mutations and gene flow that exhibited the presence of a normal L-shaped distribution. The genetic bottleneck might be caused by populations reduction due to factors such as artificial fishing and climate. Genetic deterioration increased with the decrease of population size, and it happened mainly for two reasons: inbreeding and genetic drift (Sbordoni et al., 1986;Benzie, 2000).
The present study based on morphometric analysis and fluorescent microsatellite markers assessed genetic diversity of five populations ofP.japonicus. These populations with closer geographical distances showed the higher similarity among populations. Genetic differentiation and geographical distances among populations indicated that habitat conditions, contemporary environmental conditions and human activities were probably responsible for genetic variations ofP.japonicuspopulations, which could be the primary factors for influencing population genetic structure. This study will have a positive assistant effect on the breeding programs ofP.japonicusfor the development of aquaculture and long-term conservation. Therefore, it is necessary for breeding work to adopt to retain enough effective population and expand the number of breeding parents to avoid or reduce bottleneck effects in the future.
Acknowledgments
This work was supported by Science and Technology Major Project of Guangxi (NO. AA17204088).
猜你喜欢
今日农业(2022年1期)2022-11-16
现代装饰(2022年3期)2022-07-05
当代陕西(2021年21期)2022-01-19
非公有制企业党建(2020年8期)2020-08-27
海峡姐妹(2020年7期)2020-08-13
无人机(2018年1期)2018-07-05
无人机(2017年10期)2017-07-06
专用汽车(2016年5期)2016-03-01
太空探索(2014年6期)2014-07-10
视野(2012年2期)2012-07-26
 Aquaculture and Fisheries2022年3期
- Aquaculture and Fisheries的其它文章
- Anthropogenic temperature fluctuations and their effect on aquaculture: A comprehensive review
- Recent advances in application of moving bed bioreactors for wastewater treatment from recirculating aquaculture systems: A review
- Characterization and expression analysis of gonad specific igf3 in the medaka ovary
- Liver DNA methylation and transcriptome between 1- and 3-year-old grass carp
- Screening and validation of reference genes for qPCR analysis in gonads and embryos of Takifugu bimaculatus
- Assessment of genetic diversity, detection of strain-specific single nucleotide polymorphisms and identification of the Bangladesh and Vietnam strain of Channa striata by PCR-RFLP analysis of the mitochondrial COI gene fragment