A learning-based approach for solving shear stress vector distribution from shear-sensitive liquid crystal coating images
Jisong ZHAO, Jinming ZHANG, Boqiao WANG
a College of Astronautics, Nanjing University of Aeronautics and Astronautics, Nanjing 210016, China
b Faculty of Rocket and Space Technology, Kharkiv Aviation Institute, National Aerospace University, Kharkiv 61070, Ukraine
KEYWORDS Shear stress;Measurement;Shear-sensitive liquid crystal;Learning-based approach;Calibration
Abstract A learning-based approach for solving wall shear stresses from Shear-Sensitive Liquid Crystal Coating (SSLCC) color images is presented in this paper. The approach is able to learn and establish the mapping relationship between the SSLCC color-change responses in different observation directions and the shear stress vectors,and then uses the mapping relationship to solve wall shear stress vectors from SSLCC color images. Experimental results show that the proposed approach can solve wall shear stress vectors using two or more SSLCC images,and even using only one image for symmetrical flow field.The accuracy of the approach using four or more observations is found to be comparable to that of the traditional multi-view Gauss curve fitting approach; the accuracy is slightly reduced when using two or fewer observations. The computational efficiency is significantly improved when compared with the traditional Gauss curve fitting approach, and the wall shear stress vectors can be solved in nearly real time. The learning-based approach has no strict requirements on illumination direction and observation directions and is therefore more flexible to use in practical wind tunnel measurement when compared with traditional liquid crystal-based methods.
1. Introduction
The measurement of shear stresses on solid surfaces provide a valuable insight into the physics of wall-bounded flows, and can therefore be used for development and evaluation of theoretical fluid dynamics models.It is also an enabling technology for the assessment of fluidic vortex generator jets or other flow control devices.Additionally, wall shear stress measurement can identify the contribution of viscous drag to the overall loss due to aerodynamic drag. In aircraft, much effort has been devoted to pressure drag reduction, but viscous drag has not received the same level of attention. This has resulted, in part,from our inability to quickly and accurately measure wall shear stresses, especially the shear stress distribution.
Although various methodshave been developed for wall shear stress measurement, the measurement of wall shear stresses still remains very challenging. The mechanical or electrical sensors,such as mechanical balances,intrusive probes,or Micro-Electro-Mechanical Systems (MEMS),are typically complicated, disturb the flow, destroy the surface, and measure point-wise. The liquid crystal coating-based or oil film-based methods,on the other hand,have been reported to be able to measure the global wall shear stress distribution on the surface efficiently with a high spatial resolution in a non-intrusive manner. However, there are still some problems with the global measurement methods. For the liquid crystal coating-based methods, the sensitivity of liquid crystal coatings to illumination and observation angles is a major barrier to use such technique, especially on complicated models.In addition, the coatings themselves are often a problem, e.g.the coatings may be stripped off a model in regions of high shear stress. The problems of the oil film method include the plague due to dust,the change of oil viscosity and density with temperature, the tedious process of identifying the fringe patterns and so on.As a consequence,these global measurement methods are still under development,and have not been widely used in practical wind tunnel measurement.
The Shear-Sensitive Liquid Crystal Coating (SSLCC) technique is a non-intrusive global wall shear stress measurement technique.The SSLCC that forms on a solid surface,approximately 10 μm in thickness, is comprised of helical structures that are extremely optically active. Under applied shear at either boundary of the coating,the incident white light is reflected in a highly directional manner, as a threedimensional color spectrum in space.The SSLCC color is known to vary with the shear stress vector direction and magnitude, the observation direction and the illumination direction. When the SSLCC color is calibrated against these parameters, the visualized color images can be converted into a shear stress vector field, which is the method of the SSLCC technique. The greatest challenge of the SSLCC technique is that the SSLCC color-change response is sensitive to several parameters (the shear direction and magnitude, the observation direction, the illumination direction, and so on), which makes it difficult to calibrate the SSLCC color.
Considerable efforts have been made by Reda et al.,Fujisawa et al.and Zhao et al.to develop SSLCCbased methods for quantitative wall shear stress measurement.The SSLCC technique has been used for the measurements of wall shear stress vector fields over planar surface in several typical flows,e.g.,the wall-jet flows,the oblique impinging jet flow,the flows around cylinders,the flow behind a vortex generator or a protuberance,and the flow in a small open jet wind tunnel,and some encouraging and impressive resultshave been obtained. Efforts were also made to measure shear stress over curved surface.However,these studies were all conducted in special arrangements where there are strict requirements on the illumination direction and the observation directions, so that the observed coating color can be fitted into Gauss curves and then the shear stresses can be determined by fitting the Gauss curvesor by interpolating between two sets of the calibrated Gauss curves.However, in practical wind tunnel measurement, there are usually some obstacles, e.g. the obstacle due to the wall of the tunnel,and as a result it is difficult to meet the strict requirements on the illumination and observation directions. This is one of the important factors that hinder the practical application of the SSLCC measurement technique.
Over the past decades, machine learning-based approaches have been extensive studied and widely used in scientific and industrial fields.It has been proved that a neural network with two or more layers has the ability to accurately approximate any continuous nonlinear functions. The traditional liquid crystal-based methods solve wall shear stress vectors (both shear magnitudes and directions) from the SSLCC color images observed from several different directions. Obviously,each of such methods to solve wall shear stress vectors can be regarded as a mapping system with multiple inputs and two outputs. The basic idea of the present paper is to use the learning-based approach to establish the mapping relationship between the coating colors observed from different directions and the wall shear stress vectors. Then, the established relationship can be used to solve wall shear stress vectors from the coating color images.Because the learning-based approach does not require any Gauss curve fit,it has no special requirement on the illumination direction and the observation directions, and therefore is more flexible to use in practical wind tunnel measurement.
The left of the present paper is organized as follows. Section 2 gives a brief review of the traditional methods for solving shear vector filed from SSLCC color images. Section 3 describes the proposed learning-based approach for solving wall shear stress vector distribution from SSLCC coating color images. Section 4 gives the experimental results and discussions, where the effectiveness of the proposed learning-based approach for solving wall shear stress vector distribution is demonstrated and some features of the approach are discussed.Finally, the conclusions of this paper are summarized in Section 5.
2. Overview of traditional approaches for solving shear stresses from SSLCC color images
The traditional approaches to solve shear stress vectors from the SSLCC color images can be classified into two categories:one is the multi-view Gauss curve fitting approach and the other is the two-view approach. The Gauss curve fitting approach was developed by Reda et al.and it determines the shear stress vector at each physical point on the wall surface by fitting the SSLCC color-change responses recorded at different observation views using a Gauss curve. The twoview approach was also originally proposed by Reda et al.and further studied by Fujisawa et al.,in which the shear stress vector at each physical point is determined by minimizing the interpolation error between two calibrated Gauss curves. Reda et al.found that the two-view approach is less accurate when compared with the Gauss curve fitting approach, because it uses only two observation directions while the Gauss curve fitting approach uses five or more observations.
The SSLCC color-change response is very complex and the color is sensitive to several variables, e.g., shear magnitude,shear stress, illumination direction and observation direction.Moreover,both the illumination direction and the observation direction are described by two angle parameters. As a consequence, it is rather difficult to calibrate the observed SSLCC colors against shear stress vectors.In order to reduce the complexity and the difficulty of calibration, strict restrictions on the observation directions and the illumination direction are required in both the Gauss curve fitting approach and the two-view approach.
Taking the Gauss curve fitting approachas an example,it is required to record the SSLCC color-change responses from five or more different oblique-view observations. The multiple observations are usually evenly distributed between - 90° and + 90° of the mainstream direction. The above-plane view angle of each observation is required to be the same and fixed at about 30°. The light illumination direction is required to be fixed in the normal direction perpendicular to the test surface. Four image-processing and analysis procedures are performed to determine the wall shear stress vector field from the measured color-change responses in a SSLCC, as shown in Fig. 1. The symbol αis the aboveplane view angle, which is defined as the angle between the light of sight and the plane of the test surface and measured positively upward from zero in the plane of the test surface.The symbol φis the circumferential view angle of each camera in the plane of test surface, measured positive counterclockwise from origin at the reference direction (φ = 0°).The symbol φis the orientation of the shear stress vector,also measured positive counterclock wise from origin at the reference direction. In Step I, a single calibration curve of colour(hue) versus shear magnitude is obtained for the specific arrangement wherein the shear vector is aligned with and directed away from the camera. In Step II, full-surface images of the SSLCC colour-change response to an unknown wall shear stress field are recorded synchronously from multiple in-plane view angles (here, φ-φ). In Step III, for each physical point on the test surface, a Gaussian curve is fit to the hue versus in-plane view angle data, and the angular location of the peak of the Gaussian curve gives the shear direction. In Step IV, the peak of the Gaussian curve is used along with the calibration data of hue versus shear magnitude that are obtained in Step I to determine the shear magnitude.Steps III and IV are repeated for each physical point on the test surface to determine the full surface shear stress vector field. For a more thorough description, the reader is directed to literature.
One important and critical procedure in the Gauss curve fitting approach described in Fig. 1 (Step III) is that a Gaussian curve fit of the measured hue (color) versus circumferential view angle is required,

where H, φ, H(φ) and σ are the four parameters for the Gaussian curve and can be solved using the Levenburg-Marquardt method.The parameter His the hue observed for a circumferential view angle normal to the shear vector.The angular location of the peak of the Gaussian curve, φ,gives the shear direction. The peak of the Gaussian curve, H(φ), is referred to as the vector-aligned hue and is used along with the calibration data that are obtained in Step I in Fig.1 to determine the shear magnitude. The parameter σ is the standard deviation of the Gaussian distribution.
It can be seen that strict requirements on illumination direction and observation directions are required in the Gaussian curve fitting approach; otherwise the measured SSLCC colors cannot be fitted into Gauss curves. The strict requirements on illumination and observation directions make the Gaussian curve fitting approach difficult to be used in practical measurement, because there are usually some obstacles in wind tunnel measurements, e.g. the obstacle due to the wall of the tunnel,and it is difficult to meet the strict requirements on the illumination and observation directions. Similar problems exist for the two-view approach.
3. Learning-based approach for solving shear stress vector distribution
A learning-based approach is proposed in the present paper for solving wall shear stress vector distribution from the SSLCC color-change responses. The basic idea is to use the multi-layer neural network algorithm, a subset of learning algorithms, to learn the SSLCC color-change responses in the selected observation directions under different shear stress vectors,and to establish the mapping relationship between the SSLCC color change-responses in the selected directions and the shear stress vectors.The multi-layer neural network is used because researches have shown that the neural network with more than two hidden layers can approximate any continuous function accurately. The established mapping relationship is then used for solving shear stresses from the SSLCC color images recorded from the selected observation directions.
Sample data are required for training the learning-based approach.To do that,we first select one illumination direction and several observation directions that are not blocked by any obstacles according to a given wind tunnel experiment scene.Then, the SSLCC images can be recorded from the selected observation directions for different shear stress vectors that can be measured using various existing wall shear stress measurement methods. Note that the sample data are generated specifically for the selected illumination direction and observation directions and are therefore tightly related to the experiment scene. In the special case of normal illumination, the SSLCC color-change responses with respect to the observation direction and the shear stress magnitude and direction can be measured and fitted to color-change response surfacein advance,and then the sample data for any selected observation directions in a given experimental scene can be obtained from the color-change response model. For the learning-based approach,to provide sample data is actually to provide the calibration data between the SSLCC color-change response and wall shear stress vectors.
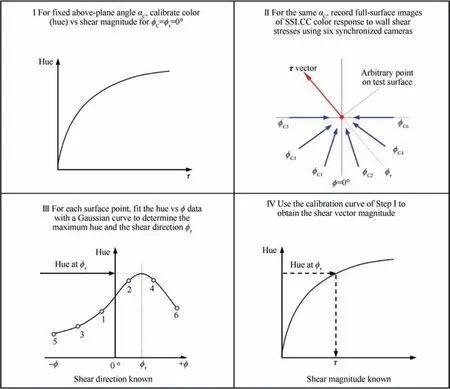
Fig. 1 Liquid crystal-based wall shear stress vector field measurement method.
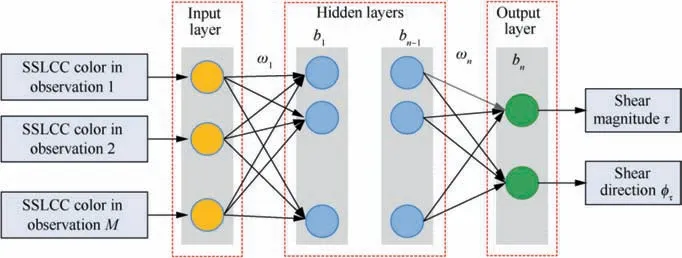
Fig. 2 Neural network for mapping SSLCC colors and shear stress vectors.
Once the sample data is obtained for the illumination direction and the observation directions, the multi-layer feedforward neural network algorithm is used to learning the mapping relationship between SSLCC color change-responses and shear stress vectors consisting of shear magnitudes and directions.A sketch of the neural network is shown in Fig.2,where for each data sample the inputs are the SSLCC color-change responses recorded from the M selected observation directions and the outputs are the shear magnitude and direction. The sample data are used to train the parameters of the neural network. There are many training methods available, such as the famous back-propagation algorithm. Once the training is finished,the neural network can be used to solve wall shear stress vectors by taking the SSLCC color images recorded from the M selected observation directions as the inputs. Note that the illumination direction and the observation directions used in a practical measurement should be exactly the same as those used when generating the sample data.The process to learn the mapping relationship between SSLCC color change-responses and shear stress vectors is essentially to establish the calibration relationship between them.
When compared with the traditional liquid crystal-based shear stress measurement technique, such as the multi-view Gauss curve fitting approach developed by Reda et al.,the proposed learning-based approach has several advantages.First of all, a Gauss curve fitting is essentially not needed for the learning-based approach, and therefore the above-plane view angle of each observation is not necessary to be fixed the same. In other words, the observation directions can be freely arranged according to the wind tunnel experiment scene,which makes the learning-based approach more flexible to use in practical wind tunnel measurement.Second,the shear stress vector has only two degrees of freedom (shear magnitude and direction), and therefore the shear stress vector field can be solved by observing the SSLCC color from at least two different observation directions(for a symmetric flow field,only one observation direction is needed).This capability makes the learning-based approach can be used in the case where only two or more observation directions are available. Of course,increasing the number of observation directions is generally beneficial to improve the measurement accuracy and reliability. Third, the learning-based approach can learn the SSLCC colors off-line, and the computational burden to solve wall shear stress vector field in the measurement is very small.Therefore, the learning-based approach has the potential to measure and visualize wall shear stress vector field in realtime. Finally, the liquid crystal coating-based measurement methods need to convert the RGB color space to the Hue,Saturation, and Intensity (HSI) color space and only the hue values are used for analysis, but there is information loss when using only the hue values to solve shear stress vectors.The neural network algorithm, on the other hand, has the ability to take directly the three RGB component of the SSLCC color as the inputs by simply expanding each of the input nodes in Fig. 2 into three input nodes. In such a case, because more SSLCC color information can be used for analysis than the methods that only use the hue values,the learning-based measurement method may be more accurate and more sensitive to shear stress vectors.
4. Experimental study and discussion
A preliminary verification study is carried out in this paper to test the effectiveness of the proposed learning-based approach to solve wall shear stress vectors from the SSLCC color images. The shear stress over the flat plat was induced by the subsonic jet flow exhausted from a small open jet wind tunnel.The nozzle pressure ratio (NPR, defined as jet total pressure divided by ambient static pressure) of the jet could be regulated to change the velocity of the jet flow.The size of the nozzle exit was 4 cm in width and 2 cm in height.A black anodized aluminum plug of 100 mm by 100 mm was mounted into the flat plat to enhance the quality of the color change-response in the SSLCC. The test study was carried out under a special condition where the above-plane view angles of all the observation cameras are the same and fixed at 28.5°,whereas the circumferential view angles were evenly distributed between-90°and 90° around the mainstream direction. A small halogen tungsten light bulb (20 W)was used to provide normal illumination. The schematic of the experimental arrangement is given in Fig. 3.
The test study is carried out under a special condition because a lot of experiment data and results have been obtained under such a condition in our previous studiesbased on the Gauss curve fitting approach, which can be used to provide learning samples and comparisons. Although the test is carried out under a special condition, it can be used to test the effectiveness of the proposed learning-based approach to solve wall shear stresses in a way essential different from the traditional liquid crystal-based methods.
The SSLCC color images that were recorded from the six observation directions (see Fig. 3(b) for the number definition of each observation direction)are given in Fig.4,which correspond a physical measurement area of 9 cm by 9 cm. The images were rotated into the normal view and the unwanted portions were cropped. The centerline of each image was consistent with the projected nozzle centerline on the test surface.The mainstream direction is from bottom to top in each image.As can be seen from Fig.4,the SSLCC showed different colors in different observation directions. Moreover, the three pairs of images taken at symmetry directions are essentially mirror images,but each appears asymmetric relative to the image centerline. This asymmetry is a direct result of the dual dependence of SSLCC color-change response on shear magnitudes and shear directions relative to the observer: both quantities vary across the shear stress field.
Three different y-constant locations (approximately at the top, lower middle and bottom) of the SSLCC color images observed from different directions were selected as sample areas. The multi-view SSLCC colors in the sample areas were taken as the inputs of the sample data.The shear stress vectors in the sample areas solved by the traditional multi-view Gauss curve fitting approachwere taken as the outputs of the sample data.In practical measurement,the outputs of the sample data can also be provided by using some other wall shear stress measurement methods. Note that the purpose of this paper is to investigate the feasibility of the neural network algorithm to learn the relationship between SSLCC color images and shear stress vectors. No matter which method the outputs of the sample data are obtained, it does not affect the conclusion.
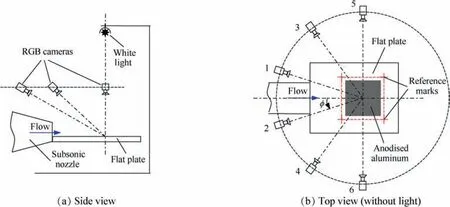
Fig. 3 Schematic of experimental arrangement.
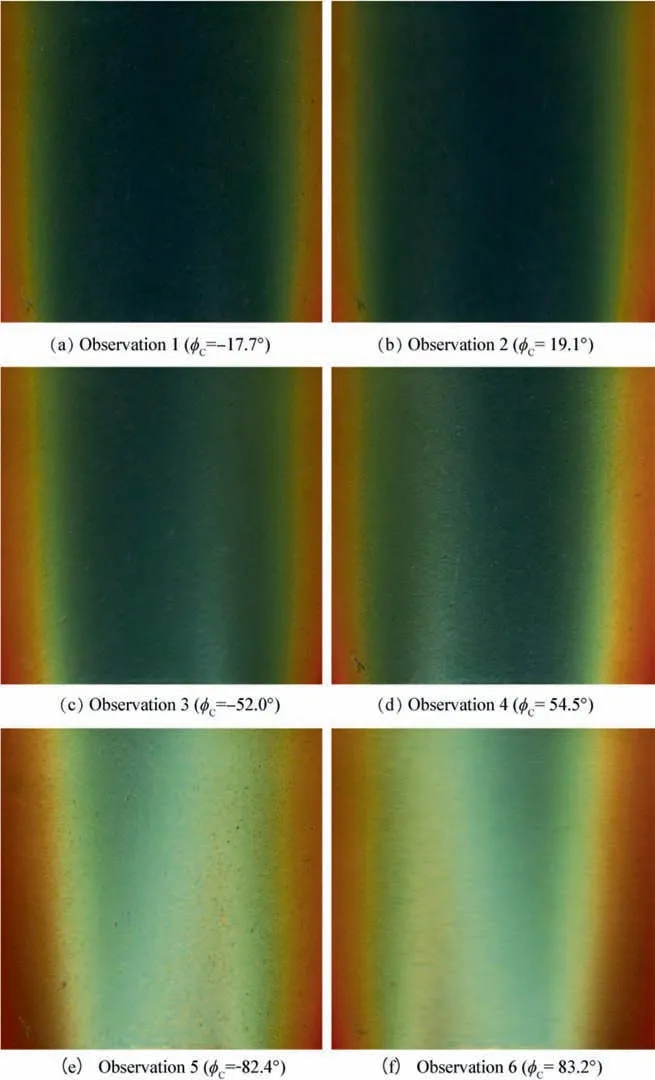
Fig. 4 Images of shear-sensitive liquid crystal coating (SSLCC) color recorded from multiple observation directions with the same above-plane view angle (NPR = 1.61, jet flow is from bottom to top).
Fig. 5 shows the wall shear stress vector field solved from the SSLCC color images by the neural network algorithm.For clarity, only every second vector is shown in each yconstant profile. The SSLCC colors in the six observations at y=5 mm, 30 mm,85 mm and the corresponding shear stress vectors were used as training samples (a total of 678 training samples were used). A Feed-forward Back-propagation Network (FBN) with two hidden layers and ten neurons in each layer was created using the MATLAB’s newff function. The MATLAB’s train function was used to train the FBN parameters with the learning goal of 4×10,the learning epochs of 200 and the learning rate of 0.01. The defaults were used for other settings. Fig. 6 shows a comparison of the shear magnitude and the direction solved by the FBN algorithm and the traditional Gauss curve fitting approach at y = 50 mm (not sample data).For further comparison,the results solved by the FBN algorithm with four and two observation directions are also given in Fig. 6.
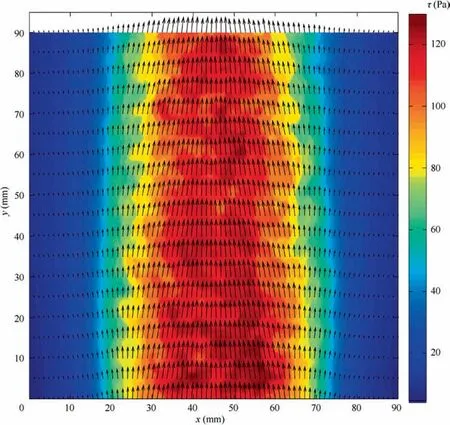
Fig. 5 Wall shear stress vector distribution solved for jet flow using FBN algorithm.
When using six observation directions, the mean square errors of the shear magnitudes and directions solved by the by the FBN algorithm relative to those solved by traditional multi-view Gauss curve fitting-based approach are 0.13 Pa and 0.02°respectively(the corresponding mean value and standard deviation of the error on the shear magnitude and direction are 0.11 ± 0.34 Pa and 0.01° ± 0.15°). When using four observation directions,the mean square errors are 0.91 Pa and 0.72° respectively (the mean value and standard deviation of the errors on shear magnitudes and directions are-0.22±0.92 Pa and 0.01° ± 0.85°). For the case of using four observation directions,there are several combinations of observations and the results given in Fig. 6 were obtained by using the observations 1,2,5 and 6(see Fig.3(b)for the number definition of each observation direction). When using two observation directions (the observations 3 and 4), the errors of the FBN algorithm slightly increase but the FBN results are still quite accurate in most regions. The exception is that the BPN results differ obviously from the results of Gauss curve fitting around the centerline (in the region between x = 40 mm and 50 mm). This phenomena was probably caused by the fact that the SSLCC color-change responses became saturated to the high shear stress in the region around the flow centerline, as shown in Fig. 4, and as a result there were more noises in the SSLCC colors in the sample data in that region, which increased the learning difficulty for the FBN algorithm with only two observations and hence reduced the learning accuracy.Such noises also existed during the measurement of the SSLCC color in the high shear stress region.The noises in the SSLCC colors increased the error of the FBN results, which can be reduced by increasing the number of observations. Further study is required to determine exact reasons.
It can be seen in Figs. 5 and 6 that the FBN algorithm can accurately establish the mapping relationship between the measured color-change responses in a SSLCC and shear stress vectors, and furthermore, the required number and distribution of observation directions is much more flexible than those of the traditional liquid crystal-based shear stress measurement methods. Although the above-plane view angle was the same in each observation in the present example,the use of different above-plane view angles will not bring any essential influence to the FBN algorithm. In contrast, five to seven observation directions with the same above-plane view angle are required in the traditional Gauss curve fitting-based approach.
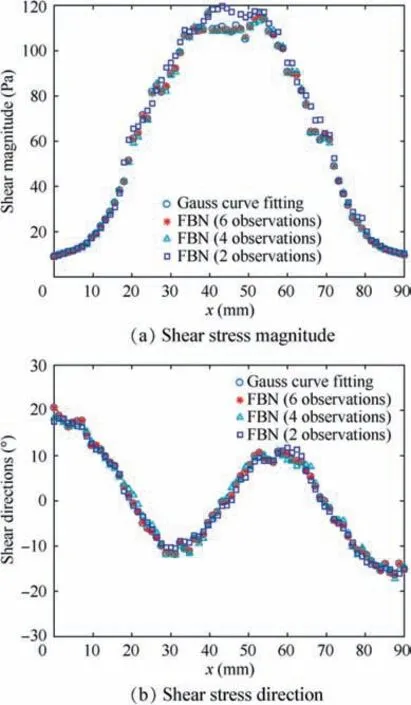
Fig. 6 Comparison of shear stress magnitudes and directions solved by FBN algorithm and Gauss curve fitting approach(y = 50 mm).
For the cases of using four or two of the six observations,there are various combinations of observations available. To further investigate the performance of the FBN algorithm,the mean values and the standard deviations of the errors at y = 50 mm for several typical combinations of four observations (see Fig. 3(b) for the number definition of each observation) are summarized in Table 1, and the case of using the observations 1, 2, 5 and 6 has been given in Fig. 6. In the first three cases, the four observations are symmetrical about the mainstream direction. In the last four cases, the four observations are not completely symmetrical about the mainstream direction and are given in two pairs for comparison.The mean errors on shear magnitudes in each case is in the range of-0.22-1.5 Pa,and the standard deviation of the errors in each case is in the range of 0.92-3.6 Pa. Although the errors on shear magnitude slightly increase with respect to the case of using six observations, the mean values and the standard deviations of the errors on shear magnitudes are still quite small relative to the measured shear magnitudes which are in the range of 9.24-121.59 Pa with a mean value of 64.26 Pa.For shear directions,the mean errors are in the range of-0.34°-0.19°and thestandard deviations of the errors are in the range of 0.85°-1.39°in most cases except for the case of observations 1,2,4 and 6.Moreover, the shear stress vectors solved by the FBN algorithm are more accurate when the four observations encompass the shear stress vectors (i.e. the mainstream direction in the present test)as much as possible,as can be seen by comparing the errors of the observations 1,2,3 and 6 with those of the observations 1,2,4 and 6,and the errors of the observations 1,4,5 and 6 with those of the observations 2,3,4 and 6.This feature is especially useful for selecting a better a group of observation directions in practical measurement.
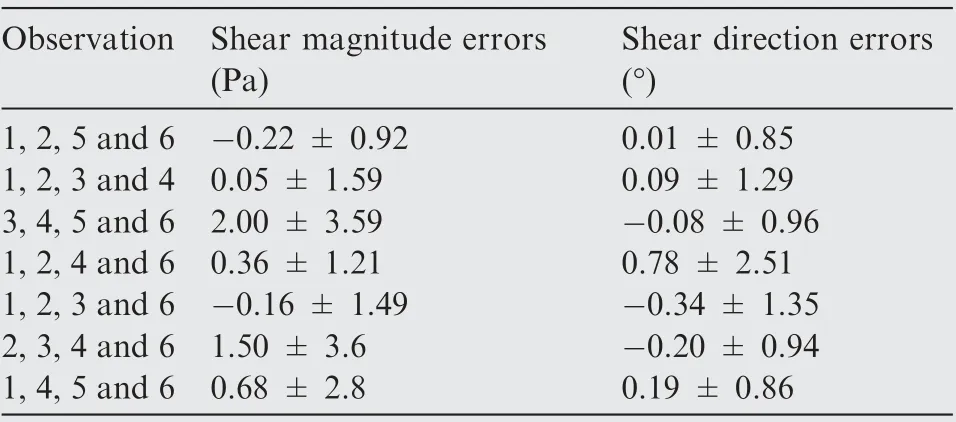
Table 1 FBN errors on shear magnitudes and directions(four observations).
The errors on shear stress vectors at y=50 mm for several typical combinations of two observations are summarized inTable 2, and the case of using the observations 3 and 4 has been given in Fig. 6. In the first three cases, the observations are symmetrical about the mainstream direction. As can be seen, the use of the observations 1 and 2 is beneficial to solve shear magnitudes accurately,the use of the observations 5 and 6 is beneficial to solve shear directions accurately, and the use of the observations 3 and 4 leads to a compromise result. The last six cases are given in three pairs for comparison.Similar to the cases of using four observations, the FBN algorithm becomes more accurate when the two observations encompass the shear stress vectors as much as possible, as can be seen by comparing the case of the observations 2 and 3 with 2 and 4,the case of the observations 2 and 5 with 2 and 6,and the case of the observations 4 and 5 with 4 and 6. Again, this feature provides important reference for selecting a better a group of observation directions in practical measurement. As can be seen in Fig. 6, when using two observations, the errors on shear magnitudes mainly occur in the high shear stress region around the flow centerline (about between x = 40 cm and x = 50 cm) where the SSLCC color become saturated to the shear magnitude in some degree and the FBN algorithm over predicted shear magnitudes. The possible reasons have been discussed earlier in this section. In other regions, the shear magnitudes solved by the FBN algorithm are generally accurate even if using only two observations. It should be noted that the structure of the network and the parameters of the FBN algorithm can be optimized to further increase the accuracy, which have not been considered in the present paper.
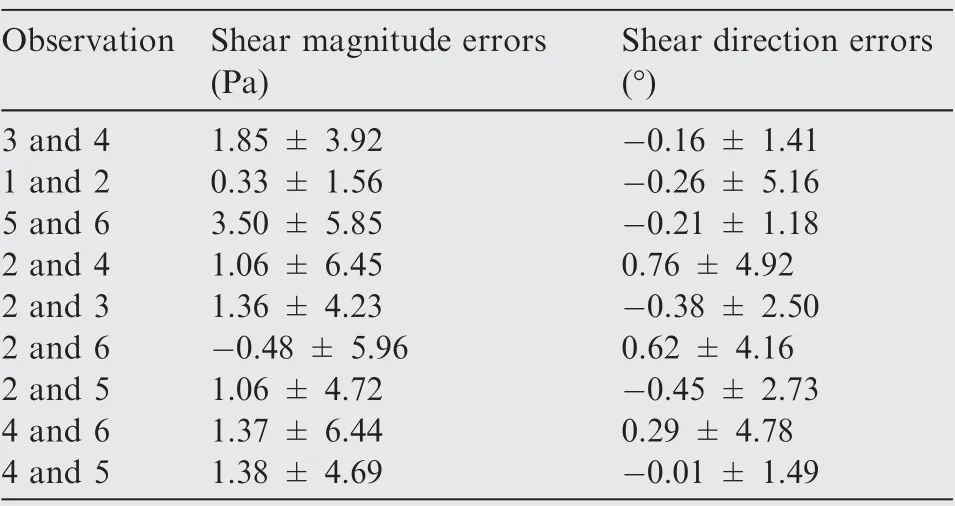
Table 2 FBN errors on shear magnitudes and directions(two observations).
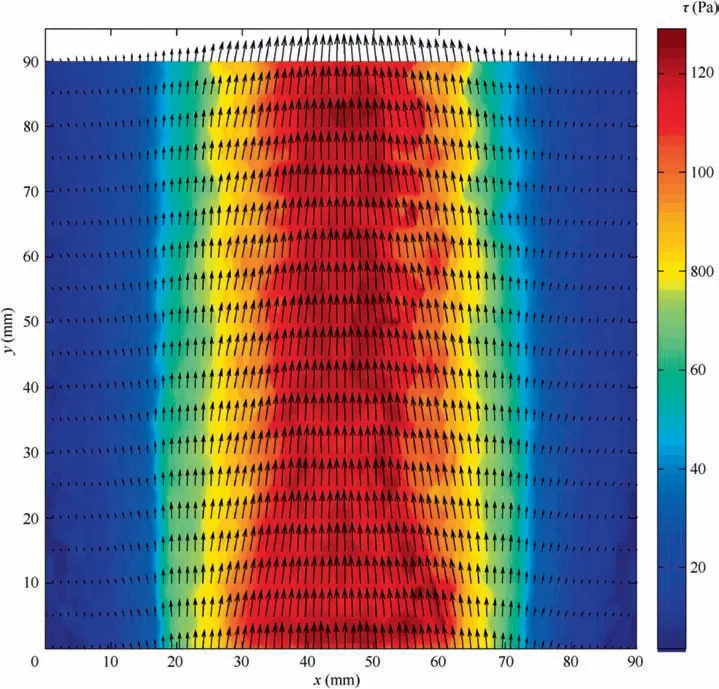
Fig. 7 Wall shear stress vector distribution solved using only one observation.
For symmetrical flow fields or time-averaged symmetrical flow fields,which is very common in wind tunnel measurement(such as the flow field in the present study),if the illumination is also provided symmetrically, then the learning-based approach can solve wall shear stress vector distribution from only one observation. Essentially, one observation is not enough to determine wall shear stress vectors which have two degrees of freedom (the magnitude and the direction).However, due to the symmetry of the flow, one observation is able to provide the SSLCC color of its own observation direction and that of its symmetrical observation direction.Then, the SSLCC colors of the two symmetrical observations can be used to determine the wall shear stress vectors by the FBN algorithm. An example of the wall shear stress vector field that was solved by the FBN algorithm using only one observation (the observation 4) is given in Fig. 7. The way to select the learning samples is the same as that in the case of using six observations. By comparing Figs. 7 with 5, it can be seen that the wall shear stress vector field solved by the FBN algorithm using only one observation are generally the same as that solved using six observations. The major difference is that when using only one observation, the errors on shear magnitudes and directions are slightly larger than those obtained using six observations.
A quantitative comparison of shear magnitudes and the directions at a y-constant profile (y = 50 mm) solved by the FBN algorithm using only one observation and the traditional Gauss curve fitting approach using six observations is shown in Fig. 8. It can be seen in Fig. 8 that the FBN algorithm can produce shear magnitudes and directions with reasonable accuracy even using only one observation. In detail, the FBN algorithm produces a smoother distribution of shear magnitudes along the y-constant profile and over predicts the shear magnitudes in the high shear stress region. Note that there are some noises in the sample data which is provided by the multi-view Gauss curve fitting approach. If the noises in the sample data are reduced, then the FBN algorithm is likely to produce more accurate shear magnitudes even using only one observation.The shear directions solved by the FBN algorithm using one image are consistent with those solved by the Gauss curve fitting approach using six images, and the errors are generally uniformly distributed between-3°and 2°along the y-constant profile for most vectors.The capability to solve shear stress from only one image makes the learning-based approach can be used in the case where only one camera could be deployed.
The FBN errors on the shear stress vectors at the yconstant profile (y = 50 mm) for three typical cases when using only one observation is summarized in Table 3.By comparing Table 3 with the first three cases in Table 2, it can be seen that the errors on shear magnitudes and directions solved from a single image and those from two images recorded from symmetrical directions are generally comparable.Moreover,it can be seen from Table 3 that the use of the observation 1 leads to more accurate shear magnitudes,the use of the observation 6 leads to more accurate shear directions, and the use of the observation 4 leads to a trade-off accuracy between shear magnitudes and directions. This phenomenon is similar to the above-mentioned cases using two observations, and can provide important reference for selecting the observation directions.
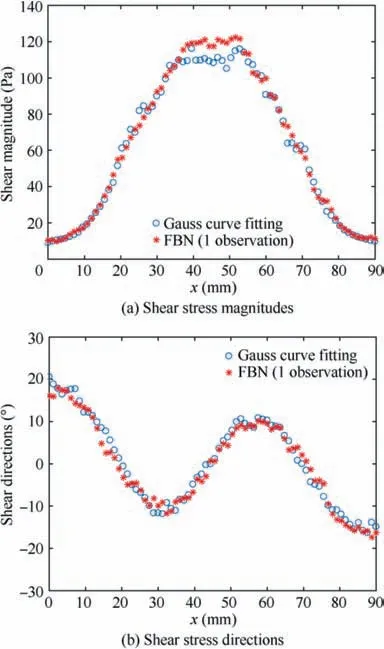
Fig. 8 Comparison of shear stress magnitudes and directions solved by FBN algorithm using only one observation and Gauss curve fitting approach using six observations (y = 50 mm).
To further investigate the performance of the learningbased approach, the uncertainty of the FBN results on the HSI color space is analyzed. An early work of Wilder and Redashows that the standard deviation of the measured hue was σ= 1.4° for a sheared liquid crystal coating. However, more than two decades has passed since the work of Wilder et al. published, and significant progresses have been achieved in the imaging technology during these years. On the other hand,the measured color can be calibrated to a high accuracy with the help of a color checker, e.g. the Macbeth Color Checker.For these reasons,a smaller standard deviation of the measured hue was used for analyses in the present study.The uncertainty on the hue was supposed to be a normal distribution with a mean value of zero and a standard deviation of σ= 1.0°. Such uncertainty was added to the measured hues of a liquid coating to simulate the uncertainty in hue.Then, the FBN error on shear magnitudes and directions at y = 50 mm is summarized in Table 4 for three typical casesin which different observations were used. As can be seen,the FBN errors on shear magnitudes and directions slightly increase when compared with the cases in which the hue uncertainties are not considered.In detail,the increase of the uncertainty on shear magnitudes ranges from ± 0.41 Pa to ± 0.70 Pa and the increase of uncertainty on shear directions ranges from ± 0.15° to ± 0.60° for the three cases. Further study shows that the increase of the FBN error mainly occurred in the low shear stress region, because the hue standard deviation of σ= 1.0° had more influence in such regions where the coating hue values were smaller.

Table 3 FBN errors on shear magnitudes and directions(one observation).
In terms of computational efficiency, the learning-based approach also shows advantages. Taking the case of using six observations as an example, the training time of the FBN algorithm is 1.99 s and then the FBN algorithm takes only 0.054 s to solve the shear stress vector field shown in Fig. 5(the computations were performed on a laptop running Windows 10 and MATLAB R2017a). Note that the learning process,i.e.the training of the neural network parameters,can be implemented offline in advance.Therefore,the neural network algorithm has the potential to solve/measure wall shear stress vector field in nearly real-time. In contrast, on the same computational platform, the traditional multi-view Gauss curve fitting-based approach takes as much as 70.24 s to solve a shear stress vector field similar to that given in Fig. 5.
The experimental study in this paper shows that the learning-based approach can solve wall shear stress vector distribution from SSLCC color images accurately and efficiently in a new manner that does not require fitting the coating colors using Gauss curves.The approach eliminates the strict requirements on illumination direction and observation directions and is therefore more flexible to use in practical wind tunnel measurement when compared with traditional liquid crystalbased methods. It should be noted that the structure (e.g. the number of network layers and the number of neurons in each layer) and the parameters of the neurons network have not been optimized in the present study. That is, the performance of the learning-based approach can be further improved by optimizing the structure and the parameters of the network.

Table 4 FBN error on shear magnitudes and directions with hue uncertainty considered (σH = 1.0°).
5. Conclusions
A learning-based approach was proposed for solving wall shear stress vector distribution from SSLCC color images.The approach is able to learn the mapping relationship between the SSLCC colors observed from different observation directions and the corresponding wall shear stress vectors,and the mapping relationship is then used to solve wall shear stress vectors from the SSLCC color images. The feasibility of the learning-based approach to solve wall shear stress vector distribution from SSLCC color images is demonstrated in the present study.
(1) Experimental results show that the approach can solve wall shear stresses from two or more SSLCC color images. When four or more observations are used, the accuracy is comparable to the traditional Gauss curve fitting approach. The accuracy is slightly reduced when two or fewer observations are used.
(2) For symmetrical flow, wall shear stresses can be solved from only one image using the proposed approach.
(3) Most of all,there are no strict requirements on illumination direction and observation directions in the learningbased approach and the approach is therefore more flexible to use in wind tunnel measurement when compared with traditional liquid crystal-based approaches.
(4) The computational efficiency is also significantly improved when compared with the traditional Gauss curve fitting approach and hence the proposed approach can solve wall shear stress vectors in nearly real time.
The learning-based approach can be easily extended to more complex experimental conditions where the above plane view angle of each observation direction is not the same or an oblique illumination direction is used, and to more complex flow fields, just by providing the learning samples in the same conditions. The structure and the parameters of the network can also be optimized to further improve the performance of the learning-based approach.The use of the RGB components as the inputs of the network may also be beneficial to increase the accuracy and the sensitivity of the learning-based SSLCC measurement technique.
The authors declare that they have no known competing financial interests or personal relationships that could have appeared to influence the work reported in this paper.
This study was co-supported by the National Natural Science Foundation of China(No.11602107)and the Natural Science Foundation of Jiangsu Province of China (No. BK20150733).Helpful discussions with Dr.Peter Scholz from the Institute of Fluid Mechanics at TU Braunschweig on the SSLCC technique are also acknowledged here.
 Chinese Journal of Aeronautics2022年4期
- Chinese Journal of Aeronautics的其它文章
- Reduced-dimensional MPC controller for direct thrust control
- A multiscale transform denoising method of the bionic polarized light compass for improving the unmanned aerial vehicle navigation accuracy
- Periodic acoustic source tracking using propagation delayed measurements
- Optimal predictive sliding-mode guidance law for intercepting near-space hypersonic maneuvering target
- Sea fog detection based on unsupervised domain adaptation
- Unsteady characteristic research on aerodynamic interaction of slotted wingtip in flapping kinematics
