Design and optimization of electrolyte flow fields in electrochemical machining of cross-channel array with tool vibration
Yan LIU, Jia LIU, Di ZHU, Hao WANG
College of Mechanical and Electrical Engineering, Nanjing University of Aeronautics and Astronautics, Nanjing 210016, China
KEYWORDS Cross-channel array;Dynamic simulation;Electrochemical machining;Flow field;Interconnect plate
Abstract A metallic interconnect plate with a flow channel array is one of the most important elements in a solid oxide fuel cell (SOFC). Electrochemical machining (ECM) is considered to be an adoptable technology for fabricating flow channels in an interconnect plate on account of its efficiency and low cost. With respect to the traditional electrolyte flow mode in ECM cross-channel array,the electrolyte usually flows from one side to the opposite side of the rectangular processing area.However,obvious flow marks are typically formed at the bottom of channels perpendicular to the flow.According to multiphysical simulation analysis,the low electrolyte velocity in the channels perpendicular to the flow leads to uneven distribution of electrolyte products.To improve the uniformity of the flow field, two new electrolyte flow modes, ‘‘two-in and two-out” and ‘‘three-in and one-out”,are proposed.By adding one or two additional electrolyte inlets to the sides of the traditional flow field, the electrolyte flow velocity in the channels perpendicular to the traditional flow will be increased. Corresponding simulations and experiments were performed and the results showed that the ‘‘three-in and one-out” flow mode can produce a flatter bottom surface for the cross-channel array. Parameter optimization experiments for the preferred flow mode were undertaken and the optimal flow field parameters were determined.
1. Introduction
As one of the most promising energy technologies, fuel cells offer advantages of high efficiency and low emission,and have been applied in aerospace, aviation, medical, transportation and other fields.The solid oxide fuel cell (SOFC) is an increasingly attractive energy source in terms of the above features relative to traditional power sources.In addition,compared with other fuel cells, the SOFC requires no fuel reformer, possesses higher volume specific power density and its efficiency can be further increased by co-generation systems.However, the main obstacles to the application of SOFCs are the excessive cost, difficult thermal management,and the durability of continuous operation.The metallic interconnect plates which feature a separated flow channel array, as one of the core components, need to supply reactant gases to the anode and cathode as well as remove electrolysis products from the SOFC stack.The flow channel array is also used to provide efficient collection and transmission of current from the electrochemical reactions in the SOFC.Therefore,the fabrication quality of the flow channel array on the metallic interconnect plates will directly affect the performance of the SOFC stack.
The metallic interconnect plate is typically made of a 2-3 mm thick stainless steel plate with straight arrays on both sides. In addition to traditional flow arrangement, new interconnect contains cross-channel arrays as gas channels have also been researched, and such innovative interconnect results in a more uniform gas distribution than the conventional straight channels.There are many ways to machine the flow channel array,such as micro milling,chemical etching,electrical discharge machining(EDM)and so on.In recent years,ECM has been used in the fabrication of the flow channel array on metallic interconnect plates, because it provides outstanding features such as no cathode tool wear, no burr, high efficiency and low manufacturing cost.There are mainly three processing approaches to obtain a flow channel array by ECM.The first processing method is electrolyte jet machining. For instance, Hackert-Oscha¨tzchen et al. used a continuous electrolytic free jet to machine cavities with width of 200 μm and depth of about 60 μm on stainless steel plates.The second method is ECM etching. Wang et al. fabricated a group of micro-grooves with semi-circles of radius 50 μm by through-mask electrochemical micromachining.The third processing method is copy ECM. Jiang researched the process of fabricating bipolar plates with depth of 300 ± 30 μm and length of 60 mm on stainless-steel sheet.Therefore, ECM has been extensively studied in processing channel array. In addition, manufacturing methods for fabrication of crosschannel array have also been widely studied. Schreck et al.used a Nd YAG-laser to generate a typical structure with crossed channels on ceramic and steel surfaces.Shin et al.fabricated multilayered micro cross channels with total depth of 25 μm through multi-step electrochemical etching using laser masking.This paper will focus on the copy ECM method for fabrication of cross-channel array.
In ECM, high-velocity and high-pressure electrolyte flows through the machining gap between the cathode tool and the workpiece. The high-velocity flowing electrolyte will take away gas bubbles, heat and anode dissolved products from the machining gap to maintain the electrochemical reaction.If the designed electrolyte flow cannot remove the ECM products in time, processing defects such as flow marks will occur on the surface of the workpiece. In severe cases, the products may even cause a short circuit between the cathode tool and the workpiece. Therefore, the design of electrolyte flow field is very important for electrochemical machining.Kang et al. verified that the simulated results of electrolyte pressure and velocity intuitively express the flow field characteristics.Zhao et al. designed the flow field model for the machining of metal grille to improve the process stability.
In the conventional flow field mode of the ECM flow channel array,only one electrolyte inlet is located at one side of the metallic interconnect plate and the outlet is located at the opposite side. The electrolyte flows in one direction through the interconnect plate from the inlet to the outlet. Designing the electrolyte flow direction to be consistent with the extension direction of the straight channel array can be suitable for straight channel processing. However, in the case of ECM cross channels, given that there are channels perpendicular to the direction of electrolyte flow, the electrolyte flow must sequentially traverse the machining gap of channels perpendicular to the flow to the outlet. The flow resistance of the electrolyte flow in these channels will increase significantly,and even affect the flow state of the electrolyte in the channels parallel to the flow. To solve the flow field problem in ECM cross-channel array, two new electrolyte flow modes termed‘‘two-in and two-out” and ‘‘three-in and one-out” are proposed. With periodic vibration of cathode tool, dynamic flow field simulations on conventional, ‘‘two-in and two-out” and‘‘three-in and one-out” flow modes were conducted to determine the optimal flow field mode. The corresponding experiments were also performed to verify the effectiveness of the optimal flow field method.
2. Principle of ECM cross-channel array
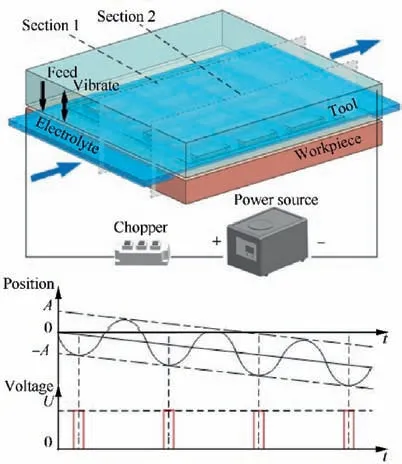
Fig. 1 Copy ECM cross-channel array.
The principle of ECM cross-channel array is depicted in Fig.1.The cathode tool with a convex cross-structure array is connected to the negative pole of the power supply and the workpiece is connected to the positive pole.From the perspective of the electrolyte flow routes, there are two different electrolyte flow routes in ECM cross-channel array.To improve the ability of the electrolyte to remove ECM products from the gap,the constant feeding of cathode tool is usually combined with periodic reciprocating vibration of the tool.The electrolyte disturbance caused by the tool vibration is expected to enhance electrolyte renewal and reduce the possibility of short circuiting induced by ECM products, which guarantees the stability of the machining process while improving the machining accuracy.In the process of cross-channel array ECM, a chopper is used to synchronize coupling of the pulse current with the reciprocating vibration of the cathode tool. In each vibration cycle, when the tool is near the closest point of the workpiece,the chopper is on, and when the tool is far away from the workpiece,the chopper is off.During the processing,the workpiece material will undergo dissolution and the electrolysis products will be swept away by the electrolyte.As the cathode tool continues feeding,the convex cross-structure array on the tool will be copied to the workpiece.
Traditionally,in copy ECM cross-channel array,electrolyte flows along one of the extension directions of the mutually perpendicular channels. In channels along the electrolyte flow direction, the shape of the machining gap is straight, which is beneficial to maintaining a relatively high electrolyte flow velocity due to the low flow resistance. A schematic of traditional electrolyte flow in the machining gap is depicted in Fig.2.For the channels perpendicular to the direction of electrolyte flow, the electrolyte flow must pass through the machining gap across the undulating channels and ribs to flow out from the inlet to the outlet. As the channels and ribs are distributed in sequence on the flow path, the electrolyte will directly hit the sidewall of the rib, which greatly increases the flow resistance and significantly reduces the flow velocity.The clear difference in the electrolyte flow resistance between channels parallel to and perpendicular to the flow will lead to uneven electrolyte flow and irregular streamline distribution. Even if the flow field disturbance caused by the tool vibration can improve the electrolyte velocity and flow uniformity in the machining gap to a certain extent, this flow mode may cause significant flow marks or even induce short circuits.
Although the fluid flow in pulsed electrochemical machining (PECM) with the vibration of the tool enhances the removal of heat and hydrogen, the influence of Joule heating and cathodic hydrogen formation on electrolyte conductivity cannot be ignored. Hence, both effects, Joule heating and hydrogen formation, influence the current density distribution which in turn determines the material removal.Besides, for ECM processes with long flow length heat and gas evolution affect the electrolyte properties along the flow path significantly and thus lead to local deviations in dissolving rates.To explore the difference of the material removal between channels along and perpendicular to the electrolyte flow, multiphysical simulations of two cross sections were carried out.Fig. 3 represents two 2D geometric models derived from the 3D model with the numbering of boundaries. Domain blue represents the electrolyte with a mass fraction of 20% sodium nitrate(NaNO3)and is defined as a fluid.Tool and workpiece are defined as solid, and the material is SS304 stainless-steel.Domain tool and all its boundaries are set as superimposed motion with both constant feeding and vibration, which is described by Eq. (1).
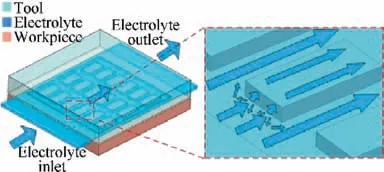
Fig.2 Traditional flow field of electrolyte in ECM cross-channel array.

where Gis the intermediate gap of the tool and workpiece with 0.5 mm, A is the amplitude of the tool vibration with 0.3 mm, f is the frequency of the tool vibration with 10 Hz,and vis the constant feed velocity with 0.1 mm/min.
The pulsed electric potential is defined on boundary 3 and changes with time. The maximum value of the electric potential is 15 V when the cathode tool is closest to the workpiece.The duty cycle which is the proportion of the power-on time occupying a vibration period is 1/12. Boundaries 4, 5, 6 and 7 on the tool are set as the electric ground.The boundary condition electric insulation is used on other boundaries of the tool in contact with electrolyte, as marked in Fig. 3.
The generation of hydrogen on the surface of the tool through the electrochemical reaction is defined as Eq. (2) on boundaries 4, 5, 6 and 7.

where Mis the molar mass of hydrogen,F is the Faraday constant and J J is the electric current density. The thermodynamic calculations are carried out on the generation of joule heat and heat transfer in each domain.
Taking into account the influence of hydrogen bubbles and heat, the conductivity of the electrolyte ( c) is defined by Eq.(3).

where Tis constant 273.15 K, the coefficients a and b are obtained by calibration, φrepresents the local hydrogen content rate,and n is constant 3/2.In electrochemical machining,the accumulation of bubbles and heat at the outlet is serious, so the sampling line is chosen close to the outlet. During one cycle of the cathode vibration, the changes of average velocity,bubble rate,temperature and conductivity of the electrolyte on the sampling line by time are shown in Fig. 4.
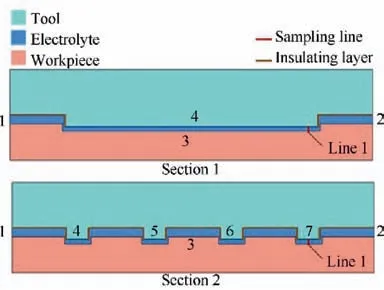
Fig. 3 2D geometric models of multiphysical simulation.
As shown in Fig.4(a),the average velocity of the electrolyte on Line 2 is much lower than that on Line 1,because the flow channel of section 2 twists and turns between the inlet and outlet.Therefore,the accumulation and release of bubble rate and temperature on Line 2 is significantly slower than those on Line 1, which can be observed from Fig. 4(b) and Fig. 4(c).As a result, the average electrolytic conductivities on the two lines show a difference, as shown in Fig. 4(d). It means that the product distribution in the processing area is uneven and the material removal is inconsistent, which has a great influence on the flatness of the workpiece surface. To reduce this influence caused by the product, it is a feasible method to improve the electrolyte velocity,especially in the flow channels in section 2, which is the electrolyte velocity in the channels perpendicular to the traditional flow.
To reduce the direct impact of electrolyte on the sidewall of the rib and improve the electrolyte velocity in the channels perpendicular to the traditional flow, two new electrolyte flow modes termed ‘‘two-in and two-out” flow mode and ‘‘threein and one-out” flow mode are proposed. A schematic of the‘‘two-in and two-out” flow mode is shown in Fig. 5(a). Two electrolyte inlets are configured with perpendicular flow directions on the adjacent two sides of the rectangular processing area and two outlets are arranged on the remaining two sides of the processing area.By adding one additional inlet and outlet(relative to the traditional configuration),the velocity in the channels perpendicular to the traditional flow may increase and the intention of improving the uniformity of the flow field may be achieved.
The schematic of the ‘‘three-in and one-out” flow mode is shown in Fig. 5(b). Apart from the electrolyte inlet and outlet arranged separately at two ends of the channels parallel to the traditional flow, two more inlets are arranged at both ends of the channels perpendicular to the traditional flow.In the ECM process,the two additional inlets of electrolyte are expected to increase the electrolyte velocity in the channels perpendicular to the traditional flow directly. In addition, by squeezing the flow of electrolyte in the traditional flow direction, the difference in flow velocities between the mutually perpendicular channels may further decrease.
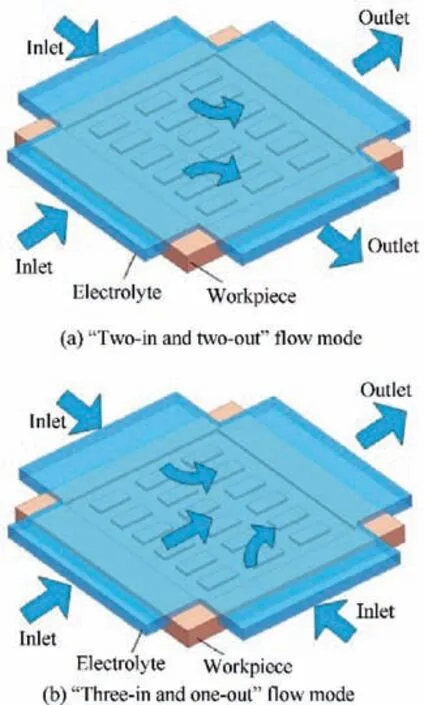
Fig. 5 Schematics for ‘‘two-in and two-out” and ‘‘three-in and one-out” flow modes.
3. Flow field simulation and analysis
3.1. The model of flow field simulation
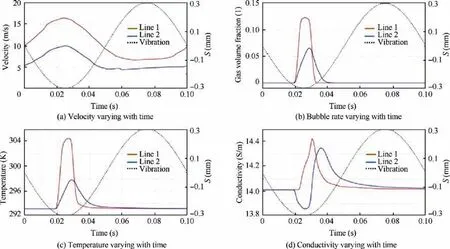
Fig. 4 Time-varying curve of parameters in two sections.
To obtain the optimal flow field mode for ECM cross channels, the flow field simulations on the traditional, the‘‘two-in and two-out” and ‘‘three-in and one-out” flow modes for the final stage of processing were carried out.Ideal models of tool and workpiece were used to build the geometric model of the machining gap, as shown in Fig. 6. In this model, face T is the underside of the cathode tool and face W is the top surface of the anode workpiece.In ECM processing, the cathode tool vibrates periodically as it feeds toward the workpiece. The pulse on-time occupies only 1/12 of the vibration period when the cathode tool is closest to the workpiece, and it is in the pulse-off mode at other times. Considering that the pulse on-time in one vibration process is very short (usually less than 0.01 s), the amount of anodic dissolution of the workpiece material is limited (less than 1 μm), thus the change in the outline of workpiece geometry can be ignored. In addition, the feeding depth of the tool in one vibration (less than 1 μm) is negligible compared to the vibration amplitude (0.3 mm). Therefore, the face T of the model is set as a dynamic moving boundary with only vibration, and the face W of the model is set as a fixed boundary. The position zof the cathode tool face T satisfies Eq. (4)

The faces Fto F, which are distributed around the flow channel model, are all fluid boundaries. By reasonably setting the four faces Fto Fas the electrolyte inlet or outlet, the conventional, the ‘‘two-in and two-out” and the‘‘three-in and one-out” flow modes can be simulated. Table 1 lists the boundary conditions for the three electrolyte flow modes.
During the simulation of the electrolyte flow field,the entire tool vibration time is divided into numerous fixed tiny time intervals Δt.At each Δt,as the change of workpiece geometric outline and the feeding depth of the tool in one vibration can be ignored,the coordinate position of the cathode tool surface may be calculated first by Eq.(4), then the geometric model of the electrolyte flow channel at this instant will be determined.Then the transient distribution of the electrolyte flow field may be calculated. The calculated result may then be used to compute the initial condition of the electrolyte flow field for the next Δt. After calculating a certain number of Δt, the electrolyte flow field distribution during ECM with a reciprocating tool vibration will be obtained. The processing depth in the workpiece is subscribed as D. The pressure of the electrolyte at the inlet and outlet are subscribed as Pand P. The simulation parameters of the electrolyte flow field are listed in Table 2.
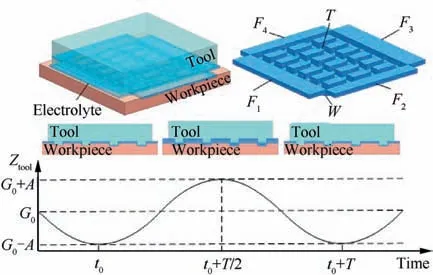
Fig. 6 Geometric model of electrolyte flow channel.
3.2. Simulation results for the traditional flow mode
The simulation results for the traditional flow mode at the instant of the minimum machining gap are shown in Fig. 7,and Fig. 7(a) depicts the electrolyte pressure distribution in the machining gap.In the machining gap,the highest pressure is about 0.6 MPa near the inlet and the lowest pressure is about 0.3 MPa near the outlet. From the streamline distribution in Fig. 7(b), it can be ascertained that the velocity of the electrolyte in the channels parallel to the flow is relatively high,being around 14 m/s. However, the electrolyte flow velocity in the channels perpendicular to the flow is less than 7 m/s except for the cross regions of the mutually perpendicular channels.The alternating distribution of high and low velocity regions in machining gap will lead to an uneven distribution of electrolysis products, which will result in uneven anodic dissolution rate. This will significantly affect the processing quality of the bottom surface in the cross channels.
To more accurately characterize the flow field,four regions,R1,R2,R3 and R4,which are distributed in mutually perpendicular channels near the inlet and outlet respectively, were chosen,as shown in Fig.7(a).The average electrolyte pressure and velocity for the four regions during the reciprocating vibration of the cathode tool are illustrated in Fig. 8. As shown,the pressure values in adjacent mutually perpendicular channels are very close, but there are very large differences in the velocities. When the cathode vibrates to its lowest point,the electrolyte velocity in channels parallel to the flow decreases to its minimum. On the contrary, the electrolyte velocity in channels perpendicular to the flow rises to the highest value. With the vibration of the cathode tool, the average velocity of electrolyte in R1 varies from 10.1 to 13.4 m/s, but the range of velocities in the adjacent R2 is only 2.7 to 5.7 m/s. The velocity difference of electrolyte between R1 and R2 is always larger than 4.4 m/s. Similarly, the velocity difference of electrolyte between R3 and R4 is always larger than 4.7 m/s. The significant difference of electrolyte flow velocity between adjacent regions will cause surface quality problems such as flow marks and even induce short circuits.
3.3. Simulation results for the ‘‘two-in and two-out” flow mode
The simulation results for the‘‘two-in and two-out”flow mode at the moment of the minimum machining gap are shown in Fig. 9. It can be found from the pressure distribution and the streamline of the electrolyte that the trend of the electrolyte flow is mainly along the diagonal direction of the rectangular processing area. The electrolyte pressure decreases along the diagonal direction from about 0.9 to 0.2 MPa.Compared with the traditional flow mode, the velocities of the electrolyte flow in the channels perpendicular to the traditional flow have been remarkably improved. However, due to the flow distance of electrolyte along the diagonal is obviously longer than that in the two corners where inlet and outlet are adjacent to each other, the electrolyte velocity in the area at the corners is significantly higher than that away from the corners. In the processing area,the highest flow velocity reaches 20 m/s,while the lowest flow velocity is less than 4 m/s.In addition,the shape of the ribs is rectangular rather than streamlined. When the electrolyte flow bypassing the rectangular ribs, the electrolyte streamline appears disorderly.The uneven velocity distributionand the disordered streamline will hinder the improvement in the surface quality of the channels.

Table 1 Boundary conditions of three electrolyte flow modes.
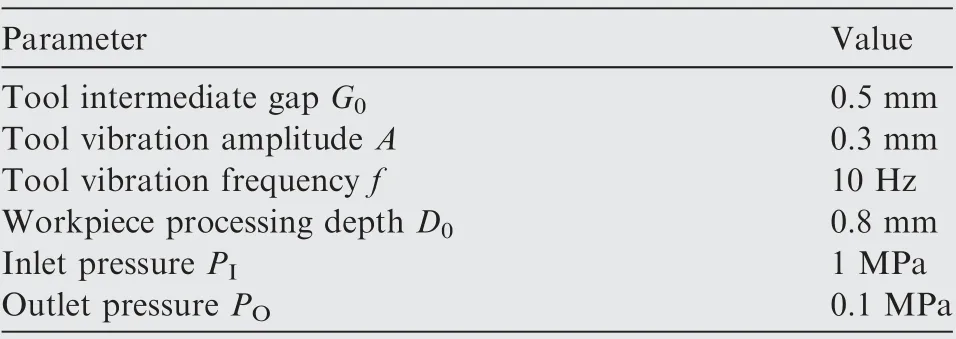
Table 2 Simulation parameters of electrolyte flow field.
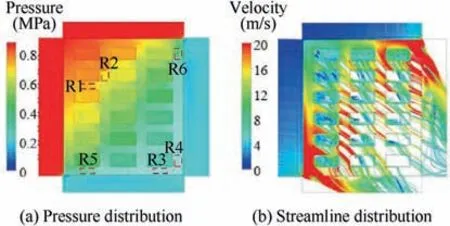
Fig.9 Simulation results for‘‘two-in and two-out”flow mode at minimum machining gap.
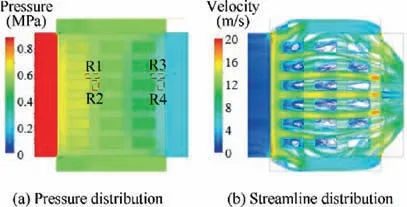
Fig. 7 Simulation results for traditional flow mode at minimum machining gap.
As shown in Fig. 9(a), in addition to the four regions (R1,R2, R3, R4) distributed in mutually perpendicular channels near the inlet and outlet, two other regions (R5, R6) near the two short-distance corners are included in the selection.Fig. 10 depicts the average electrolyte pressure and velocity for six regions which changed over time during the reciprocating vibration of the cathode tool.As can be seen from Fig. 10(b), (d) and (f), the average flow velocities of electrolyte in the long flow distance regions R1,R3 and R2,R4 are significantly lower than those in the short flow distance regions R5 and R6.Moreover, the velocities in the R1, R3 and R5 regions along the length of the ribs are lower than those in the R2, R4 and R6 regions in the direction of the width of the ribs. Although the ‘‘two-in and two-out” flow mode improves the electrolyte flow velocity in the channels perpendicular to the traditional flow,the flow field still displays the problems of uneven velocity distribution and disordered streamline.
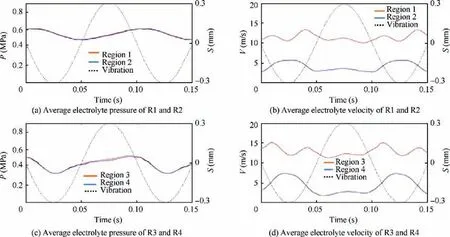
Fig. 8 Average electrolyte pressure and velocity of four regions for traditional flow field.
3.4.Simulation results for the‘‘three-in and one-out”flow mode
The simulation results for the ‘‘three-in and one-out” flow mode at the moment corresponding to the minimum machining gap are shown in Fig. 11.It was found that the electrolyte pressure still decreases along the flow direction from about 0.9 to 0.2 MPa in the machining gap. However, benefiting from the existence of two more inlets, the entire flow field presents as a state of contraction, which makes the electrolyte pressure in most parts of the processing area greater than 0.5 MPa.Compared with the simulation results for the traditional and the ‘‘two-in and two-out” flow modes, the velocity of electrolyte flow in the high-pressure area is more uniform and the velocity in the low-pressure area is faster. The electrolyte flow velocity ranges from 4-8 m/s in the channel closest to middle inlet. In the channel parallel to the traditional flow it rises to above 16 m/s near the outlet,and in the channel perpendicular to the traditional flow it rises to about 12 m/s before reaching the outlet.
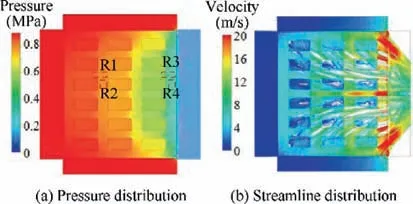
Fig.11 Simulation results for‘‘three-in and one-out”flow mode at minimum machining gap.
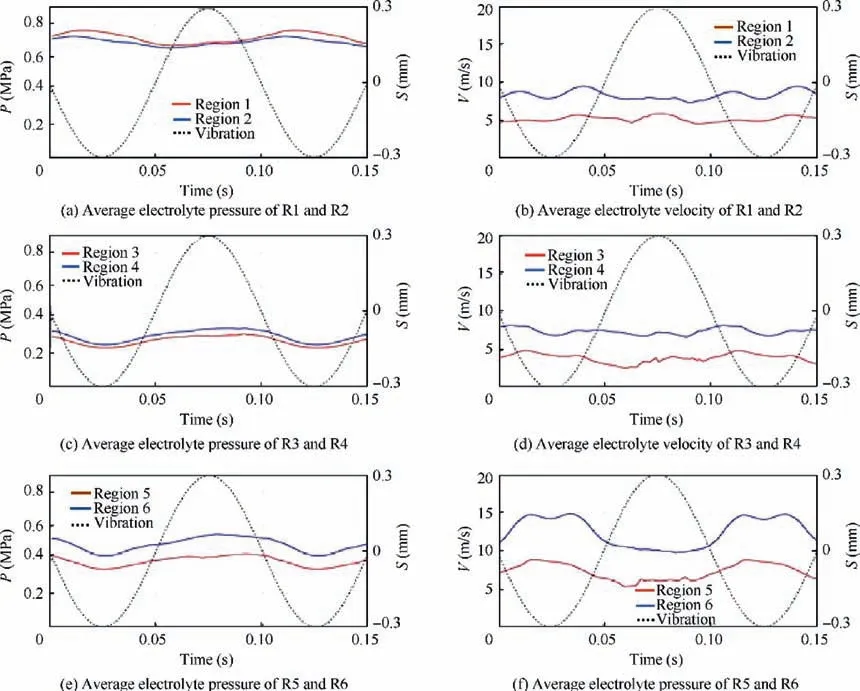
Fig. 10 Average electrolyte pressure and velocity of six regions in ‘‘two-in and two-out” flow field.
Similar to the traditional flow, four regions (R1, R2, R3,R4) were chosen to analyze the ‘‘three-in and one-out” flow mode. Fig. 12 depicts the average electrolyte pressure and velocity for four regions that changed in the simulated cycle.As for the regions near the inlet, the average flow pressure is above 0.8 MPa and the average velocity is about 5 m/s. The velocity difference of electrolyte between regions R1 and R2 is about 2.0 m/s. Although the velocities of electrolyte in R1 and R2 for the ‘‘three-in and one-out” flow mode are slightly lower than that in the traditional flow mode, the uniformity of velocity in the adjacent regions is improved. In addition,the improvement of electrolyte pressure will also help reduce the influence of gas bubbles on processing stability. As for the regions near the outlet, the average flow pressure is about 0.4 MPa and the average velocity is above 10 m/s. Although the velocity difference of electrolyte between regions R3 and R4 is also about 5 m/s, with the increase in the average flow pressure and velocity in both mutually perpendicular channels,the ECM processing stability and surface quality are supposed to be improved significantly.was then chosen and the states of the valves were set as shown in Table 3. After that, the electrolyte supply system, the motion system,and the measurement and control system were started in sequence, and the processing parameters were set according to Table 4. Calculated from the processing depth and feed rate, the processing time of one workpiece is 11.4 min. The experimental results for the three different flow modes are shown in Fig. 15.
4. Experiment setup and procedures
To examine the effects of the simulations of the various flow field modes above, an experimental test system consisting of a clamping fixture and other modules were designed and manufactured, then comparison experiments were executed. Some of the key experimental components in ECM cross-channel array are shown in Fig. 13. The mechanical movement part of this system included a vibrator and linear feed, which were connected to the cathode tool. The movement of the cathode tool was captured by the eddy current sensor and fed back to the controller to generate a matching electrical signal to control the chopper,so as to provide a pulse voltage to the tool and workpiece. The electrolyte was pumped from the electrolyte tank into the processing area,then returned to the electrolyte tank after filtering. Several valves were installed on the liquid supply pipeline to realize the switching between the three different electrolyte supply modes. The different electrolyte supply methods and the corresponding status of the valves are specified in Table 3. The cathode tool is designed as an array consisting of 7 ribs parallel to the length of the tool and 4 ribs parallel to the width of the tool. The widths of the 7 ribs are all 2 mm and the widths of the 4 ribs are 2.5 mm. All the ribs are 2 mm in height and all the side and bottom surfaces of the array ribs are coated with an insulating film.The cathode and workpieces in this research are all made of SS304 stainless-steel.
To commence the experiments, the components, circuitry and pipelines were installed according to the overview schematic, as shown in Fig. 14. An electrolyte delivery method
5. Results and discussion
To test and compare the experimental results for the three different flow modes, a probe type roughness meter was employed to measure the waviness of the processed surface of the workpiece. The surface measurement S, which is the sum of the maximum peak height and the maximum valley depth in the measurement area,was used to describe the waviness of a plane.As the channels parallel to the traditional flow are measured 2.3 mm and the channels perpendicular to the traditional flow are measured 2.8 mm, the surface measurement area are set to be 1 mm wide in channels parallel to the flow and 1.5 mm wide in channels perpendicular to the flow.
5.1. Results of traditional flow mode
The machined area for the traditional electrolyte flow mode is depicted in Fig.16.It is apparent that the surface of the channels parallel to the flow direction is flat.However,for the channels perpendicular to the flow between two adjacent channels parallel to the flow direction, there are uneven marks. This indicates that the electrolyte flow velocities in the mutually perpendicular channels are very uneven during ECM processing.To quantify the smoothness of the surface, the waviness of the mutually perpendicular channels near the inlet and outlet were measured respectively. The measurement results for the four regions (R1-R4) marked on the workpiece are shown in Fig.16.ThesurfacewavinessofR1andR3inthechannelsparallel totheflowdirectionislowerthanS3.0μm.However,thesurface waviness of R2 and R4 in the channels perpendicular to the flow directionishigherthanS21μm.Giventhatelectrolysisproducts such as hydrogen bubbles in channels perpendicular to the flow arenotflushedoutintimeduetothelowelectrolytevelocity,there areevidentflowmarksalongthestreamlinedirectioninthechannels perpendicular to the flow.
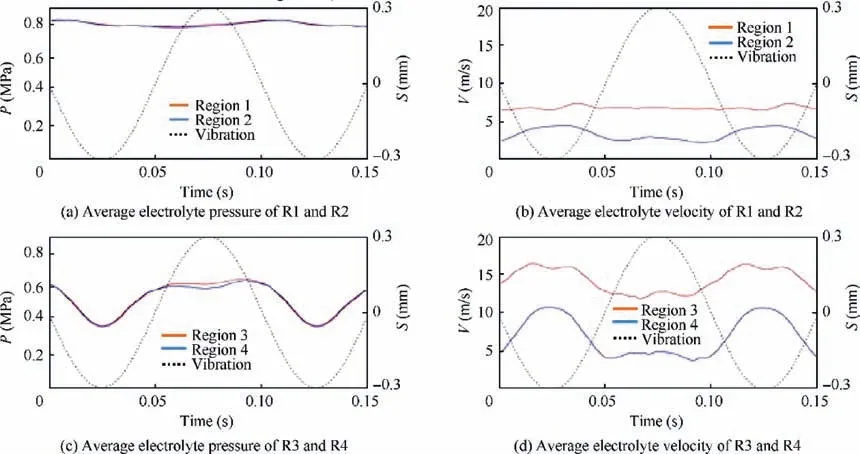
Fig. 12 Average electrolyte pressure and velocity for four regions in ‘‘three-in and one-out” flow field.
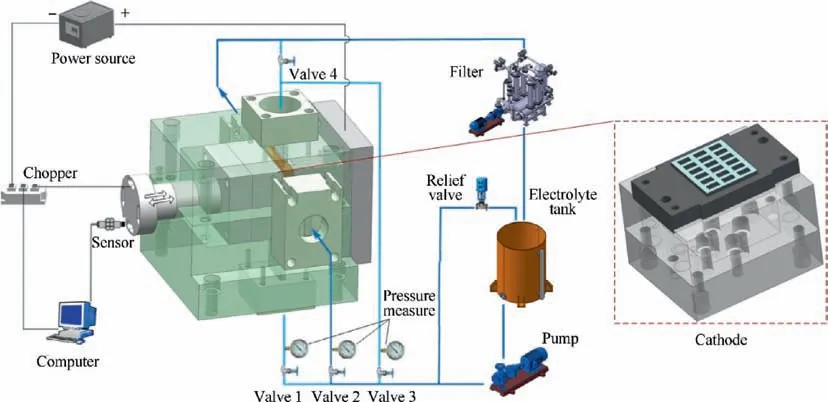
Fig. 13 Overview of experimental equipment for ECM cross-channel array study.

Table 3 Electrolyte modes and corresponding valve status.
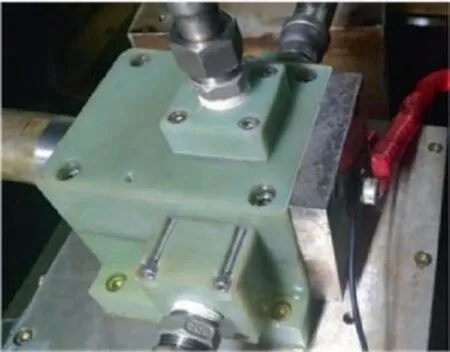
Fig. 14 Fixture with electrolyte and power supply.
5.2. Results of ‘‘two-in and two-out” flow mode
The machined area for the workpiece for the‘‘two-in and twoout” flow mode is shown in Fig. 17. As can be seen from the processed surface,there are clear flow marks in both the mutually perpendicular channels. There is a trend of flow marks to be elongated along the diagonal direction of the rectangular processing area. Regarding the measurement results of the six regions (R1-R6) marked on the workpiece, the surfaces waviness for R1 and R2 near the electrolyte inlet is lower than S2.5 μm, whereas for R3 and R4 near the electrolyte outlet,the surface waviness values increase significantly to S15.5 μm and S13.7 μm.This increase is mainly caused by the relatively low electrolyte pressure and velocity. In addition, after the electrolyte flow has bypassed the rectangular ribs, the electrolyte flow direction becomes disordered. Due to the shorter flow distance and higher electrolyte flow velocity, the surface waviness values for R5 and R6 are superior to those for R3 and R4.
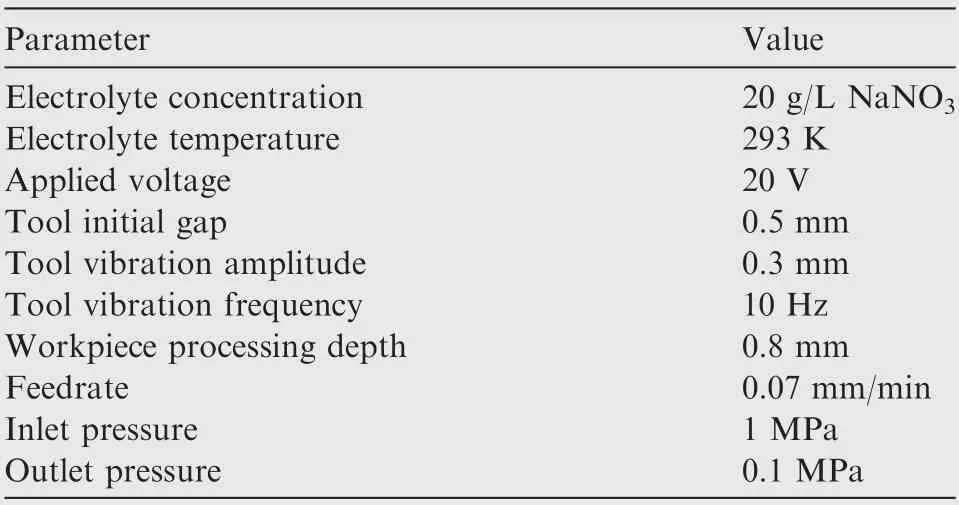
Table 4 Processing parameters for ECM cross-channel array.
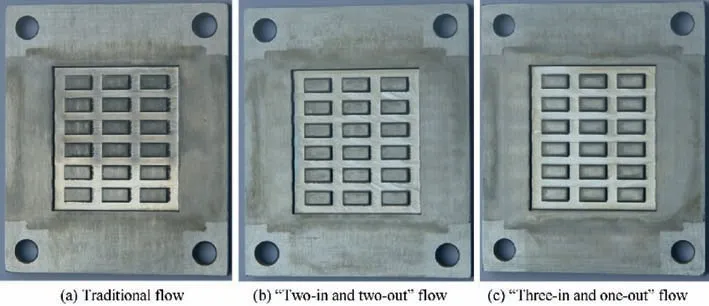
Fig. 15 Processing outcomes for different flow modes.
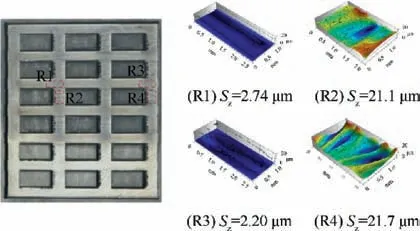
Fig. 16 Experimental and surface measurement results for the traditional flow mode.
5.3. Results for the ‘‘three-in one-out” flow mode
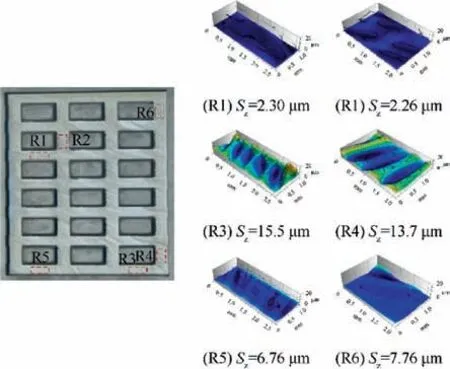
Fig.17 Experimental and surface measurement results for‘‘twoin and two-out” flow mode.
The machined area for the workpiece for the ‘‘three-in oneout” flow mode is shown in Fig. 18. The surface quality of the channels parallel to the traditional flow in this flow mode is comparable to that of the traditional flow mode. Only a small amount of flow patterns along the direction of flow can be observed in the channels perpendicular to the traditional flow.This reveals that such a contracted electrolyte flow is beneficial to improving the surface quality in ECM.The surface waviness values for R1 and R3 were about S3.4 μm,and the values of R2 and R4 were S5.04 μm and S7.76 μm.These data are superior to those of the previous two flow field modes. When the flow on the outer extremities squeezes the central flow region, the flow velocity in the channels parallel to the traditional flow will be slightly reduced while the flow velocity in the channels perpendicular to the traditional flow will increase significantly,thus making the cross-sectional flow rate more uniform. Besides, the substantial increase of the pressure in the processing area effectively compresses the generated gas bubbles and increases the velocity of the flow near the outlet, both processes of which contribute to reducing the incidence of flow marks. Thus the ‘‘three-in one-out” flow mode is considered to be the best flow mode of the three modes examined.
5.4. Parameter optimization for the optimal flow mode
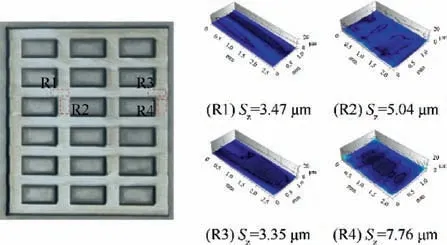
Fig.18 Experiment and surface measurement results for‘‘threein and one-out” flow mode.
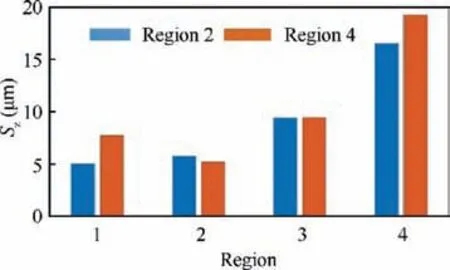
Fig. 19 Surface waviness of the workpieces for parameter optimization experiments.
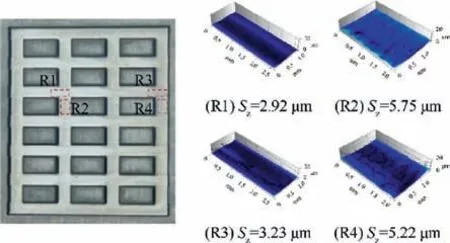
Fig. 20 Results for ‘‘three-in and one-out” flow mode after parameter optimization.
To obtain the optimal processing results, parameter optimization experiments for the ‘‘three-in and one-out” flow mode were performed subsequently. The middle electrolyte inlet pressure was kept constant at 1 MPa and the two other electrolyte inlet pressures were adjusted by gradual decrements.Experiments with two added inlets pressure of 0.8 MPa,0.6 MPa, 0.4 MPa were performed, and the surface waviness of the workpieces were measured respectively. The measurement results for two channels perpendicular to the traditional flow, region 2 and region 4, are shown in Fig. 19. As the two additional inlet pressures decrease,the flow field becomes more and more similar to that for the traditional flow mode. So the surface waviness value of 0.4 MPa is the worst and it is much higher than others. Both 1.0 MPa and 0.8 MPa had low surface waviness values in R2, which are below S5.8 μm. But it can be seen that the surface corresponding to a pressure of 1.0 MPa is significantly worse than that of 0.8 MPa in region R4, the respective values being S7.76 μm (1.0 MPa) and S5.22 μm(0.8 MPa).The experimental results for the optimized‘‘three-in and one-out” flow mode are given in Fig. 20.
6. Summary
The flow field of electrolyte in ECM cross-channel array was designed and optimized to improve the surface waviness of the processed surface. The conclusions can be drawn as follows:
(1) For the traditional electrolyte flow mode, clear flow marks at the bottom of the channels parallel to the flow direction were formed during processing due to the uneven velocity distribution of the electrolyte flow in the mutually perpendicular channels.
(2) By comparing the three different electrolyte flow modes,it canbeconcludedthatbothahighelectrolytepressureanda highelectrolytevelocitycontributetoreducingflowmarks.The‘‘three-in and one-out”flow mode was demonstrated to be the best of the three flow modes examined.
(3) Parameter optimization experiments indicated that the‘‘three-in and one-out” flow field with inlet pressures of 1.0, 0.8, and 0.8 MPa were optimal for producing superior surface waviness values.
The authors declare that they have no known competing financial interests or personal relationships that could have appeared to influence the work reported in this paper.
s
This study is co-supported by the Joint Funds of the Natural Science Foundation of China and Guangdong Province (No.U1601201), the Natural Science Foundation of Jiangsu Province (No. BK20192007) and the National Natural Science Foundation of China for Creative Research Groups (No.51921003).
 Chinese Journal of Aeronautics2022年4期
- Chinese Journal of Aeronautics的其它文章
- Reduced-dimensional MPC controller for direct thrust control
- A multiscale transform denoising method of the bionic polarized light compass for improving the unmanned aerial vehicle navigation accuracy
- Periodic acoustic source tracking using propagation delayed measurements
- Optimal predictive sliding-mode guidance law for intercepting near-space hypersonic maneuvering target
- Sea fog detection based on unsupervised domain adaptation
- Unsteady characteristic research on aerodynamic interaction of slotted wingtip in flapping kinematics
