Analysis of terrestrial water storage changes in the Shaan-Gan-Ning Region using GPS and GRACE/GFO
Xinpo Li ,Bo Zhong ,b,* ,Jinheng Li ,b ,Renli Liu
a School of Geodesy and Geomatics,Wuhan University,Wuhan,430079,China
b Key Laboratory of Geospace Environment and Geodesy,Ministry of Education,Wuhan University,Wuhan,430079,China
c School of Water Resources and Hydropower Engineering,Wuhan University,Wuhan,430072,China
Keywords:Terrestrial water storage Shaan-Gan-Ning Region GPS vertical displacements GRACE/GFO Improved Laplace matrix
ABSTRACT Both the Global Positioning System(GPS)and Gravity Recovery and Climate Experiment(GRACE)/GRACE Follow-On (GFO) provide effective tools to infer surface mass changes.In this paper,we combined GPS,GRACE/GFO spherical harmonic (SH) solutions and GRACE/GFO mascon solutions to analyze the total surface mass changes and terrestrial water storage(TWS)changes in the Shaan-Gan-Ning Region(SGNR)over the period from December 2010 to February 2021.To improve the reliability of GPS inversion results,an improved regularization Laplace matrix and monthly optimal regularization parameter estimation strategy were employed to solve the ill-posed problem.The results show that the improved Laplace matrix can suppress the edge effects better than that of the traditional Laplace matrix,and the correlation coefficient and standard deviation(STD)between the original signal and inversion results from the traditional and improved Laplace matrix are 0.84 and 0.88,and 17.49 mm and 15.16 mm,respectively.The spatial distributions of annual amplitudes and time series changes for total surface mass changes derived from GPS agree well with GRACE/GFO SH solutions and mascon solutions,and the correlation coefficients of total surface mass change time series between GPS and GRACE/GFO SH solutions,GPS and GRACE/GFO mascon solutions are 0.80 and 0.77.However,the obvious differences still exist in local regions.In addition,the seasonal characteristics,increasing and decreasing rate of TWS change time series derived from GPS,GRACE/GFO SH and mascon solutions agree well with the Global Land Data Assimilation System (GLDAS) hydrological model in the studied area,and generally consistent with the precipitation data.Meanwhile,TWS changes derived from GPS and GRACE mascon solutions in the SGNR are more reliable than those of GRACE SH solutions over the period from January 2016 to June 2017(the final operation phase of the GRACE mission).
1.Introduction
The Shaan-Gan-Ning Region (SGNR),i.e.,the Shanxi and Gansu and Ningxia Province,is located in the Northwest of China,and with a total area of approximately 697,800 km.The SGNR has a complex topography(e.g.,plateaus,mountains,basins,deserts,and Gobi,etc.),with an altitude from 460 m to 3600 m [1].Due to the fragile ecological environment and unreasonable land use by humans,there is a serious problem of soil erosion and land desertification in the SGNR.Thus,a study on terrestrial water storage (TWS) changes can optimize the allocation of water resources and promote the sustainable development of the economy and agriculture in this area.TWS includes all water stored on the surface and underground (including surface water,groundwater,glaciers,snow,and soil water,etc.)[2],which is an important part of the global water cycle.The migration and redistribution of TWS can induce changes in the Earth's external gravity field and crustal displacement field [3].Conversely,by observing the spatial and temporal changes of the Earth's external gravity field and surface displacement field,mass migration and exchange process of the Earth system can be inferred and monitored.
In recent years,space geodesy technologies have provided effective ways to monitor the surface mass changes.The Gravity Recovery and Climate Experiment (GRACE) satellite (from March 2002 to June 2017) and its successor GRACE Follow-On (GFO,launched on May 22,2018) can provide monthly surface mass changes with 1 cm equivalent water high (EWH) precision and~400 km spatial resolution[4-7].GRACE/GFO has been widely used to study the land hydrological cycle [8-10],Earth's cryosphere[11-13],sea level changes[14-16],and other applications for solid Earth(earthquake[17],Glacial Isostatic Adjustment[18],and polar motion [19],etc.).Meanwhile,Global Positioning System (GPS)continuous observation network has been widely used to monitor the Earth's surface displacements induced by redistribution of mass loading at millimeter-level accuracy,and the TWS changes can be independently inferred from GPS surface displacement data based on the loading Green's function theory [20].Argus et al.[21] first used GPS deformation data to infer regional terrestrial water storage changes and found that the GPS-derived TWS changes show good agreement with GRACE and hydrological models.Since then,many studies have used GPS data to study the regional TWS changes over different areas,such as the United States [22-24],China [25-29],and South America [30].In addition,due to the continuous and real-time monitoring of the surface displacements by GPS networks,GPS-derived mass changes can help to supplement the data gaps of GRACE/GFO estimates [23,28,31].However,the inversion method of regional surface mass changes inferred from GPS is still in the development stage.There are still many problems that need to be further studied,e.g.,regularization of illposed problems (including the construction of constraint matrix and optimal estimation of regularization parameter).Moreover,TWS changes inferred by GPS displacements need to be widely studied and validated in other typical regions,especially with relatively dense distributions of GPS stations.
In this study,we combined 77 GPS vertical displacement time series from the Crustal Movement Observation Network of China(CMONOC),and GRACE/GFO spherical harmonic(SH)solutions and mascon solutions from the Center for Space Research (CSR) to further investigate the TWS changes over the period from December 2010 to February 2021 in the SGNR.First,an improved regularization constraint Laplace matrix and monthly optimal regularization parameter estimation strategy were employed to stabilize the GPS inversion results.Second,the spatial distributions of annual amplitudes and seasonal characteristic of total surface mass changes from GPS,GRACE/GFO SH solutions,and GRACE/GFO mascon solutions were presented.Third,the linear trend and seasonal changes of TWS in the SGNR were analyzed and compared in detail from GPS vertical displacements,GRACE/GFO SH and mascon solutions,GLDAS,and precipitation data.Finally,some conclusions and suggestions are given.
2.Study area and datasets
2.1.Study area
The Shaan-Gan-Ning Region(SGNR)located in the Northwest of China (3142-4257N and 9213-11115E,see Fig.1) was chosen as the study area in this paper.The topography of the SGNR has obvious undulations with altitude ranging 460 m-3600 m,making it very sensitive to climate variability.This area spans four climatic zones (i.e.,subtropical monsoon climate,temperate monsoon climate,temperate continental climate and plateau alpine climate),with an annual precipitation from 37 mm to 1240 mm,and annual average temperature from-9C to 16C[1].Meanwhile,the SGNR is one of the important corn producing areas in China.Hence,it is of great practical significance and scientific value for utilization of water resources and monitoring of extreme climate changes to investigate the TWS changes in the SGNR.
2.2.GPS data and post-processing
In this study,a total of 77 continuous GPS(CGPS)station vertical displacement time series over the period from December 2010 to February 2021 in the SGNR from the Crustal Movement Observation Network of China (CMONOC) were used to infer the TWS changes.The CGPS data are provided by National Earthquake Data Center (http://www.eqdsc.com) and processed by the First Monitoring and Application Center,China Earthquake Administration.All the CGPS time series of CMONOC are processed by the GAMIT/GLOBK software (release 10.4) developed by the Massachusetts Institute of Technology (MIT) based on the double-differenced model [32].Based on the GAMIT-derived baseline solutions,the International Global Navigation Satellite System (GNSS) Service core stations with good quality and evenly distributed are selected as fixed reference stations,then the GLOBK is employed in joint adjustment to obtain the final vertical displacement time series of the CGPS stations relative to the International Terrestrial Reference Frame (ITRF).More details of CGPS data processing for CMONOC can be found from the solution instructions and manual (http://www.eqdsc.com/eastern/uploadMark/2016/09/14/08/2016-09-14-08-0445262696.pdf).
The CGPS time series from CMONOC were removed the effects of solid Earth tides,ocean tides loadings and pole tides,which mainly reflect loading deformation derived from TWS and non-tidal atmospheric and oceanic effects.In this study,the gross error detection method of interquartile statistics [33] and least squares linear fitting method were used to remove the gross errors and jumps,and the long-term trend mainly affected by the Glacial Isostatic Adjustment (GIA) or tectonic effects was deducted from CGPS vertical displacement time series.Then we used the Kriged Kalman Filter method from Liu et al.[34]to interpolate the missing data.Fig.2 shows the original(blue curve)and filtered(red curve)CGPS vertical displacement time series for GSMQ and NXHY station;we can see that the filtering process can well interpolate the missing data and suppress the high-frequency errors.
2.3.GRACE/GFO solutions
GRACE/GFO SH solutions (ftp://isdcftp.gfz-potsdam.de/grace/Level-2/CSR/RL06/) and GRACE/GFO mascon solutions (http://www2.csr.utexas.edu/grace/RL06_mascons.html) published by the Center for Space Research(CSR)at the University of Texas at Austin were used to infer TWS changes in the SGNR.
In order to keep the consistency of GPS and GRACE/GFO SH inversion results,we added back the degree-1 components provided by the GRACE project as supplementary datasets (GRACE Technical Note 13)[35]to GRACE/GFO SH solutions.Meanwhile,we replaced the Cand Ccoefficients by the Satellite Laser Ranging(SLR) solutions provided by the GRACE/GFO Science Data System(SDS) team [36] due to the uncertainty of low-degree SH coefficients for GRACE/GFO data.In addition,the de-striping method P3M6 [37] and Gaussian filtering with the averaging radius of 300 km were used to reduce the longitudinal stripes and residual high SH degree errors.Further,the basin-scale factor method [38]was employed to correct the leakage errors for filtered SH solutions.Moreover,the atmosphere combined with ocean(GAC)fields from Atmosphere and Ocean De-aliasing Level-1B (AOD1B) RL06 products (ftp://isdcftp.gfz-potsdam.de/grace/Level-2/CSR/RL06/) were added back to the GRACE/GFO SH solutions when comparing the total surface mass changes derived by GPS and GRACE/GFO in the studied area.The method of using GRACE/GFO SH coefficients to calculate surface mass changes can be found in Wahr et al.[39].
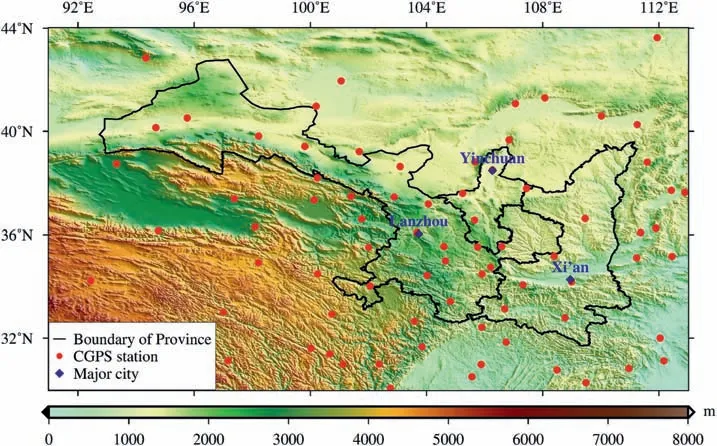
Fig.1.Topography variations of the Shaan-Gan-Ning and its surrounding regions,where the solid black curves are boundaries of provinces,the red dots represent the locations of continuous GPS stations,and the blue rhombuses indicate the locations of the capital cities.
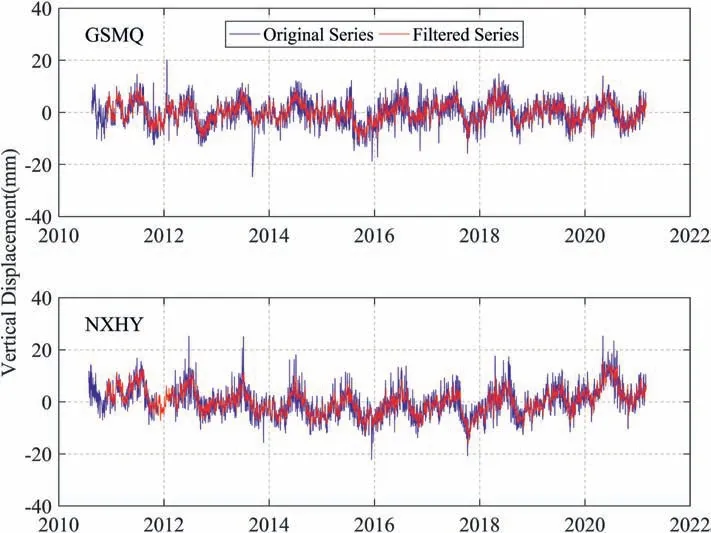
Fig.2.Comparisons of CGPS vertical displacement time series before(blue curve)and after(red curve)processed by Kriged Kalman Filter for two selected stations(i.e.,GSMQ and NXHY).
GRACE/GFO mascon solutions from CSR are provided on 0.25×0.25grids,but computed on an equal area geodesic grid comprised of hexagonal tiles approximately 120 km wide (~1×1at the equator).In addition,these mascon products were also applied several corrections like GRACE/GFO SH solutions,e.g.,the Cand C(only for GFO)term replacement with the SLR estimates for both GRACE and GFO,the geo-center correction with the degree-1 coefficients,and the GIA correction with the ICE-6G_D model.
2.4.Global Land Data Assimilation System (GLDAS) model
Global Land Data Assimilation System (GLDAS) is jointly established by the National Aeronautics and Space Administration's(NASA) Goddard Space Flight Center (GSFC) and National Oceanic and Atmospheric Administration's (NOAA) National Centers of Environmental Prediction (NECP) [40].Currently,the GLDAS derives four models:NOAH,VIC,CLM,and MOSAIC,which integrate a variety of land surface flux information in the form of grids (e.g.,soil moisture,soil temperature,evaporation,rainfall,runoff,and snow,etc.).In this study,we summed the canopy water,soil moisture (0-2 m),and snow water equivalent with monthly intervals and spatial resolution of 0.25×0.25grids from GLDAS_NOAH_V021 (https://hydro1.gesdisc.eosdis.nasa.gov/opendap/GLDAS/GLDAS_NOAH025_M.2.1/) to obtain TWS changes in the SGNR from December 2010 to February 2021.
2.5.Rainfall data
The monthly precipitation data were downloaded from the China Meteorological Data Network(http://data.cma.cn/),which is managed and operated by the National Meteorological Information Center(NMIC).These data sets are made into 0.5×0.5rectangle grids using records from 2472 stations in China.In this study,we used monthly precipitation data from December 2010 to December 2020 to obtain the precipitation changes in the SGNR.
3.Methods
3.1.GPS inversion model for terrestrial water storage
Based on the elastic loading theory,the redistribution of the surface mass loading(e.g.,terrestrial water storage)can induce the crust to deform,and the elastic deformation induced by the surface mass changes can be expressed as the convolution of the mass loading and Green's function in the spatial domain [20]:

R
is the radius of the Earth(6378.137 km),λ~λand φ~φrepresent the range of latitude and longitude in the studied area,Δm
(φ,λ)is the mass loading of the grid cell,andG
(θ)is the Green's function.As for the vertical displacement,theG
(θ)can be expressed as:
M
is the mass of the Earth (5.965 × 10kg),h
are the loading Love numbers from Wang et al.[41],andP
are the Legendre polynomials of orderl
.To estimate more precise surface mass changes,we divided the studied area into a spatial resolution of 0.25×0.25geographic grids.Due to the correlation between the observations of adjacent stations resulting in a large condition number for the coefficient matrix,using GPS vertical displacement data to infer regional TWS changes is a discrete ill-posed problem.Here,we used the Tikhonov regularization method [42,43] to stabilize the ill-posed problem,and the inversion model can be expressed as follows:

A
is the coefficient matrix from the Green's function,x
are the unknown TWS parameters to be estimated,u
are the GPS vertical displacement observations,σis the noise variance of the observations,L
is the regularization constraint matrix,and λ >0 is the regularization parameter.3.2.Regularization constraint method
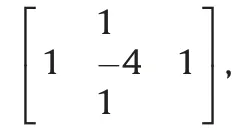
The regularization parameter λ controls the relative weight between the misfit and model roughness.At present,the regularization parameters can be mainly estimated by Ridge Trace method,Lcurve method [44,45] and Generalized Cross-Validation (GCV)method [46],etc.Here,we used the GCV method to estimate the optimal regularization parameter.In general,the regularization parameter λ satisfying the minimum GCV function is the optimal value,and the GCV function is as follows:

I
is the identity matrix,n
is the total number of the observations,y
is the vertical displacements observation vector,Q
(λ)=A
(AA
+λP
)A
is a matrix that maps the observed value vectoru
in Eq.(1) to the solution vectorx
,andP
=L
L
.4.Results and discussion
4.1.Simulation tests using different regularization constraint matrices
As mentioned in Section 3.2 that the traditional Laplace matrix cannot fully make use of the adjacent information of the grid cells,we introduced an improved Laplace matrix that can well constrain TWS changes between the adjacent grid cells.In order to verify the superiority of the improved Laplace matrix over the traditional Laplace matrix,a closed-loop simulation test was implemented from the simulated GPS vertical displacements data.We used the GLDAS hydrological model to simulate vertical displacements of the 77 CGPS stations in September 2005 (see Fig.3) using Eq.(1).The Gaussian white noises with a standard deviation of 1 mm were added to the simulated GPS data before inversion of TWS changes.Then the TWS changes can be inferred by the inversion model of Eq.(3).Fig.4 shows the TWS changes inferred from GPS and their differences with the original signal from traditional (left panels)and improved(right panels) Laplace matrix constraints.
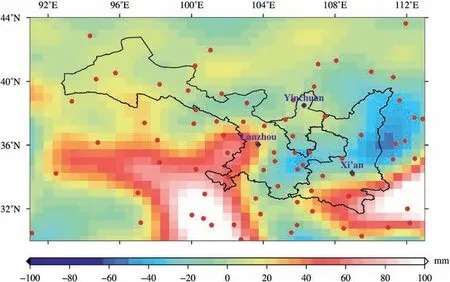
Fig.3.Original signal:TWS changes in the SGNR simulated from GLDAS hydrological model (in September 2005).
As shown in Fig.4(a) and (b),both the inversion results from traditional and improved Laplace matrix well recovered the TWS changes compared with the original signal shown in Fig.3,while the inversion results of traditional Laplace matrix show obvious spurious signals in the edge regions.Comparing the differences in Fig.4(c) and (d),there are large outliers in the western and southern edges in Fig.4(c),while the differences in the edge regions in Fig.4(d) are relatively small.Table 1 lists the regularization parameter,correlation coefficient,and the standard deviation(STD)between the original signal and inversion results from the traditional and improved Laplace matrix constraints over the entire region and within the SGNR,respectively.The correlation coefficients and STD statistics between the original signal and inversion results from the traditional and improved Laplace matrix over the entire region are 0.84 and 0.88,and 17.49 mm and 15.16 mm,respectively.Moreover,within the SGNR,the corresponding correlation coefficients and STD statistics are 0.84 and 0.85,and 14.16 mm and 13.58 mm,respectively.We can see that the correlation coefficient and STD corresponding to the improved Laplace matrix are better than that of the traditional Laplace matrix over the entire region (or within the SGNR).In addition,the regularization parameter corresponding to the improved Laplace matrix is smaller(i.e.,weaker constrain)than that of the traditional Laplace matrix,but the inversion result is in better agreement with the original signal.Comparisons and statistical results from Fig.4 and Table 1 show that the improved Laplace matrix is better than the traditional Laplace matrix in suppressing the edge effects,and can improve the reliability of GPS inversion results.

Table 1 Statistics of the regularization parameter,correlation coefficient,and standard deviation(STD)between the original signal and GPS inversion results from the traditional and improved Laplace matrix constraints over the entire region,and the corresponding correlation coefficient and STD within the SGNR are given in parentheses.
4.2.Inversion results and analysis
4.2.1.Surface mass changes derived from GPS and GRACE/GFO
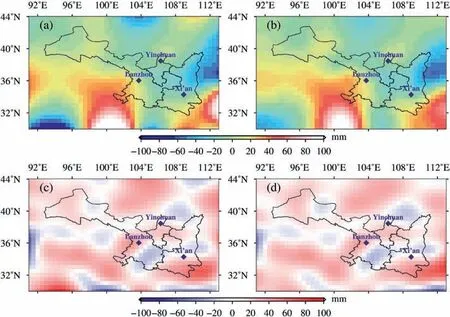
Fig.4.(a) and (b) show the spatial distributions of TWS changes inferred from the traditional and improved Laplace matrix constraints,respectively;(c) and (d) show the differences between the original signal and inversion results from the traditional and improved Laplace matrix constraints,respectively.
To examine the performance of GPS and GRACE/GFO in monitoring the total surface mass changes (including TWS,non-tidal atmospheric and oceanic loading effects),we used vertical displacement time series at 77 CGPS stations from CMONOC to invert total surface mass changes in the SGNR,and compared them with GRACE/GFO derived results with AOD1B GAC contributions.In particular,GRACE SH and GFO SH inversion results were corrected by basin-scale factor with 1.04 and 1.11 based on GLDAS hydrological model.The spatial distributions of annual amplitudes for total surface mass changes derived by GRACE/GFO mascon solutions (December 2010 to June 2017/June 2018 to February 2021),GRACE/GFO SH solutions (December 2010 to June 2017/June 2018 to February 2021),and GPS(December 2010 to February 2021)are presented in Fig.5,respectively.As shown in Fig.5,the largest annual amplitudes located in Southeast parts of the SGNR,while the remaining parts show the relatively smaller amplitude.Compared with the GRACE/GFO SH solutions and the GPS-derived results,the GRACE/GFO mascon solutions present more detailed surface mass changes in the studied area.Meanwhile,the spatial distributions of annual amplitude inverted by GPS are generally in agreement with those from GRACE/GFO mascon solutions and GRACE/GFO SH solutions except for some local regions.The results show that the total surface mass changes inferred from GPS,GRACE/GFO mascon solutions and GRACE/GFO SH solutions have good consistency on the seasonal time scale in the SGNR.
Fig.6(a) reveals the total surface mass change time series inverted by GPS from December 2010 to February 2021,GRACE/GFO SH solutions and GRACE/GFO mascon solutions (plus GAC) from December 2010 to June 2017/June 2018 to February 2021.Fig.6(b)shows the monthly optimal regularization parameters estimated by GCV method corresponding to the GPS inversion results.
As shown in Fig.6(a),since ground-based GPS is more sensitive to regional mass loading changes,we can see that the amplitudes of GPS-derived total surface mass change time series are larger than those of GRACE/GFO SH solutions and mascon solutions.The interannual total surface mass changes derived from GPS are in good agreement with the GRACE/GFO inversion results,and the correlation coefficients of total surface mass change time series between GPS and GRACE/GFO SH solutions,GPS and GRACE/GFO mascon solutions are 0.80 and 0.77,respectively.Meanwhile,the GPSderived results can bridge the data gap between GRACE and GFO missions in the SGNR.Unlike the previous studies(e.g.,Fu et al.[23]and He et al.[26]),only one empirical regularization parameter was given for a specific studied area;we clearly estimated the monthly optimal regularization parameter to improve the reliability of the GPS inversion results.As shown in Fig.6(b),the regularization parameters estimated by GCV method are between 0 and 1.5,and with an average value of 0.26.
4.2.2.Comparisons of TWS changes from different data
By deducting the non-tidal atmospheric effects from the total surface mass changes (shown in Fig.6(a)),we can obtain the TWS changes over the SGNR.To better understand the TWS changes over the SGNR,the linear trends and seasonal changes of the inversion results were further analyzed from the different types of data.Fig.7 shows the raw TWS change time series,linear trends,and seasonal changes derived by GPS(December 2010 to February 2021),GRACE/GFO SH solutions (December 2010 to June 2017/June 2018 to February 2021),GRACE/GFO mascon solutions (December 2010 to June 2017/June 2018 to February 2021)and GLDAS(December 2010 to February 2021).

Fig.5.Comparisons of annual amplitudes for total surface mass changes estimated by GPS and GRACE/GFO mascon solutions and spherical harmonic solutions.(a) Annual amplitudes derived from GRACE/GFO mascon solutions (GRACE/GFO M,December 2010 to June 2017/June 2018 to February 2021);(b) Annual amplitudes derived from GRACE/GFO spherical harmonic solutions(GRACE/GFO SH,December 2010 to June 2017/June 2018 to February 2021);(c)Annual amplitudes derived from GPS over the period from December 2010 to February 2021,and the red dots represent the locations of GPS stations.
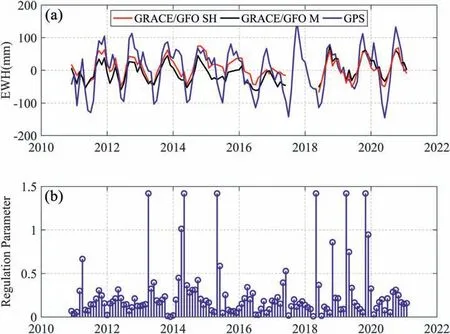
Fig.6.(a) The total surface mass change time series inverted by GPS from December 2010 to February 2021,GRACE/GFO spherical harmonic solutions (GRACE/GFO SH,December 2010 to June 2017/June 2018 to February 2021),and GRACE/GFO mascon solutions(GRACE/GFO M,December 2010 to June 2017/June 2018 to February 2021);(b)Estimated values of monthly optimal regularization parameters corresponding to the GPS inversion results.
As shown in Fig.7(a),TWS change time series inferred from GRACE/GFO SH solutions (red curve) and GRACE/GFO mascon solutions (black curve) show decreasing trend from December 2010 to June 2017 and increasing trend from June 2018 to February 2021.The correlation coefficient and STD of TWS change time series between GRACE/GFO SH solutions and mascon solutions are 0.50 and 21.57 mm,respectively.The GPS-derived TWS change time series (blue curve) also shows the same decreasing and increasing trend changes like GRACE/GFO results,but captures the nearly oneyear missing gap information between GRACE and GFO.As mentioned above,the correlation coefficients of the total mass change time series between GPS and GRACE/GFO SH solutions,GPS and GRACE/GFO mascon solutions are 0.80 and 0.77,respectively,while the corresponding correlation coefficients of TWS change time series between GPS and GRACE/GFO SH solutions,GPS and GRACE/GFO mascon solutions are 0.45 and 0.38.Furthermore,it is shown that the non-tidal atmospheric effects occupy the important components of total surface mass changes in the SGNR.For comparisons,the GLDAS-derived TWS change time series (turquoise curve)is also shown in Fig.7(a);it still indicates the decreasing and increasing trend like GRACE/GFO and GPS.Fig.7(b) shows the annual components of the TWS change time series from GPS,GRACE/GFO SH solutions and mascon solutions,and GLDAS.The GPS-derived TWS changes show a larger amplitude than those of GRACE/GFO and GLDAS,followed by GRACE/GFO SH solutions and mascon solutions,and the amplitude of GLDAS is the smallest.Similarly,the phases of the TWS change time series from GPS,GRACE/GFO,and GLDAS are generally in good agreement.
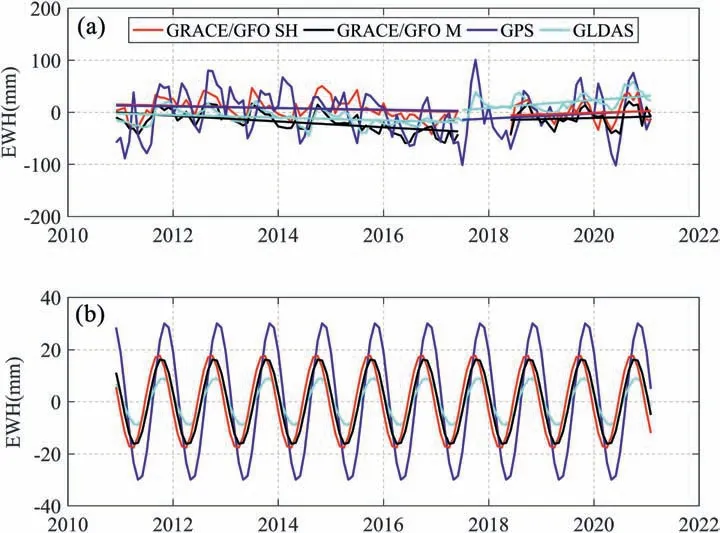
Fig.7.(a) Raw TWS change time series inferred from GPS (December 2010 to February 2021),GRACE/GFO spherical harmonic solutions (GRACE/GFO SH,December 2010 to June 2017/June 2018 to February 2021),GRACE/GFO mascon solutions(GRACE/GFO M,December 2010 to June 2017/June 2018 to February 2021)and GLDAS(December 2010 to February 2021).(b) Annual components of the raw TWS change time series from the different types of data.
Table 2 lists detailed comparisons of the annual amplitude,phase,and liner trend of the TWS change time series derived from GPS,GRACE/GFO SH solutions and mascon solutions,and GLDAS.Because GPS is more sensitive to regional mass changes,the amplitudes of GPS are much larger than those of GRACE/GFO SH solutions and mascon solutions,and GLDAS has the smallest amplitude because it does not include groundwater and separate surface water components (e.g.,rivers and lakes).The phases of TWS change time series from GPS and GLDAS over the period from December 2010 to February 2021 are closer.Due to the influence of filtering process of SH solutions and the regularization constraints process of mascon solutions,the phases of the GRACE/GFO SH solutions and mascon solutions are slightly different.In general,the TWS change time series obtained from these four types of data do not have obvious phase differences.The TWS decreasing rate obtained by GRACE mascon solutions (i.e.,-5.52 ± 1.79 mm/yr) is greater than those of GPS,GRACE SH solutions,and GLDAS from December 2010 to June 2017.The TWS increasing rate obtained by GLDAS (i.e.,7.73 ± 3.26 mm/yr) is greater than those of GPS (from July 2017 to February 2021),GFO SH solutions and mascon solutions (from June 2018 to February 2021).Although the TWS decreasing and increasing changes obtained by GPS,GRACE SH solutions and mascon solutions,and GLDAS are slightly different over the studied period,all of them can well reveal the increasing changes from December 2010 to June 2017,and decreasing changes from July 2017 or June 2018 to February 2021.
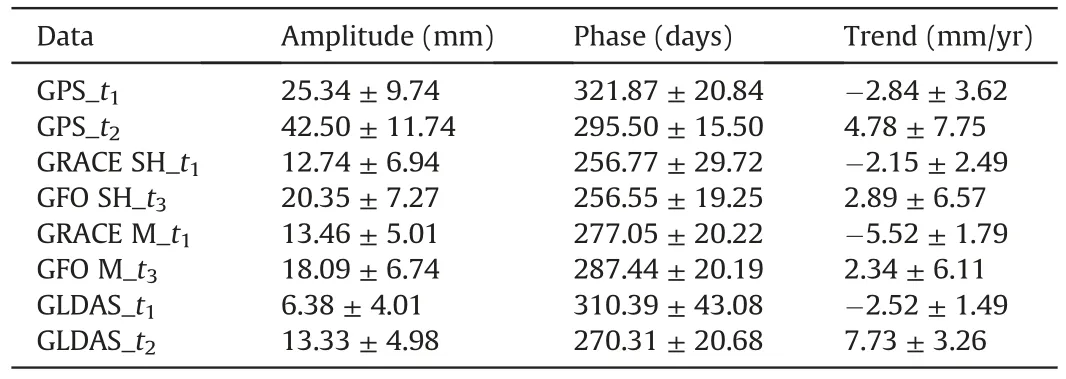
Table 2 Annual amplitude,phase,and linear trend of the TWS change time series from GPS,GRACE/GFO SH solutions (GRACE/GFO SH),GRACE/GFO mascon solutions (GRACE/GFO M),and GLDAS.
Fig.8 illustrates the monthly precipitation and the TWS change time series inferred from the GPS,GLDAS,and GRACE/GFO mascon solutions from December 2010 to December 2020 over the SGNR.We can see that the precipitation shows a decreasing trend from December 2010 to December 2015 and an increasing trend from January 2016 to December 2020,and with the variation rate of -0.94 ± 3.12 mm/mon/yr and 0.76 ± 2.74 mm/mon/yr,respectively.It is generally consistent with the trends of TWS change time series,which indicates that the decreasing and increasing changes of TWS in the SGNR are related to the precipitation changes.
However,there are still some differences (e.g.,due to different data processing strategies and error sources,etc.) between the inversion results derived by GPS,GRACE/GFO SH solutions and mascon solutions.For example,we further compared the TWS change time series from GPS,GRACE SH solutions and GRACE mascon solutions during the period of January 2016 and June 2017 in the SGNR.Fig.9 shows comparisons of TWS change time series from GPS,GRACE SH solutions and GRACE mascon solutions during January 2016 to June 2017(the final operation phase of the GRACE mission).We can see that the consistency of TWS change time series between GPS and GRACE mascon solutions is better than that between GPS and GRACE SH solutions,and the correlation coefficient and STD of the TWS change time series between GPS and GRACE SH solutions,GPS and GRACE mascon solutions are -0.12 and 0.64,and 33.80 mm and 23.13 mm,respectively.It indicates that the TWS changes derived from GPS and GRACE mascon solutions are more reliable than those of GRACE SH solutions from January 2016 to June 2017 in the SGNR.
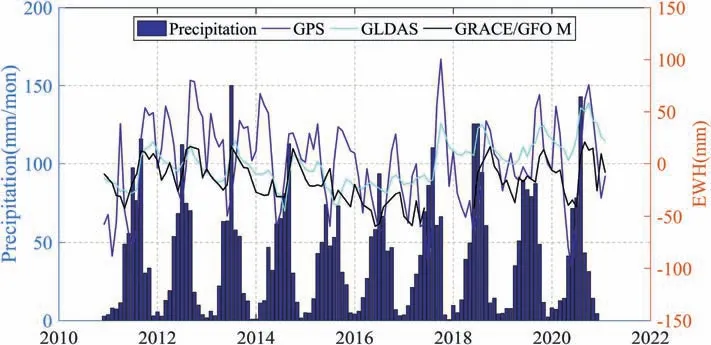
Fig.8.Comparisons of the monthly precipitation change time series(mm/mon)and the TWS change time series(mm)derived from GPS,GLDAS,and GRACE/GFO mascon solutions in the SGNR over the period from December 2010 to December 2020.
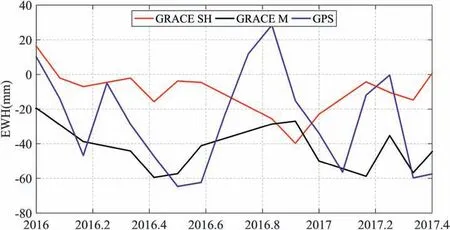
Fig.9.Comparisons of TWS change time series from GPS,GRACE SH solutions (GRACE SH) and GRACE mascon solutions (GRACE M) during January 2016 and June 2017.
5.Conclusion
In this study,TWS changes in the Shaan-Gan-Ning Region(SGNR) were estimated by the vertical displacements of 77 CGPS stations from CMONOC,GRACE/GFO SH solutions and mascon solutions,and GLDAS hydrological model over the period from December 2010 to February 2021.An improved Laplace matrix and monthly optimal regularization parameter estimated by GCV method were employed to improve the reliability of GPS inversion results.Meanwhile,the liner trends and seasonal changes of TWS in the SGNR were further analyzed from different types of data.
Numerical simulation results show that both the inversion results from the traditional and improved Laplace matrix can recover the TWS changes compared with the original signal in the SGNR.However,the improved Laplace matrix can fully utilize the TWS changes information between the adjacent grid cells,and better suppress the edge effects than the traditional Laplace matrix.The correlation coefficients and STD statistics between the original signal and inversion results from the traditional and improved Laplace matrix over the entire region(or within the SGNR)are 0.84(0.84)and 0.88(0.85),and 17.49(14.16)mm and 15.16(13.58)mm,respectively,which further indicate the reliability of the improved Laplacian matrix that employed in this study.
Unlike only one empirical regularization parameter was used to estimate the surface mass changes for a specific studied area,we clearly calculated the monthly regularization parameter for the GPS inversion results to improve the reliability of estimated surface mass changes.The spatial distributions of annual amplitudes and time series of total surface mass changes derived from GPS,GRACE/GFO SH and mascon solutions showed good consistency,and the correlation coefficients of the total mass change time series between GPS and GRACE/GFO SH solutions,GPS and GRACE/GFO mascon solutions are 0.80 and 0.77,respectively.The linear trends and seasonal characteristics of TWS change time series from December 2010 to February 2021 were well revealed by GPS,GRACE/GFO SH solutions and mascon solutions,and GLDAS in the SGNR.The annual amplitudes and phases of TWS change time series obtained by GPS,GRACE/GFO SH solutions and mascon solutions,and GLDAS are in good agreement,while the GPS inversion results have the largest amplitude because GPS is more sensitive to regional TWS changes,and the GLDAS-derived TWS time series has the smallest amplitude because it does not include groundwater and separate surface water components(e.g.,rivers and lakes).The decreasing and increasing rate of TWS change time series derived by GPS,GRACE/GFO SH solutions and mascon solutions,and GLDAS are in good agreement in the SGNR,and generally consistent with the precipitation data.Meanwhile,the TWS changes derived from GPS and GRACE mascon solutions are more reliable than those of GRACE SH solutions in the SGNR over the period from January 2016 to June 2017(i.e.,the final operation phase of the GRACE mission).
Author statement
Xianpao Li
:Methodology,Software,Writing-Original draft.Bo Zhong
:Conceptualization,Funding acquisition,Writing-Reviewing and Editing.Jiancheng Li
:Methodology,Writing-Reviewing and EditingRenli Liu
:Data curation,Validation.Conflicts of interest
The authors certify that they have no conflicts of interest.
Acknowledgment
This study was funded by the National Natural Science Foundation of China(Grant Nos.41974015,42061134007 and 41474019).The authors would like to thank the First Monitoring and Application Center for the GPS data of the Crustal Movement Observation Network of China (CMONOC),the Center for Space Research(CSR) for providing the GRACE RL06 spherical harmonic and mascon solutions,the GES DISC for providing the GLDAS hydrological models,and the China Meteorological Data Network for providing the precipitation products.
 Geodesy and Geodynamics2022年2期
- Geodesy and Geodynamics的其它文章
- Mitigation of time-series InSAR turbulent atmospheric phase noise:A review
- Coseismic fault model of the 2017 MW 6.5 Jiuzhaigou earthquake and implications for the regional fault slip pattern
- Review of the SBAS InSAR Time-series algorithms,applications,and challenges
- Extraction and analysis of saline soil deformation in the Qarhan Salt Lake region (in Qinghai,China) by the sentinel SBAS-InSAR technique
- Monitoring landslide associated with reservoir impoundment using synthetic aperture radar interferometry:A case study of the Yalong reservoir
- Co-and post-seismic slip analysis of the 2017 MW7.3 Sarpol Zahab earthquake using Sentinel-1 data
