
Coseismic fault model of the 2017 MW 6.5 Jiuzhaigou earthquake and implications for the regional fault slip pattern
2022-03-26 09:04:32YangLiuYangmaoWenZhicaiLiYingPengCaijunXu
Geodesy and Geodynamics 2022年2期
Yang Liu ,Yangmao Wen ,* ,Zhicai Li ,Ying Peng ,Caijun Xu
a School of Geodesy and Geomatics,Wuhan University,Wuhan 430079,China b Key Laboratory of Geospace Environment and Geodesy,Ministry of Education,Wuhan University,Wuhan 430079,China c Key Laboratory of Geophysical Geodesy,Ministry of Natural Resources,Wuhan University,Wuhan 430079,China d Department of Geodesy,National Geomatics Center of China,Beijing 100830,China e School of Geoscience and Surveying Engineering,China University of Mining and Technology-Beijing,Beijing 100083,China f Changguang Satellite Technology Co.,Ltd,Changchun 130102,China
Keywords:2017 MW 6.5 Jiuzhaigou earthquake InSAR Fault model Boundary element method Regional fault slip pattern
ABSTRACT On August 8,2017,an MW 6.5 earthquake occurred in Jiuzhaigou County,Sichuan Province,China,on the eastern margin of the Qinghai-Tibet Plateau.This study investigates the coseismic deformation field and fault model with ascending and descending Sentinel-1 synthetic aperture radar(SAR)images,aftershock distribution,and elastic half-space dislocation model.The regional fault slip pattern is then quantitatively examined using the boundary element method.The results show that the ascending and descending interferometric synthetic aperture radar (InSAR) coseismic deformation fields display an overall NNW-SSE trend,with more significant deformation on the southwest side of the fault.The coseismic fault geometry is divided into NW and SE sub-faults with strikes of 162.1° and 149.3°,respectively.The coseismic fault slip is dominated by a left-lateral strike-slip movement with an average rake of -2.31°,mainly occurring at a depth of 0-13.04 km with a shape of an approximately inverted triangle.The fault slip features two peak slip zones,with a maximum of 1.39 m.The total seismic moment is 6.34 × 10¹⁸ N·m (MW 6.47).The boundary element calculation quantitatively indicates that the regional fault slip pattern may be mainly attributable to the changing strike and dip.The strike changes from NNW-SSE to nearly NS direction,and the dip gradually decreases from the Jiuzhaigou earthquake fault in the north to the Huya fault in the south.With these characteristics,the Huya and the Jiuzhaigou earthquake faults form the eastern boundary of the Minshan uplift zone and accommodate the accumulated deformation.
1.Introduction
On August 8,2017,at 13:19 coordinated universal time(UTC),anM
6.5 earthquake occurred in Jiuzhaigou County,Sichuan Province,China (Fig.1),causing substantial damage [1-3].The earthquake epicenter is located in the northeast Bayan Har block on the eastern margin of the Qinghai-Tibet Plateau [4-7].The regional geological structure in this area is complex with many active faults;earthquakes occur with high intensity and frequency[8,9].The Huya fault on the south side of the Jiuzhaigou earthquake fault has experienced the 1973-1976 Songpan strong earthquake sequence:theM
6.5 on August 11,1973;theM
7.2 on August 16,1976;theM
6.7 on August 22,1976;and theM
7.2 on August 23,1976 earthquakes(Fig.1)[10,11].The Jiuzhaigou earthquake zone is characterized by high altitude,lush vegetation,and undulating terrain.To date,there are an insufficient number of studies on the geometric and kinematic characteristics of regional faults.The occurrence of a strong earthquake provides an opportunity for further investigation.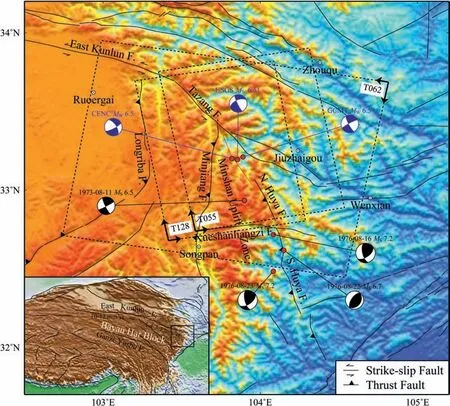
Fig.1.Tectonic setting of the 2017 MW 6.5 Jiuzhaigou earthquake.Black solid lines represent the active fault[4].The solid red line denotes the surface trace of the two-segment fault model(NW and SE sub-faults)of the MW 6.5 Jiuzhaigou earthquake used in this study.Huya fault includes north Huya fault and south Huya fault.Blue beach balls represent the focal mechanism of the Jiuzhaigou earthquake from the China Earthquake Networks Center(CENC),Global Centroid Moment Tensor(GCMT),and United States Geological Survey(USGS).Black beach balls represent the focal mechanism of the 1973-1976 Songpan strong earthquake sequence [10,11].The dashed boxes represent the coverage of Sentinel-1 synthetic aperture radar (SAR) observations,with long and short arrows indicating the azimuth and range directions,respectively.
Following the Jiuzhaigou earthquake,several studies investigated the characteristics of rupture faults (Table 1).Based on the single-segment fault model or focal mechanism solution,previous studies indicated that the strike ranged from 150to 158,the dip from 50to 90,and the rake from-20to~10[12-18].Based on the two-segment fault model,previous studies indicated that the strike ranged from 145to 171,the dip from 61to 90[19-21].It should be noted that the fault planes in Ji et al.[19]dip toward NE,which is opposite to the SW orientation in other studies.Based on the three-segment fault model,Sun et al.[22] concluded that the strike and dip of the main fault(sub-fault 1)were close to those of the single-segment fault model [15,17,18].These studies show differences in terms of the views on the segmentation and the geometry parameters of the Jiuzhaigou earthquake fault.In this study,considering the fault rupture characteristics in Long et al.[23]from the relocation of 2842M
≥1.0 Jiuzhaigou earthquake sequences,the focal mechanism solution and centroid depth of 32M
≥3.5 events,coseismic fault geometry is constructed by combining interferometric synthetic aperture radar (InSAR) deformation field and aftershock distribution.Then,the coseismic fault slip distribution is determined based on the elastic half-space dislocation model.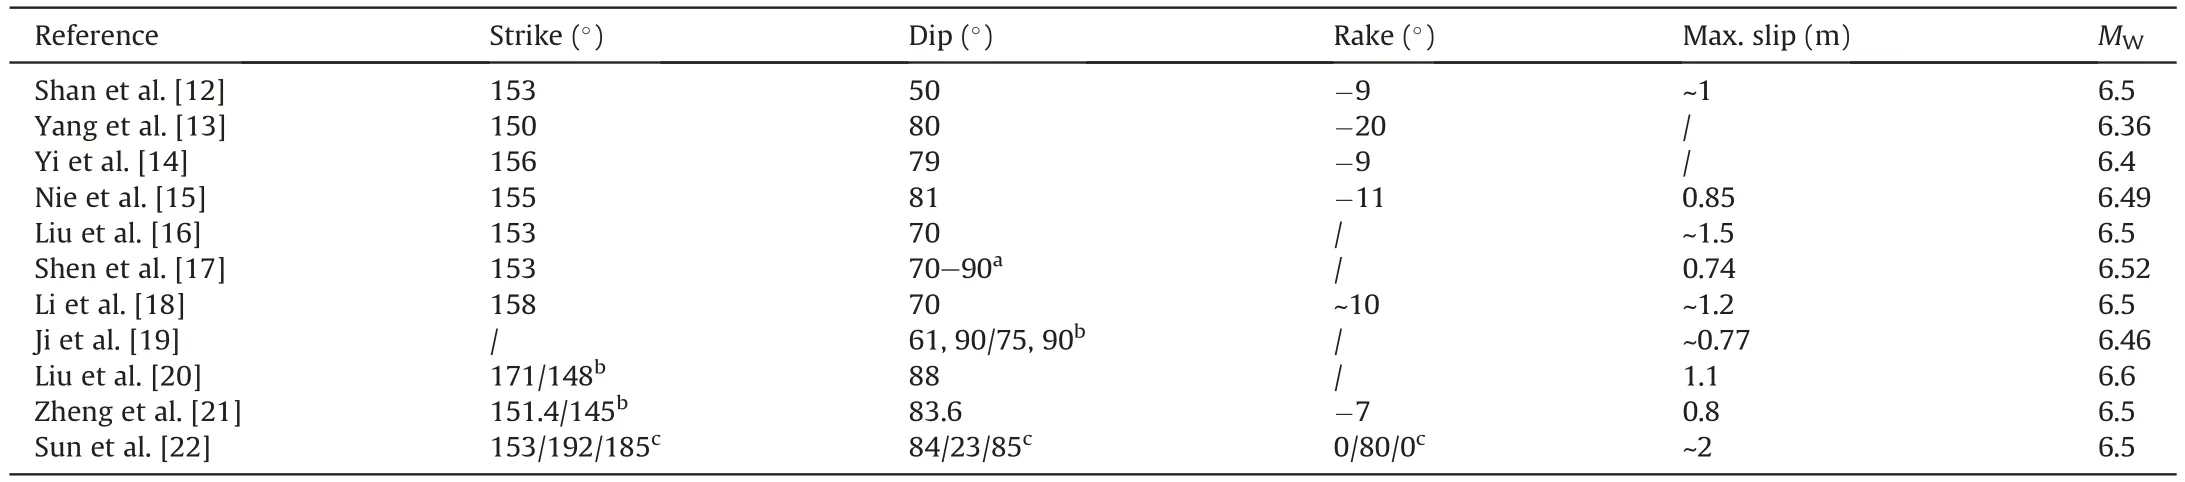
Table 1 Focal parameters of the 2017 MW 6.5 Jiuzhaigou earthquake.
TheM
6.5 Jiuzhaigou earthquake occurred at the intersection of the eastern end of the east Kunlun fault belt and the Minshan uplift zone(Fig.1).The east Kunlun fault belt is an important largescale fault zone with deformation absorption and transfer in the Qinghai-Tibet Plateau [8,24,25].The left-lateral slip rate generally decreases from west to east;it ranges from 10-12 mm/y in the west and middle sections to 1.4-3.2 mm/y in the eastern Tazang section[6].Besides inelastic behavior,around the eastern region,the deformation is absorbed and transferred by the regional faults,such as the Tazang,Minjiang,Huya,Xueshanliangzi,and the Jiuzhaigou earthquake faults.Since the late Quaternary,the Huya fault has exhibited strong tectonic activity and complex motion characteristics [6,7,10,11].Combining with the rupture characteristics of theM
6.5 Jiuzhaigou earthquake fault,previous studies concluded that the strike-slip movement of the regional faults(the Huya and the Jiuzhaigou earthquake faults)decreases gradually from north to south and is transformed into thrust movement [6,7].However,there continues to be a lack of quantitative calculation analysis relating to these fault slip characteristics.This study tries to adopt the boundary element method to calculate the regional fault slip pattern quantitatively and then investigates its reason.In this study,the coseismic deformation field of theM
6.5 Jiuzhaigou earthquake with different viewing geometries is extracted using Sentinel-1 synthetic aperture radar(SAR)images acquired by ascending and descending orbits and the differential InSAR technique.The coseismic fault model is investigated with InSAR coseismic deformation field,aftershock distribution,and elastic halfspace dislocation model.The regional fault slip pattern is then quantitatively examined using the boundary element method.Finally,the rupture characteristics of theM
6.5 Jiuzhaigou earthquake and the reason for the regional fault slip pattern are discussed.2.Spatial distribution of regional earthquake and InSAR coseismic deformation field
2.1.Spatial distribution of regional earthquake
The area around the 2017M
6.5 Jiuzhaigou earthquake consists mainly of the Tazang,Minjiang,north Huya,Xueshanliangzi,and the Jiuzhaigou earthquake faults (Figs.1 and 2).These faults have influenced and controlled regional earthquake intensity,frequency,and distribution,creating different earthquake zones.The 2017M
6.5 Jiuzhaigou earthquake fault is located between the Tazang and north Huya faults,with a strike of approximately 150-160[6,7].Historically,many earthquakes were recorded in and around theM
6.5 Jiuzhaigou earthquake area [26,27].Fig.2 shows the spatial distribution of regional earthquakes withM
≥2 that occurred before and after theM
6.5 Jiuzhaigou earthquake.The corresponding time periods are from January 1,1900,to before August 8,2017,M
6.5 Jiuzhaigou earthquake,from after August 8,2017,M
6.5 Jiuzhaigou earthquake to August 7,2018,respectively.Based on Fig.2,the spatial distribution of regional earthquakes along the overall strike direction of the north Huya and the Jiuzhaigou earthquakefaultsmay beroughly dividedintotwo zones(Zones1 and 2 in Fig.2).Before theM
6.5 Jiuzhaigou earthquake,the seismicity in Zone 1 was relatively weak,with most earthquakes with a magnitude of 2 ≤M
<3 (Fig.2(a)).The seismicity in Zone 2 was relatively frequent,including someM
≥5 earthquakes(Fig.2(a)).After theM
6.5 Jiuzhaigou earthquake,the seismicity was concentrated around theM
6.5 Jiuzhaigou earthquake fault in Zone 1 (Fig.2(b)).The seismicity in Zone 2 was relatively weak,with almost noM
≥3 earthquake recorded(Fig.2(b)).The different distributions of earthquake intensity and frequency show that regional faults possess significant segmentation characteristics,introducing different impacts on the preparation and occurrence of regional earthquakes.A comparison of the spatial distribution of regional earthquakes and active faults shows no proven fault trace around theM
6.5 Jiuzhaigou earthquake epicenter.This indicates that the rupture fault of theM
6.5 Jiuzhaigou earthquake may be a blind or new fault [7,22],which strikes in an overall NNW-SSE trend,with the northwest and southeast ends almost connected to the Tazang and north Huya faults,respectively(Fig.2).2.2.InSAR data processing and coseismic deformation field
The coseismic deformation field of theM
6.5 Jiuzhaigou earthquake with different viewing geometries is obtained using the European Space Agency (ESA) Sentinel-1 SAR images acquired by ascending and descending orbits.According to the coverage and time-space baseline,images from ascending tracks T128,T055,and descending track T062 with different azimuths and incidences are selected for interferometry,with the perpendicular baselines of 35.7,4.8,and -94.1 m,respectively(Fig.1;Table 2).Differential InSAR processing is carried out on ascending and descending SAR images using GAMMA software[28].The precision orbit from the ESA and the 30 m resolution Shuttle Radar Topography Mission (SRTM) digital elevation model (DEM) [29] are adopted to estimate and remove the topography phase.The power spectrum filter technique[30]is used to filter the interferogram to improve the signal-to-noise ratio(SNR),and the branch cut method[31] is used to unwrap the phase.The high-precision InSAR coseismic deformation field of theM
6.5 Jiuzhaigou earthquake is obtained after geocoding to the geographic coordinate system(Fig.3).The positive and negative values indicate uplift and subsidence along the line-of-sight (LOS) direction,respectively.Fig.3(a)shows the ascending T128 InSAR coseismic deformation field,exhibiting an overall NNW-SSE trend.The deformation on the southwest side of the fault is more significant,mainly subsiding along the LOS direction,while the deformation on the northeast side is relatively insignificant.The maximum subsidence and uplift along the LOS direction are -20.1 cm and 5.8 cm.Fig.3(b) shows the ascending T055 InSAR coseismic deformation field;its deformation pattern is similar to that in Fig.3(a),although there is a relatively large absent deformation zone around the epicenter.Fig.3(c)shows the descending T062 InSAR coseismic deformation field,displaying an overall NNW-SSE trend.However,the southwest side of the fault is mainly uplifted along the LOS direction.The maximum subsidence and uplift along the LOS direction are-7.4 cm and 13.6 cm.There are significant differences on both sides of the fault in the ascending and descending observations;this is mainly related to the different viewing geometries of SAR observations (Table 2) and the surface deformation characteristics of earthquake[12].

Table 2 Parameters of interferometric pairs used in this study.
Both ascending and descending observations exhibit an overall NNW-SSE trend,indicating that the Jiuzhaigou earthquake fault generally strikes in the NNW-SSE direction.The main area of subsidence along the LOS direction in the ascending observation almost spatially coincides with the main area of uplift along the LOS direction in the descending observation.The signs of the ascending and descending observations in the same area are the opposite,indicating that the motion characteristic of the earthquake fault is mainly strike-slip.
3.Coseismic fault geometry and slip distribution of the Jiuzhaigou earthquake
3.1.Coseismic fault geometry
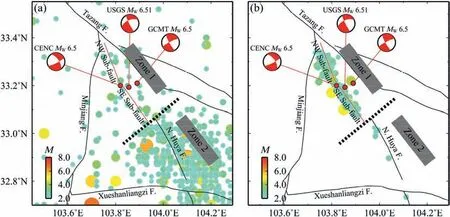
Fig.2.Spatial distribution of regional earthquakes with M ≥2 occurred before(a)and after(b)the MW 6.5 Jiuzhaigou earthquake.The corresponding time periods are from January 1,1900,to before August 8,2017,MW 6.5 Jiuzhaigou earthquake,from after August 8,2017,MW 6.5 Jiuzhaigou earthquake to August 7,2018,respectively.These earthquake records are from the Division of Earthquake Monitoring and Prediction(DEMP)[26,27].The black solid lines represent the active fault[4].The solid red line denotes the surface trace of the two-segment fault model (NW and SE sub-faults) of the MW 6.5 Jiuzhaigou earthquake used in this study.The spatial distribution of regional earthquakes along the overall strike direction of the north Huya and the Jiuzhaigou earthquake faults may be roughly divided by black dashed lines into two zones (Zones 1 and 2).

Fig.3.InSAR coseismic deformation field,(a)for ascending track T128;(b)for ascending track T055;(c)for descending track T062.The solid red line denotes the surface trace of the two-segment fault model(NW and SE sub-faults)of the MW 6.5 Jiuzhaigou earthquake used in this study.Black circles(marked as C1 and C2)in(a)and(c)highlight the significant deformation change from southwest to northeast in the areas.
The coseismic fault geometry and slip distribution of theM
6.5 Jiuzhaigou earthquake are investigated using the elastic halfspace dislocation model[32].When utilizing surface deformation observation to invert the coseismic fault model,it is common practice to linearly invert the slip distribution after determining fault geometry [33,34].If there are sufficient near-field deformation observations,the fault geometry may be determined by nonlinear inversion.If there are insufficient near-field observations,the fault geometry needs to be determined using alternative observations or prior results.In this study,the fault geometry of theM
6.5 Jiuzhaigou earthquake is constructed by combining theM
≥ 2 aftershock distribution(Fig.2(b)),ascending and descending InSAR coseismic deformation fields (Fig.3),and the earthquake fault characteristics from Long et al.[23].TheM
≥2 aftershock distribution (Zone 1 in Fig.2(b)) shows that the aftershock sequence is largely distributed in the NNW-SSE direction,and the overall long axis direction shows a northward deflection trend from the southeast to northwest.The spatial distribution may be described as two parts with theM
6.5 Jiuzhaigou earthquake epicenter as the approximate boundary.Therefore,a two-segment fault model (NW and SE sub-faults) is used to construct the earthquake fault geometry;this is consistent with segmentation characteristics demonstrated by theM
≥1.0 aftershock distribution [23].The ascending and descending InSAR observations(Fig.3)show the presence of a transition zone trending nearly NNW-SSE in the deformation field,with different magnitudes and distributions on both sides;this is consistent with the overall long axis direction of the aftershock distribution (Fig.2(b)).In particular,the T128 and T062 observations show the significant change from southwest to northeast in the area marked as C1(Fig.3(a)and(c)),and the T062 observation also highlights the significant change from southwest to northeast in the area marked as C2 (Fig.3(c)).Based on these spatial characteristics of deformation and aftershock,the locations of the two sub-faults are then determined according to a series of inversion experiments.During the inversion experiments,the locations of the two sub-faults with different values are used to do the slip distribution inversion,and the preferred locations are selected when the fitting of observations is reasonable.As a result,the strikes of the NW and SE sub-faults are 162.1and 149.3,and their lengths are 18 and 24 km,respectively(Figs.2 and 3;Table 3).The two sub-faults are connected near the epicenter,and their strikes are close to those reported in Long et al.[23].Based on the relocation of 2842M
≥1.0 Jiuzhaigou earthquake sequences from August 8 to October 31,2017,and the focal mechanism solution and centroid depth of 32M
≥3.5 events,Long et al.[23]deduced that the overall strike and dip of regional faults on the north side of the mainshock epicenter were~159and~59,respectively,and those of the mainshock and its southern regional faults were~150and~75,respectively.Following the determination of the fault location,the dips of the NW and SE sub-faults are fixed as 59and 75by referring to Long et al.[23].The main reasons for this are as follows:(1) previous studies used InSAR observation alone or in combination with other observations to investigate the dips of the earthquake fault,and indicated that the preferred dips varied widely,ranging from 50to 90(Table 1).However,Long et al.[23] could better constrain the dips due to using more seismic data recorded by the regional seismic network;(2) based on the fault geometry with the dips of the NW and SE sub-faults from Long et al.[23],the fault slip distribution model determined in this study can better fit the InSAR observations(Section 3.2).The NW and SE sub-faults are both set as 24 km wide along the dip,and are discretized into 1.5 × 1.5 km elements for subsequent slip distribution inversion (Section 3.2).
3.2.Coseismic fault slip distribution
In the slip distribution inversion,the quadtree decomposition algorithm[35]is used to resample the coseismic deformation field(Fig.3) to improve inversion efficiency and preserve the deformation characteristic.The numbers of resampled data pints for ascending tracks T128,T055,and descending track T062 observations are 612,463,and 740,respectively.To avoid the oscillation of the slip distribution of adjacent elements,the second-order Laplacian smoothing factor is used to smooth the slip on adjacent elements.The smoothing factor is selected using the trade-off curve between the fitting residual and slip roughness[33,34];this factor is 300.To account for the influence of InSAR observation errors,such as orbit residual and the starting point of the phase unwrapping,three bilinear functions (one for each track observation) are added into the inversion model to reduce the influence of errors on the slip distribution solution.With the fault geometry described in Section 3.1,the dip-and strike-slip components are constrained as non-negative,and the rake angle is confined to between-45and 45;the non-negative least square method [36] is used to determine the fault slip distribution.
Fig.4(a) and Table 3 show the fault slip distribution and the related statistical results.Overall,the fault slip is dominated by a left-lateral strike-slip movement,with an average rake of -2.31for the entire fault and 0.65and -4.50for the NW and SE subfaults,respectively.Fault slip mainly occurs at a depth of 0-13.04 km and features two peak slip zones,which are located at the NW and SE sub-faults,respectively.The maximum slip is 1.39 m,located at 4.35-5.80 km depth.This depth range is close to the focal centroid depth of 5 km[14].The total seismic moment for the slip distribution model is 6.34 × 10N·m,and the moment magnitude isM
6.47,which agrees with most previous results(Table 1).The seismic moments for the NW and SE sub-faults are 2.71 × 10and 3.63 × 10N·m and the corresponding moment magnitudes areM
6.23 andM
6.31,respectively.
Fig.4.(a) Coseismic fault slip distribution and (b) the related error.Red star in (a)represents the relocated epicenter of the 2017 MW 6.5 Jiuzhaigou earthquake from Long et al.[23].Green arrows in(a) show the slip direction of the corresponding fault element.

Table 3 Statistical results for coseismic fault geometry and slip distribution.
Fig.4(b) shows the coseismic slip distribution error calculated using the Monte Carlo method [37].The magnitude of the error is significantly smaller than that of the fault slip distribution,with an average of 0.03 m;this indicates that the slip distribution in Fig.4(a) is relatively reliable.Fig.5 shows the fitting and residual deformation fields based on the fault slip distribution model.The characteristics and magnitude of the fitting deformation field are consistent with the observations (Fig.3).The overall root mean square (RMS) misfit for all three datasets is 1.14 cm,and the individual RMS misfits for T128,T055 and T062 observations are 1.32,1.16 and 0.92 cm,respectively.There is some residual deformation around the near-fault and far-field areas,exhibiting overall randomness.This residual may be related to the simplification of the fault geometry model,atmospheric delay noise,and additional deformation caused by aftershocks and post-seismic processes[12,19,37,38].
4.Boundary element calculation of the regional fault slip pattern
The geometric structures of theM
6.5 Jiuzhaigou earthquake fault and its southern Huya fault are complex[8,9],possibly leading to different fault slip patterns.The fault strike changes from NNW-SSE to nearly NS direction,and the dip gradually decreases from north to south [4,6,7].Based on these geometric characteristics,the boundary element modeling program 3D-DEF[39]is used to calculate the fault slip pattern with different geometries under the regional background stress field.During the calculation process,the regional stress field is determined according to the regional strain field.Young's modulus and Poisson's ratios are 7.0 × 10Pa and 0.25,respectively.The directions of the maximum principal tensile and compressive strain rate are N18.3E and S71.7E,with values of 7.5 and-11.9 nstrain/y,respectively [40].This study mainly analyses the average rake under the regional stress field,where results obtained using the strain rate field,and strain field are consistent.Based on the characteristics of regional faults,the fault length and width are set as 40,and 24 km,respectively,and the average rake is calculated with different strikes and dips.The strike ranges from 135to 180with 5increments,and the dip ranges from 45to 90with the same increment.After a series of calculations,the changing diagram of the average rake with different strikes and dips is obtained(Fig.6).
Fig.6 demonstrates that when the dip is fixed (less than 90),the average rake changes from negative to positive,with strike increasing from 135to 180.When the strike is fixed,the average rake gradually approaches 0with a dip increasing from 45to 90;this means that the dip-slip component gradually weakens.According to Fig.6,under the regional stress field,if the strike and dip are consistent with the Jiuzhaigou earthquake fault with a strike of approximately 155and dip of approximately 70,the average rake is estimated to be about 7.If the strike and dip are consistent with the north Huya fault with a strike of approximately 160and dip of approximately 60[4,7],the average rake is estimated to be about 16.Lastly,if the strike and dip are consistent with the south Huya fault with a strike of approximately 170and dip of approximately 50[4,6],the average rake is estimated to be about 34.These boundary element calculations demonstrate that under the regional stress field,the regional fault slip pattern exhibits specific characteristics.The strike-slip component decreases,and the thrust component increases relatively from the Jiuzhaigou earthquake fault in the north to the Huya fault in the south.It should be noted that the regional fault slip pattern refers to the overall slip pattern of the regional faults(the Jiuzhaigou earthquake fault in the north,the north and south Huya faults in the south),rather than the detailed slip distribution of any of them.
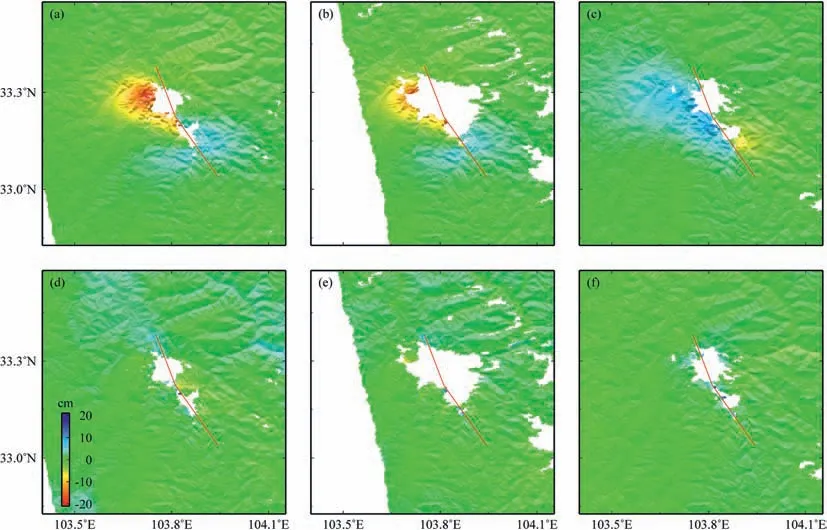
Fig.5.Fitting(top)and residual(bottom)deformation fields based on the fault slip distribution model.(a)and(d)for ascending track T128;(b)and(e)for ascending track T055;(c)and(f)for descending track T062.The solid red line denotes the surface trace of the two-segment fault model(NW and SE sub-faults)of the MW 6.5 Jiuzhaigou earthquake used in this study.
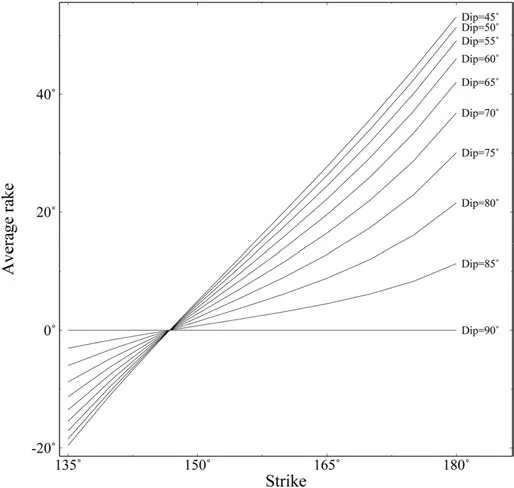
Fig.6.Changing diagram of average rake with different strikes and dips.
5.Discussion
5.1.Rupture characteristics of the Jiuzhaigou earthquake
According to the coseismic fault slip distribution(Fig.4(a)),the coseismic rupture mainly occurs in an area with a shape of approximately an inverted triangle,with a maximum value of 1.39 m.The shape of the approximately inverted triangle is similar to that in Li et al.[18].The maximum value of 1.39 m is less than that of~1.5 m,~2 m reported by Liu et al.[16] and Sun et al.[22],whilst greater than that of~1 m,0.85 m,0.74 m,~0.77 m and 0.8 m reported by Shan et al.[12],Nie et al.[15],Shen et al.[17],Ji et al.[19],and Zheng et al.[21].The coseismic rupture is relatively small near the surface and almost disappears below 13.04 km underground.This study also inverts the fault slip distribution model with other sizes of the discretized fault element,such as 1×1 km and 2 × 2 km,and other smoothing factors,such as 275 and 325(Fig.7).The inversion results show a similar slip distribution pattern to that demonstrated in Fig.4(a),although there exist some numerical differences.In particular,the maximum values are 1.27 m,1.54 m,1.43 m,and 1.36 m,respectively,which are different from that in Fig.4(a).
Fig.4(a) depicts the relocated epicenter of the 2017M
6.5 Jiuzhaigou earthquake from Long et al.[23] to display its spatial relationship with coseismic slip distribution.Using the tomoDD method,Long et al.[23] relocated 2842M
≥ 1.0 Jiuzhaigou earthquake sequences from August 8 to October 31,2017,with relative location errors of 0.32 km and 0.52 km in the horizontal and vertical directions.The location of theM
6.5 mainshock epicenter is at(103.816E,33.204N),and its focal depth is 12.5 km.It can be found that the 2017M
6.5 Jiuzhaigou earthquake yields a bilateral rupture pattern.The rupture starts at a depth of approximately 12.5 km on the northwest end of the SE sub-fault,and propagates to both sides and updip direction.The coseismic fault slip distribution model indicates that the 2017M
6.5 Jiuzhaigou earthquake has a left-lateral strike-slip focal mechanism,consistent with most previous seismological and geodetic studies(Table 1).However,the fault rupture characteristic of the Jiuzhaigou earthquake is different from that of the 1973-1976 Songpan strong earthquake sequence occurred at the Huya fault,which is on the south side of the Jiuzhaigou earthquake fault.The reason for this is discussed in Section 5.2.5.2.Reason for the regional fault slip pattern
The boundary element calculation of the regional fault slip pattern in Section 4 shows that under the regional stress field,the strike-slip component decreases,and the thrust component increases relatively from the Jiuzhaigou earthquake fault in the north to the Huya fault in the south.This result agrees with the kinematic characteristics of the regional faults and the focal mechanism properties of the strong regional earthquakes[6,7,10-12,16-18,20-22].
Researches on the kinematic characteristics of the regional faults show that the regional faults are characterized by the strikeslip movement gradually decreasing from north to south and being transformed into thrust movement[6,7].This is consistent with the result of the boundary element calculation in this study.Researches on the focal mechanism properties of the strong regional earthquakes demonstrate that the rake of the focal mechanism generally increases from the Jiuzhaigou earthquake in the north to the 1973-1976 Songpan strong earthquake sequence in the south[10-12,16-18,20-22].The 2017M
6.5 Jiuzhaigou earthquake has a focal mechanism with a rake of~0(Section 3.2)[12,16-18,20-22].The 1973M
6.5 Songpan earthquake in the north Huya fault has a focal mechanism with a rake of 5(Fig.1)[10,11].Both two 1976M
7.2 Songpan earthquakes in the south Huya fault have a focal mechanism with a rake of 40(Fig.1)[10,11].The focal mechanism of the strong regional earthquakes indicates that,during the coseismic rupture,the strike-slip component decreases,and the dip-slip component increases relatively from north to south.This is also consistent with the result of the boundary element calculation in this study,although there are some numerical differences in the rake between the focal mechanism solution and the boundary element calculation.These consistencies indicate the rationality and effectiveness of the boundary element calculation in this study.Note that the 1976M
6.7 Songpan earthquake in the south Huya fault has a focal mechanism with a rake of 90and a strike of 215[10,11].The strike is significantly different from that of the main regional faults.Therefore,it may be an exceptional event with a rake of 90and it is unsuited for the analysis here.According to the consistency given above,this study quantitatively concludes that the main reason for the complex regional fault slip pattern may be that the strike changes from NNW-SSE to nearly NS direction,and the dip gradually decreases from the Jiuzhaigou earthquake fault in the north to the Huya fault in the south.Besides,the variation of fault geometry parameters(such as,strike,dip)affecting the fault slip pattern has been observed in the studies of other earthquakes occurring in the Qinghai-Tibet Plateau,such as the 2008 WenchuanM
7.9 and the 2009 QaidamM
6.3 earthquakes [37,41,42].
Fig.7.Coseismic fault slip distribution derived with different inversion parameters.(a) and (b) for the sizes of the discretized fault element being 1 × 1 km and 2 × 2 km,respectively;(c)and(d)for the smoothing factors being 275 and 325,respectively.During the inversion of slip distribution in(a)-(d),the other inversion parameters are the same as those used for deriving the coseismic fault slip distribution in Section 3.The red star represents the relocated epicenter of the 2017 MW 6.5 Jiuzhaigou earthquake from Long et al.[23].The green arrows show the slip direction of the corresponding fault element.
The east Kunlun fault belt is an important left-lateral strike-slip fault zone that absorbs and transfers the deformation resulting from the eastward compressive movement of the Bayan Har block[8,24,25].In the northeast margin of the Bayan Har block,besides inelastic behavior,the deformation is absorbed and transferred by the Tazang,Minjiang,Huya,Xueshanliangzi,and the Jiuzhaigou earthquake faults.The Huya and the Jiuzhaigou earthquake faults strike in NNW-SSE or nearly NS direction,nearly perpendicular to the movement direction of the Bayan Har block,and dip almost to the west [7,21].Under the tectonic stress field,the left-lateral horizontal movement of the Jiuzhaigou earthquake fault is partly transformed into vertical movement and nearly EW-directed crustal shortening around the Huya fault area [6,7].With these characteristics,these two faults together form the eastern boundary of the Minshan uplift zone (Fig.1) [7,21,22] and accommodate the accumulated deformation in the region.
6.Conclusions
In this study,ascending and descending Sentinel-1 SAR images,aftershock distribution,and elastic half-space dislocation model are jointly used to investigate the coseismic deformation field,fault model of the 2017M
6.5 Jiuzhaigou earthquake.The boundary element method is then used to quantitatively study the regional fault slip pattern.The main conclusions are as follows:Both ascending and descending InSAR coseismic deformation fields display an overall NNW-SSE trend.The deformation on the southwest side of the fault is significant,whilst the deformation on the northeast side is relatively insignificant.The deformation pattern indicates that the Jiuzhaigou earthquake fault generally strikes in the NNW-SSE direction.The main area of subsidence along the LOS direction in the ascending observation almost spatially coincides with the main area of uplift along the LOS direction in the descending observation,indicating that the motion characteristic of the earthquake fault is mainly strike-slip.
The 2017M
6.5 Jiuzhaigou earthquake has a left-lateral strikeslip focal mechanism.The coseismic fault geometry is divided into NW and SE sub-faults with strikes of 162.1and 149.3,respectively.The coseismic fault slip mainly occurs at a depth of 0-13.04 km with a shape of an approximately inverted triangle and an average rake of -2.31.The fault slip features two peak slip zones located at the NW and SE sub-faults,respectively.The maximum slip is 1.39 m.The total seismic moment is 6.34 × 10N·m,equivalent to a moment magnitude ofM
6.47.The boundary element calculation of the regional fault slip pattern quantitatively shows that under the regional stress field,the strike-slip component decreases,and the thrust component increases relatively from the Jiuzhaigou earthquake fault in the north to the Huya fault in the south.This complex regional fault slip pattern may be mainly attributable to the changing strike and dip.The strike changes from NNW-SSE to nearly NS direction,and the dip gradually decreases from north to south.With these characteristics,the Huya and the Jiuzhaigou earthquake faults together form the eastern boundary of the Minshan uplift zone and accommodate the accumulated deformation in the region.
Conflicts of interest
The authors declare that there is no conflicts of interest.
Acknowledgments
This work was supported by the National Key Research and Development Program of China (2018YFC1503603,2016YFB0501405),the National Natural Science Foundation of China(41874011,41774011).The Sentinel-1 SAR data were provided by ESA.All figures were made using Generic Mapping Tools(GMT)software [43].
 Geodesy and Geodynamics2022年2期
- Geodesy and Geodynamics的其它文章
- Analysis of terrestrial water storage changes in the Shaan-Gan-Ning Region using GPS and GRACE/GFO
- Ocean tide loading correction for InSAR measurements:Comparison of different ocean tide models
- A review of methods for mitigating ionospheric artifacts in differential SAR interferometry
- Co-and post-seismic slip analysis of the 2017 MW7.3 Sarpol Zahab earthquake using Sentinel-1 data
- Monitoring landslide associated with reservoir impoundment using synthetic aperture radar interferometry:A case study of the Yalong reservoir
- Extraction and analysis of saline soil deformation in the Qarhan Salt Lake region (in Qinghai,China) by the sentinel SBAS-InSAR technique