Co-and post-seismic slip analysis of the 2017 MW7.3 Sarpol Zahab earthquake using Sentinel-1 data
Lejun Lu ,Yu Zhou ,*
a Guangdong Provincial Key Laboratory of Geodynamics and Geohazards,School of Earth Sciences and Engineering,Sun Yat-sen University,Zhuhai,519000,China
b Southern Marine Science and Engineering Guangdong Laboratory (Zhuhai),Zhuhai,519082,China
Keywords:2017 MW7.3 Sarpol Zahab earthquake Sentinel-1 Co-and post-seismic deformation Fault frictional properties
ABSTRACT The MW7.3 Sarpol Zahab earthquake that occurred in the Zagros Fold-Thrust Belt (ZFTB) of Iran on November 12,2017 is the largest earthquake instrumentally recorded in the region.This earthquake provides an opportunity to investigate the slip behaviour and frictional properties of the fault,which is significant for assessing future seismic potential.In this study,we use Sentinel-1 images to map the coand post-seismic deformation to invert for the fault slip.The result indicates that most of the coseismic slip is buried in the depth range of 11-17 km,and the maximum slip is about 3.8 m at a depth of 15 km.The coseismic slip induces an increase of Coulomb stress in the unruptured area of the seismogenic fault plane,driving the afterslip.Based on the stress-driven afterslip,we obtain a frictional parameter of (a -b)=(0.001 -0.002) for the updip afterslip zone and (a-b)=0.0002 for the downdip afterslip zone in the framework of rate-and-state friction.The constitutive parameter (a - b) of the fault is very small,suggesting that the fault segments are close to velocity-neutral and may experience coseismic rupture.
1.Introduction
Active faults can release tectonic stress through rapid seismic slip during earthquakes or stable aseismic creep during the interand/or post-seismic periods [1,2].The slip behaviour of a fault is primarily controlled by its frictional properties,which depend on various factors,including temperature,pressure,and rock composition [3,4].In the framework of rate-and-state friction,ratestrengthening faults (a
-b
>0,wherea
andb
are the direct velocity effect and state evolution effect parameters,respectively.)tend to resist seismic slip,whereas rate-weakening faults(a
-b
<0) prefer seismic slip [5-7].Quantifying fault frictional properties(i.e.,the constitutive parameter (a
-b
)) can significantly improve our ability of assessing seismic potential of faults,and therefore it has received attention in recent years [1].Besides laboratory measurements of the fault rock friction coefficients,another common way of exploring fault friction is to investigate the evolution of post-earthquake fault slip based on geodetic observations [1].Geodetic method has been successfully applied to the San Andreas,North Anatolian,Longitudinal Valley,Tabas and Xianshuihe faults[8-13],where large earthquakes have occurred.The 2017M
7.3 Sarpol Zahab earthquake in Iran provides an opportunity for probing the frictional properties of the seismogenic fault.Liu and Xu[14]have analysed the slip four months after the earthquake and estimated the constitutive parameter(a
-b
=10-10).In this study,we re-analyse the co-and post-seismic slip for a longer period,hoping to better constrain the fault frictional properties.The Sentinel-1 data from 2017 to 2018 are used to map the timeseries surface deformation associated with the 2017M
7.3 earthquake,based on which we invert for the fault slip one year after the mainshock.Combining the slip time-series with the rate-and-state friction laws,we re-calculate the frictional constitutive parameter(a
-b
),and discuss the impact of the parameter on fault slip behaviour.2.Study area and data
The 2017M
7.3 Sarpol Zahab thrust earthquake occurred within the Zagros Fold-Thrust Belt (ZFTB) [15,16].As shown in Fig.1,the ZFTB is part of the Zagros Mountains,which is one of the most tectonically and seismically active orogens as a result of the ongoing NS convergence between the Arabian and Eurasian plates [17,18].The major tectonic structures of the ZFTB include three blind thrust faults-the Zagros Foredeep Fault(ZFF),the High Zagros Fault(HZF),and the Mountain Front Fault(MFF),and one strike-slip fault-the Main Recent Fault(MRF)[16,19,20].The 2017 earthquake occurred on the MFF and was the strongest earthquake ever recorded by instruments in this region [16].The epicentre of the mainshock(34.911N,45.959E) is about 50 km away from the severely damaged city of Sarpol Zahab[15].According to the Iranian Seismic Center(ISC)catalogue,a total of 676 aftershocks(M
≥3),including 11 events(M
≥5),occurred from 2017/11/12 to 2018/11/14.To map the co-and post-seismic deformation fields,we use Sentinel-1A/B data from two ascending and two descending tracks(see Fig.1 for coverage).For coseismic deformation,both the preand post-earthquake Sentinel-1A/B synthetic aperture radar (SAR)images are the acquisitions closest to the earthquake in order to minimise the effect of afterslip.For postseismic deformation,we obtained all the SAR data from the first images after the mainshock to November 2018 to form the Small Baseline Subset (SBAS)network (Fig.2) [21].
3.InSAR data processing and results
3.1.Coseismic deformation
3.1.1.Coseismic interferograms
Four Sentinel-1 interferograms were generated using the GAMMA software package,one for each track.Each interferogram was multi-looked by a factor of 10 in azimuth and 2 in the range direction.We adopted the enhanced spectral diversity (ESD)method [22] to ensure that the registration accuracy is less than 0.001 pixels.The 3 arc-second Shuttle Radar Topography Mission(SRTM) Digital Elevation Model (DEM) [23] was used to simulate and remove the topographic phase.The inteferograms were unwrapped using the minimum cost flow(MCF)algorithm[24]and then geocoded to the World Geodetic System(WGS84)coordinate system.The interferograms (Fig.3) show an asymmetric pattern,indicating that the primary motion is dip slip.The maximum surface deformation is 0.8 m in the line-of-sight(LOS)direction(tracks 72 and 174),which is incredibly small for aM
7.3 earthquake,suggesting that most of the slip was buried deep.3.1.2.Inversion of slip distribution
For slip inversion,we used the Steepest Descent Method(SDM)[25,26]:

G
is the Green's function,s
is slip,d
is observation,β is the smoothing factor (set as 0.05 in this study),H
is the Laplacian operator,and τ is the stress drop.To improve the computing efficiency,the coseismic deformation field was downsampled to 5 km.The number of data points was reduced from 891,600 to 2258 for ascending track 72,from 1,501,505 to 3803 for ascending track 174,from 539,805 to 1345 for descending track 79,and from 1,031,577 to 2570 for descending track 6.In the inversion,we assigned the same weight to these four tracks with fault geometry model parameters of strike=353.5±5.0,dip=14.5±5.0,length=70 km,width=100 km[15].We calculated the Green's function for a dislocation in a uniform elastic half space [27],assuming a Poisson ratio of 0.25.The best-fitting coseismic slip distribution is shown in Fig.4.The coseismic slip is concentrated in the depth range of 11-17 km,with a maximum value of 3.8 m.The rake is around 120-150.Given a shear modulusG
of 30 GPa,the calculated geodetic moment is 9.5 × 10N·m,which corresponds aM
7.25 earthquake and is consistent with the seismic moment estimated by Liu and Xu [14].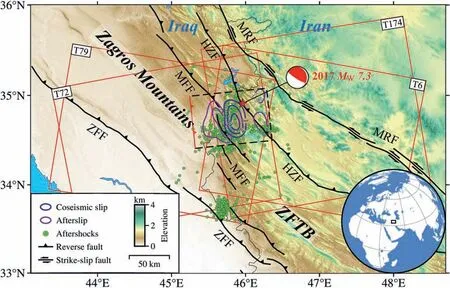
Fig.1.Tectonic setting of the Zagros Fold-Thrust Belt (ZFTB).The purple and blue contours show the distribution of coseismic slip (1 m interval) and afterslip (0.1 m interval),respectively.The red star is the epicentre of the 2017 MW7.3 Sarpol Zahab earthquake in Iran,and the green dots are MW ≥3 aftershocks between 2017/11/12 and 2018/11/14 from the Iranian Seismic Center(ISC)(http://irsc.ut.ac.ir/).The red boxes are the spatial extent of the Sentinel-1A/B data.The black lines are the active faults.MFF:Mountain Front Fault.ZFF:Zagros Foredeep Fault.HZF:High Zagros Fault.MRF:Main Recent Fault.
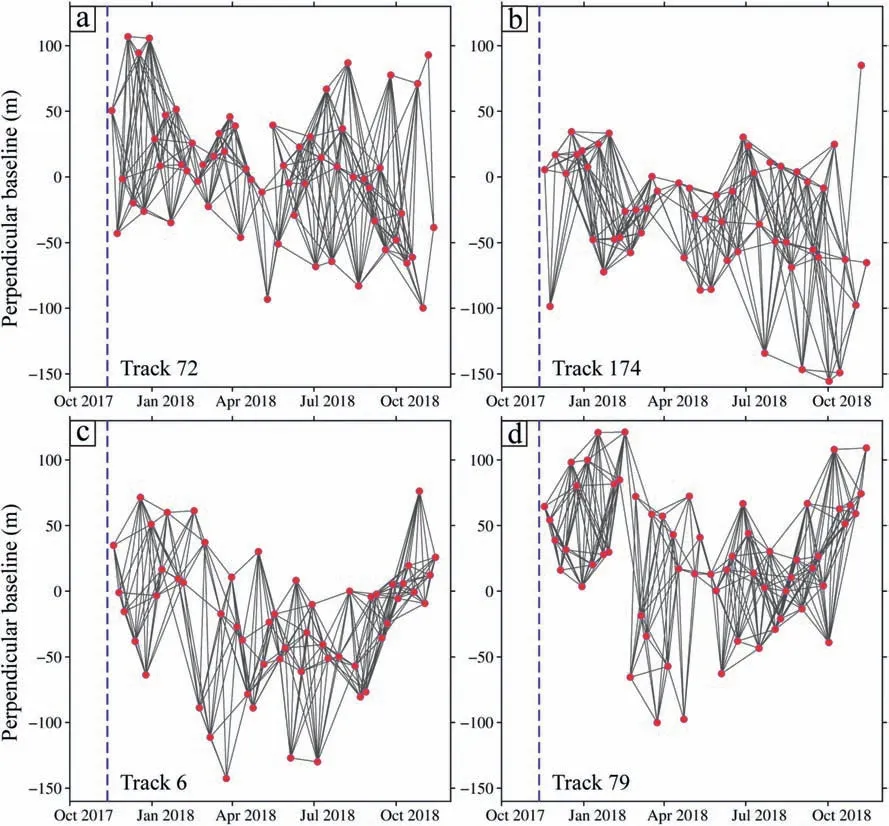
Fig.2.Baseline plots of(a)ascending track 72,(b)ascending track 174,(c)descending track 6,and(d)descending track 79.The red dots are Sentinel-1A/B images.Each black line indicates an interferogram used to estimate the mean velocities.The blue dashed line is the occurrence time of the 2017 MW7.3 Sarpol Zahab earthquake.
3.2.Postseismic deformation
3.2.1.Time-series analysis
Postseismic deformation is often small compared to coseismic deformation.To map the postseismic deformation of the 2017 earthquake,we used the SBAS time-series method.Interferograms were first generated using the GAMMA software package and formed networks as shown in Fig.2,in which the temporal baseline was set to be ≤30 days and the perpendicular baseline was set to be≤200 m.We selected 322 interferograms from track 72,298 interferograms from track 174,324 interferograms from track 79,and 290 interferograms from track 6 for the subsequent time-series analysis,which was performed using the Miami InSAR timeseries software in Python (MintPy) [28].The ECMWF Reanalysis v5 (ERA5) data were used to reduce the atmospheric signals.The cumulative surface deformation one year after the earthquake is shown in Fig.5(a),(d),(g) and (j).To invert the time-series postseismic slip,we divided the deformation fields from four tracks into 49 groups.Each group contains one deformation field from each track,and the time interval between any two deformation fields in each group is less than three days.
Comparing the co-(Fig.3)and post-seismic(Fig.5)deformation fields,we found that the asymmetric deformation patterns are similar,implying that the postseismic motion has a similar sense as the coseismic motion.Nevertheless,the postseismic deformation centre moves westward,i.e.,towards the surface fault trace.
3.2.2.Kinematic postseismic slip model
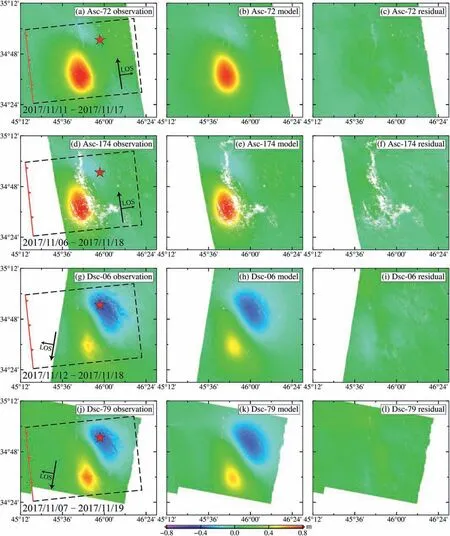
Fig.3.Coseismic line-of-sight (LOS) displacement fields for the 2017 MW7.3 Sarpol Zahab earthquake from Sentinel-1A/B interferograms.(a-c) are the observed coseismic LOS displacement from track 72 (observation),predicted coseismic LOS displacement from the best-fitting model (model),and residuals between the observation and the model,respectively.(d-f),(g-i),and (j-l) are the same as (a-c),but for track 174,track 6,and track 79,respectively.
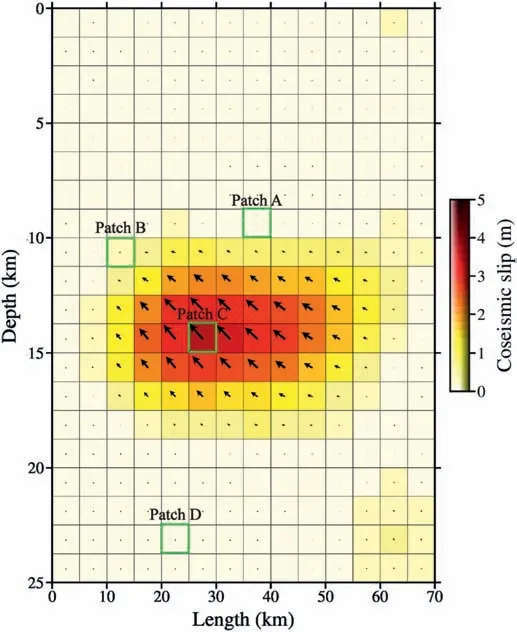
Fig.4.Coseismic slip distribution.Patches A (maximum cumulative afterslip),B(medium cumulative afterslip),C(maximum coseismic slip),and D(deep afterslip)are selected for detailed analysis.
To solve for the postseismic slip on the fault plane,we used the same inversion method as mentioned in Section 3.1.2.We divided the fault plane into 280 grids with a size of 5 km×5 km,extending from the surface to a depth of 25 km.The rake angle was constrained to be ranging from 90to 180and the afterslip was limited to be smaller than 10 m.The deformation fields from the four tracks were jointly inverted to obtain the best-fitting postseismic slip model(Fig.6).Fig.5 shows the observed and modeled surface deformation fields for each track.The observations are in fairly good agreement with the model.The postseismic slip occurred on both the updip and downdip of the coseismic rupture(Fig.6).To obtain the evolution of postseismic slip,we inverted each group individually without any temporal smoothing or prescribed functional form.
Based on the afterslip model,we calculated the postseismic geodetic moment(2.5×10N ·m),which corresponds to 26 % of the coseismic moment,consistent with Wang and Bürgmann[29].About 70 % of the moment release occurred in the shallow region above the coseismic rupture.Combining with the westward movement of the postseismic deformation centre(Fig.5),we infer that the postseismic deformation field is dominated by shallow afterslip.
4.Discussion
4.1.Coulomb failure stress change induced by the 2017 Sarpol Zahab earthquake
Postseismic slip is usually driven by Coulomb stress changes induced by the mainshock [30-32].To test whether the observed postseismic deformation following the 2017 Sarpol Zahab earthquake is stress-driven afterslip or induced by other mechanisms such as viscoelastic relaxation,we calculated the Coulomb failure stress changes (ΔCFS
) on the fault plane [31]:
CFS
promotes the subsequent afterslip and aftershocks,while negative ΔCFS
reduces this tendency [34-36].Using the coseismic slip model in Fig.4,we computed the Coulomb stress change on the receiver fault with Coulomb3.3[37].As shown in Fig.7,the epicentral area (about 11-17 km at depth)has negative ΔCFS
,and the patches above the epicentre (about 9-11 km at depth) have positive ΔCFS
with an average value of 0.5 MPa.Despite the relatively poor earthquake relocation,most of the aftershocks within a year after the 2017 earthquake occurred in the unruptured area around the coseismic slip zone(Fig.7).This is expected because of the stress increase in both updip and downdip of the coseismic rupture.The distributions of afterslip,positive ΔCFS
,and aftershocks are consistent,suggesting that the driving mechanism of aftershocks is the coseismic stress increase and afterslip processes.4.2.Frictional properties of the Mountain Front Fault
Based on the evolution of afterslip,we can analyse the frictional properties of the fault.In the framework of rate-and-state friction,the afterslipS
(t
)can be determined by a logarithmic function[38,39]:
V
is the initial rate after the mainshock,V
is the steady creep rate in the preseismic period,t
is the characteristic relaxation time,andV
t
,also known as α,is the characteristic length scale:

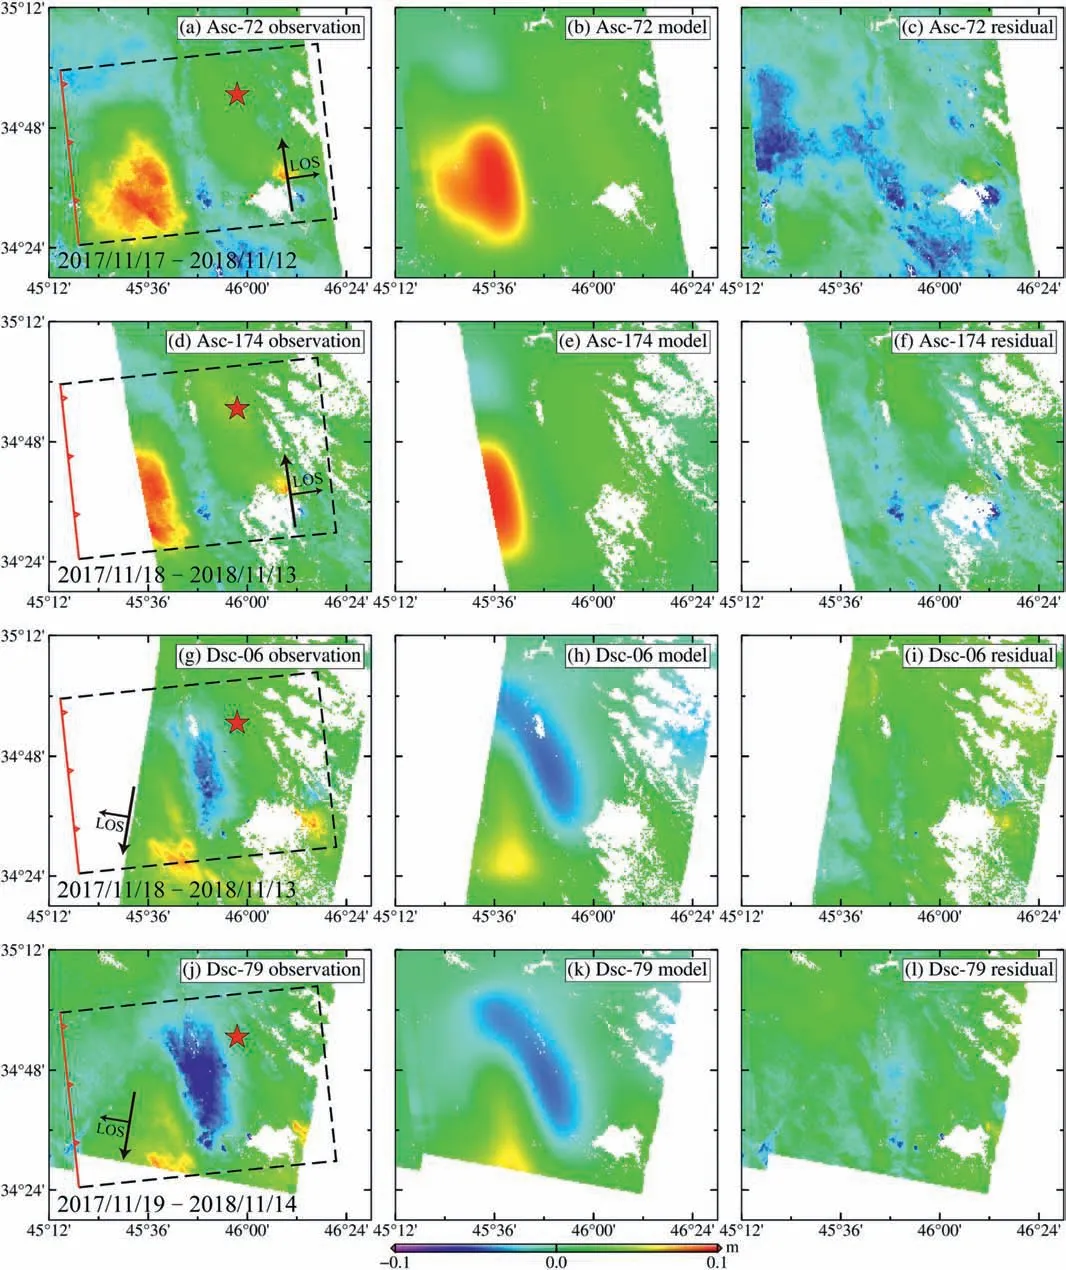
Fig.5.Cumulative postseismic LOS displacement fields (2017/11/17-2018/11/14) from Sentinel-1A/B interferograms.(a-c) are the observed postseismic LOS displacement from track 72 (observation),predicted postseismic LOS displacement from the best-fitting model (model),and residuals between the observation and the model.(d-f),(g-i),and (j-l)are the same as (a-c),but for track 174,track 6,and track 79,respectively.
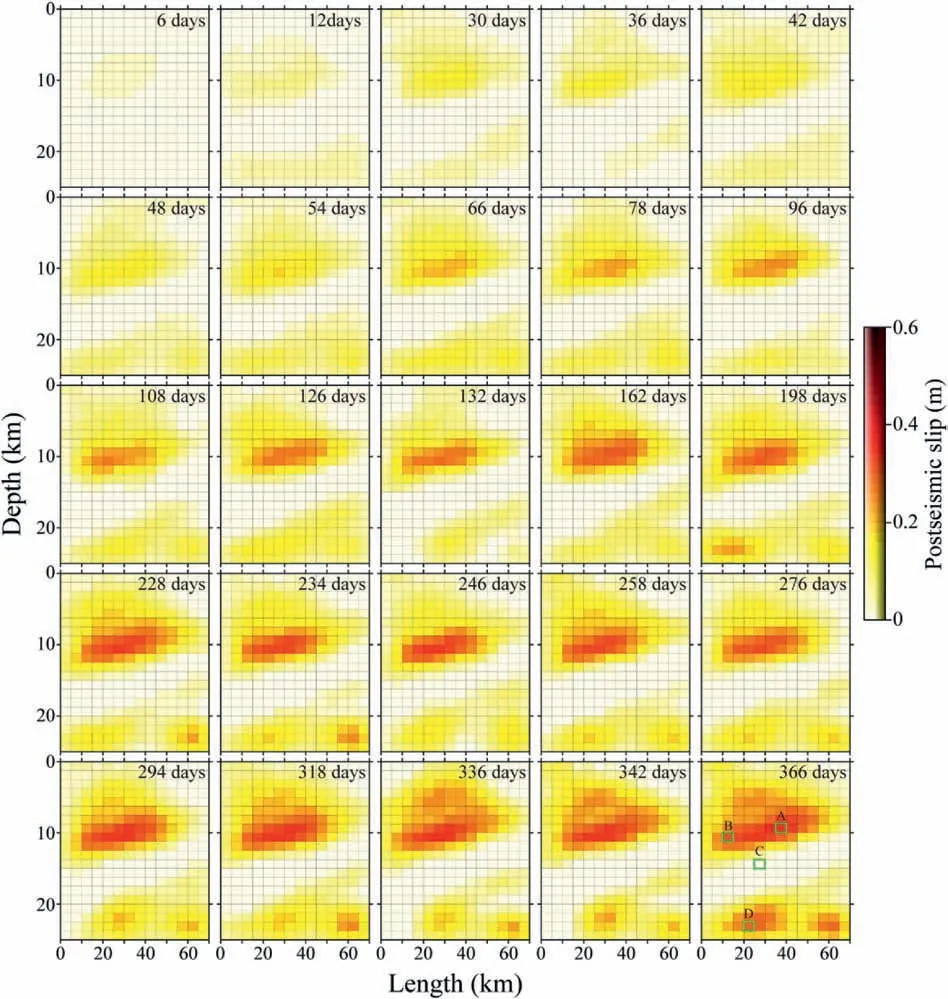
Fig.6.Spatiotemporal evolution of postseismic slip.The green boxes mark the maximum cumulative postseismic slip(Patch A),the medium cumulative postseismic slip(Patch B),the maximum coseismic slip (Patch C),and the maximum deep postseismic slip (Patch D).

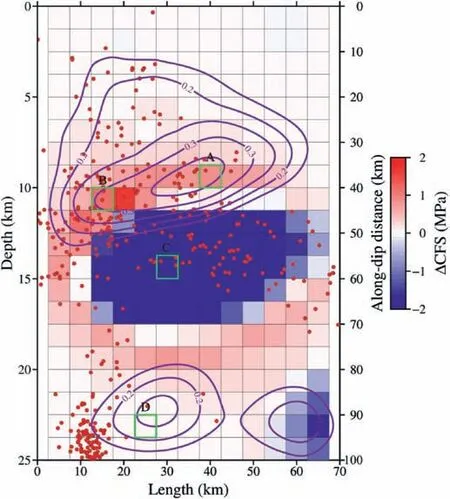
Fig.7.Coulomb stress changes induced by the 2017 MW7.3 Sarpol Zahab earthquake.The green dots are the projections of MW ≥3 aftershocks within a year after the 2017 earthquake(from ISC),the purple contours indicate the distribution of postseismic slip,and the green boxes are the patches labelled in Figs.4 and 6.
We found that(a
-b
)of Patches A and B is larger than that of Patch D.It is likely that the updip region is more ratestrengthening than the downdip region,so the maximum afterslip is larger (0.4 m versus 0.2 m),and the moment released by shallow afterslip is greater than that released by deep afterslip.5.Conclusions
We investigated the co-and post-seismic deformation of theM
7.3 Sarpol Zahab earthquake in Iran using Sentinel-1A/B data.The distribution of coseismic slip shows that the slip is buried at a depth range of 11-17 km,with a maximum slip of 3.8 m.Based on the postseismic InSAR observations,we modelled the spatiotemporal evolution of afterslip and found that most of the afterslip occurred in both the updip and downdip regions of the coseismic rupture.In the framework of rate-and-state friction,we analysed the frictional properties of four representative fault patches,namely A:maximum cumulative afterslip,B:medium cumulative afterslip,C:maximum coseismic slip,and D:maximum cumulative deep afterslip.Patches A,B,and D show time-decaying afterslip rate,and their inferred frictional parameters (a
-b
) are 0.0015,0.0012,and 0.0002,respectively,indicating heterogeneous frictional properties on the fault plane.Patch C does not show evident afterslip,indicating a negative(a
-b
),i.e.,rate-weakening.The constitutive parameter (a
-b
) of the fault is very small,suggesting that the fault segments are close to velocity-neutral and may experience coseismic rupture.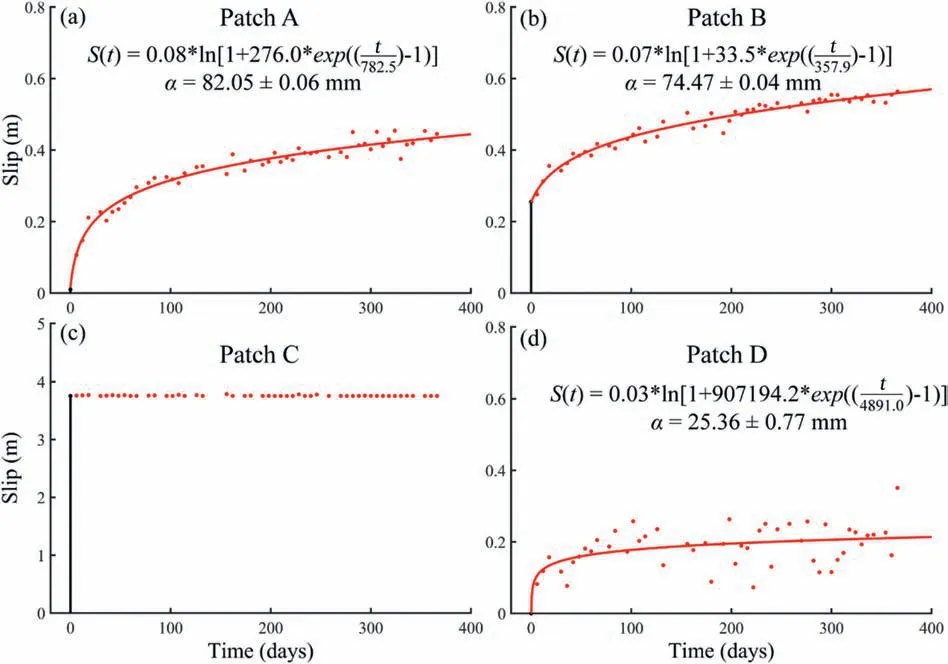
Fig.8.Temporal evolution of slip for patches labelled in Fig.4.The red dots are the measurements of afterslip.The black and red lines indicate the coseismic slip and modeled afterslip,respectively.
Conflicts of interest
The authors declare that there is no conflicts of interest.
Acknowledgements
This work was supported by the Second Tibetan Plateau Scientific Expedition and Research Program (STEP) (2019QZKK0901),National Natural Science Foundation of China (41874020),Guangdong Province Introduced Innovative R&D Team of Geological Processes and Natural Disasters around the South China Sea(2016ZT06N331) and Deep Earth Exploration and Resource Environment (2017ZT07Z066).Sentinel-1 data were provided by the European Space Agency (ESA).
 Geodesy and Geodynamics2022年2期
- Geodesy and Geodynamics的其它文章
- Analysis of terrestrial water storage changes in the Shaan-Gan-Ning Region using GPS and GRACE/GFO
- Ocean tide loading correction for InSAR measurements:Comparison of different ocean tide models
- A review of methods for mitigating ionospheric artifacts in differential SAR interferometry
- Monitoring landslide associated with reservoir impoundment using synthetic aperture radar interferometry:A case study of the Yalong reservoir
- Extraction and analysis of saline soil deformation in the Qarhan Salt Lake region (in Qinghai,China) by the sentinel SBAS-InSAR technique
- Review of the SBAS InSAR Time-series algorithms,applications,and challenges
