A review of methods for mitigating ionospheric artifacts in differential SAR interferometry
Bohen Zhang ,Wu Zhu ,Xiaoli Ding ,Chisheng Wang ,Songbo Wu ,Qin Zhang
a MNR Key Laboratory for Geo-Environmental Monitoring of Great Bay Area &Guangdong Key Laboratory of Urban Informatics&Shenzhen Key Laboratory of Spatial Smart Sensing and Services,Shenzhen University,518060 Shenzhen,China
b College of Civiland Transportation Engineering,ShenzhenUniversity,518060Shenzhen,China
c School of Geology Engineering and Geomatics,Chang'anUniversity,Xi'an,Shaanxi,China
d Department of LandSurveying and Geo-Informatics,The HongKong Polytechnic University,Kowloon,Hong Kong,China
e School of Architecture&Urban Planning,Shenzhen University,518060 Shenzhen,China
Keywords:InSAR Ionospheric artifacts Azimuth pixel shift Faraday rotation Range split-spectrum
ABSTRACT
1.Introduction
As a widely used technique,spaceborne interferometric synthetic aperture radar(InSAR)is an effective method for measuring the crustal deformation or digital elevation model (DEM) of the Earth's surface [1-3].This technique is advantageous in remotely monitoring the Earth's surface with wide geographic coverage,weather-independent capacity,and high measurement accuracy.And it has been broadly used in many applications related to geophysical and anthropic activities,such as seismic deformation[4,5],glacier motions [6,7],volcanic eruptions [8,9],underground mining [3,10],groundwater extracting [11],land reclamation [12],and infrastructures instabilities [3,13-16].
Satellite SAR systems are generally at an altitude of 500 km above the Earth's surface.Therefore,the transmitted and received signals interact with two main layers of the atmosphere (troposphere and ionosphere)as they pass through the atmosphere.If the refractive index varies in the troposphere and ionosphere,the data artifacts will be introduced in the focused SAR images,and the accuracy of InSAR measurement can be accordingly degraded[17-20].The ionospheric variations cause data artifacts on InSAR observations with different scales,which is mainly dependent on the data acquisition time (daytime or night-time),the wavelength of SAR data,changes of the ionospheric total electron content(TEC),the geographic location of the study area (low,middle,and high latitudes),and factors induced by the events from external and internal of the Earth (i.e.,solar magnetic storm,geomagnetic abnormity,and mega earthquake) [21-24].
Developing methods for correcting the ionospheric artifacts is an essential topic for applications of InSAR.There are two main aspects of mitigating the ionospheric artifacts on InSAR,i.e.,to improve the accuracy of InSAR measurements and reveal the“true”features of monitoring scenarios.Several studies have been carried out in recent years to mitigate the ionospheric artifacts in InSAR.This paper provides an overview of the latest developments in mitigating the ionospheric artifacts in InSAR,focusing only on single pair of the differential InSAR.
2.InSAR and ionosphere
2.1.InSAR
As a coherent active microwave imaging technique,SAR provides a unique illumination by recording the scattering properties of the Earth's surface under almost all-weather conditions during day and night [25].SAR systems based on airborne or spaceborne platforms obey the same fundamental principle,as sketched in Fig.1.The raw images are collected by transmitting microwave signals from an antenna along the satellite flight direction;then the returned echoes during a period of backscattering are recorded by the received antenna;after the returned pulses are collected,the images are focused using the SAR imaging algorithm,such as Range-Doppler and Chirp Scaling processing [26].
By measuring the phase differences between two SAR images,the ground deformation at different times over the same region is obtained using the InSAR technique.The shifts of the returned phase induced by geophysical and anthropic activities are precisely measured.The phase shifts between two SAR acquisitions are proportional to the difference of slant range distance.Then,the complex image from one acquisition is multiplied with the complex conjugate data from another acquisition to generate the interferogram.In the case with a non-zero baseline,the differential interferometric phase is a combination of phase components,including those from the flat term Δφ,topographic phase term Δφ,ground deformation phase term Δφ,and atmospheric phase terms,i.e.,tropospheric Δφand ionospheric Δφcontributions,which can be expressed as:Δφ=Δφ+Δφ+Δφ+Δ φ+Δφ.After subtraction or elimination of other phase terms,the deformation in the light of sight (LOS) direction is extracted.However,some phase contributions,such as tropospheric,residual topographic,and orbital errors,are sometimes difficult to remove on an individual InSAR interferogram,and many studies have been conducted to mitigate them on multitemporal InSAR[18,27-31].In addition to the phase errors compensation,the modern technique of distributed scatterer can improve the quality of the interferometric phase by increasing the signal-to-noise ratio(SNR)[32-34].
The above is a brief introduction to the conventional differential InSAR (D-InSAR) method,and more details can be found in some review articles [25,26,35,36].
2.2.Ionosphere
As a portion of the upper atmosphere,the ionosphere surrounds the Earth and extends from about 60 km to beyond 1000 km.It is mainly comprised of free electrons,ions,and neutral particles.Under the action of extreme ultraviolet radiation from the Sun,a mixture of free electrons,ions,and neutral gases is produced by the neutral particles in the ionosphere.Besides the solar ultraviolet,there are other sources for ionization in the ionosphere,such as soft X-ray radiation,cosmic rays,and collisions with energetic particles at high latitudes [22].
The ionosphere is a highly dynamic and anisotropic medium.It varies in both space and time domain on a daily basis,which is closely correlated to the activities of the Sun.The density of electrons in the ionosphere changes dramatically from the local daytime to night-time,reaching the maximum in the early afternoon and gradually decreasing after midnight,as shown in Fig.2.Thus,the ionospheric activity is more stable during the day than at night.For this reason,the ascending SAR images are more easily affected by the ionospheric variations than the descending images [24].
According to the different physical and chemical properties at different altitude levels,the ionosphere structure can be generally divided into four different layers (D,E,F1,and F2),especially the electron density profile presents a layered structure[22].Moreover,the ionospheric electron density and the main source of ionization in these layers are different.
2.3.Effect of the ionosphere on SAR and InSAR
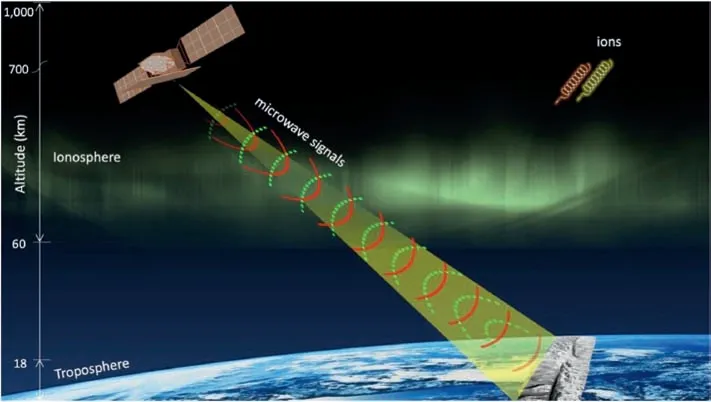
Fig.1.A sketch of the observation geometry of the SAR system when traveling through the ionosphere.
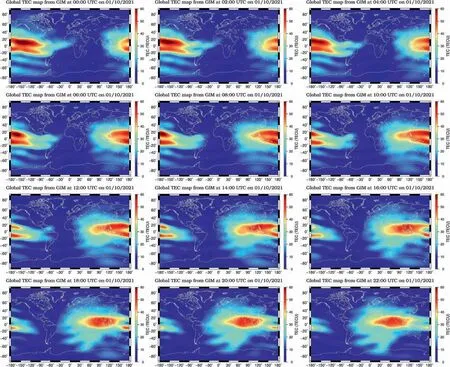
Fig.2.Global Ionosphere Model (GIM) TEC maps from 00:00 to 22:00 on January 10,2021.The data are from the International GNSS Service (IGS) global data center,European Space Agency.
A detailed summary of the ionospheric effects on satellite SAR images has been conducted by Xu et al.[23].The effects of the ionosphere are mainly contributed by the background ionosphere and ionospheric irregularities,including dispersion,group delay,phase advance,Faraday rotation (FR),pixel shift,image degradations,and defocusing [19,23,37,38].The effect of FR is different for each polarization plan,i.e.,HH,HV,VH,and VV,and the absolute ionospheric variations can be estimated using full-polarization SAR data.For the repeat-pass InSAR (single polarization),two kinds of measurements are usually contaminated by the ionosphere,i.e.,the ionospheric artifacts on interferogram and pixel shifts on the azimuth offset map.Figs.3 and 4 give examples of the effects of the ionosphere on single-pass full-polarization and repeat-pass InSAR data.The methods for mitigating the ionospheric propagation errors are presented in Section 3.
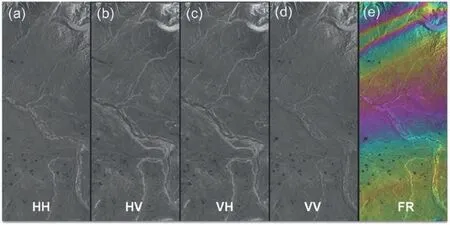
Fig.3.An example of the ionospheric effect on full-polarization data.(a)-(d) SAR images from HH,HV,VH,and VV polarization,respectively.(e) FR angle due to the ionosphere.
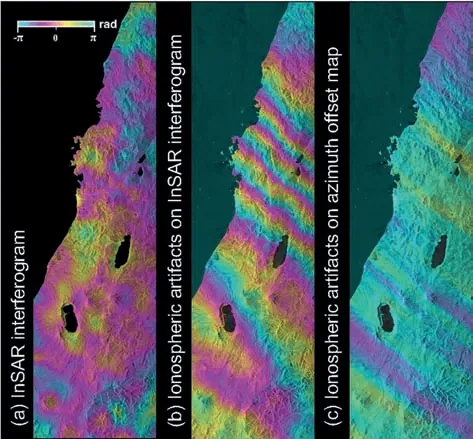
Fig.4.An example of the ionospheric effect on InSAR data.(a) Interferogram without the ionospheric artifacts.(b) InSAR interferogram affected by the ionosphere.(c) Azimuth offset map affected by the ionosphere.
3.Methods for correcting ionospheric artifacts on InSAR
3.1.Faraday rotation method
When the SAR signal travels through the ionosphere,the polarization plane of the signal rotates to a certain degree depending on the magnitude of the electron density in the ionosphere,which is the so-called FR.Based on this magneto-ion property,the ionosphere-induced FR angle can be estimated from the fullpolarization SAR data or dual-polarization data with prior information.The FR-based method is subsequently the earliest method used to study the ionosphere on SAR data [39].Freeman [40]developed an effective way for correcting the ionospheric effects on full-polarization SAR data,where a step-by-step procedure was proposed to calibrate the full scattering matrix affected by the FR.Benefiting from the pioneer studies of Freeman,several studies have been consequently conducted to mitigate the ionosphereinduced FR for polarimetric SAR data,such as those from Advanced Land Observation Satellite (ALOS)/Phased Array L-band SAR (PALSAR) [41-44] and simulated BIOMASS (P-band) systems[45].Due to the speckle noise on the SAR images,it is difficult to directly mitigate the ionospheric artifacts in InSAR using the FRcalibrated single SAR images.The degree of the FR angle is proportional to the vertical TEC (VTEC) map in the ionosphere.Kim[46] then proposed a method based on this relationship,and the results demonstrated the feasibility of the FR-based method in correcting the ionospheric contributions in the differential InSAR.However,the performance of the method is affected by some factors,such as the condition of the ionosphere,SNR of PolSAR data,number of looks in data processing,and geomagnetic latitude.Due to the geomagnetic field being almost perpendicular to the radar LOS direction,the FR-based method is not applicable around the equatorial latitudes[46].The performance of the FR-based method was evaluated and compared with the azimuth shift method using the L-band PolSAR data in [47].
Fig.5 shows an example of mitigating ionospheric artifacts over Thailand using the Faraday rotation method.Fig.5(a) shows the original interferogram,mainly affected by the long-wavelength phase.The ionosphere-corrected interferogram based on the FRderived ionospheric phase screen (IPS) is presented in Fig.5(b).The long-wavelength phase contributions in Fig.5(a) can be removed to a large extent,however,some long-wavelength signals still exist.Fig.5(c) shows the interferogram with correction of the orbital phase using an orbital model.Most of the long-wavelength phase contributions cannot be removed if only the orbital phase model is used for correction.The interferogram corrected using the integrated phase model in[48]is shown in Fig.5(d),and the longwavelength phase contributions in Fig.5(a) can be effectively removed.Comparison of Fig.5(a) and (d) shows that in this case,the standard deviation of integration-corrected phase(0.46 rad) is reduced by approximately 28 times versus the original phase(12.83 rad).The residual phase in Fig.5(d) is suspected to be contributed by the tropospheric and topographic phases.
3.2.Azimuth shift method
The azimuth shift-based method is originally from the discovery of the phenomenon of“azimuth streaks”in the interferometric pairs.Gray et al.[49]initially demonstrated the ionospheric effects in RADARSAT (C-band) and JERS-1 (L-band) data over the polar regions.Due to the fluctuations of the electron density in the ionosphere during SAR imaging,azimuth streaks are present as stripes with constant directions in the results of pixel offset or multi-aperture interferometry (MAI).Many studies have been devoted to exploring the potential for correcting the ionospheric effects based on this phenomenon[47,50-60].
A prototype method for mitigating the ionospheric artifacts based on this phenomenon is proposed by Matter and Gray [50].Raucoules and de Michele [52] suggested a detailed procedure for mitigating the ionospheric artifacts,where the ionospheric azimuth shift is extracted using directional polynomial filtering from the result of azimuth pixel offset,and the scaling factor is estimated by the linear relation between the interferometric phase derivative and the ionospheric azimuth pixel shift.However,if the integral constant is not addressed,the IPS cannot be well estimated.Then,Jung et al.[54] developed a correction method based on the azimuth pixel offset from MAI.His method assumes that the deformation phase is not included in both the MAI and InSAR interferograms.To extend the applications to the areas with largescale deformation,Zhang et al.[60]proposed a method to improve the estimation of the integral constant.In addition,a joint correction of ionospheric artifacts and orbital phase ramps was proposed in [56,58].As verified with Global Positioning System (GPS) measurements,the accuracy can be improved approximately 60%with the azimuth shift-based method after correcting the ionospheric artifacts in the original InSAR interferogram [56,60].
Fig.6 gives an example of the results of mitigating ionospheric artifacts of the 2008M
7.9 Wenchuan earthquake using the azimuth shift-based method in[60].Fig.6(a)and(c)show the azimuth and range pixel offset maps generated with MAI and offset tracking,respectively.The ionospheric azimuth pixel offset in Fig.6(a)is in a constant direction and therefore can be separated from the deformation signals using directional filtering.Fig.6(b) and (d) are the smoothed results of Fig.6(a) and (c).Fig.6(e) is the estimated IPS using the method in [60].The original and ionospheric-corrected InSAR interferograms are shown in Fig.6(f) and (g),respectively.The root-mean-squared (RMS) errors have decreased from 23.53 cm to 9.83 cm for Fig.6(f)and(g)when comparing with GPSobserved LOS displacements,indicating the reliability of the azimuth shift method in ionospheric delay correction.3.3.Range split-spectrum method
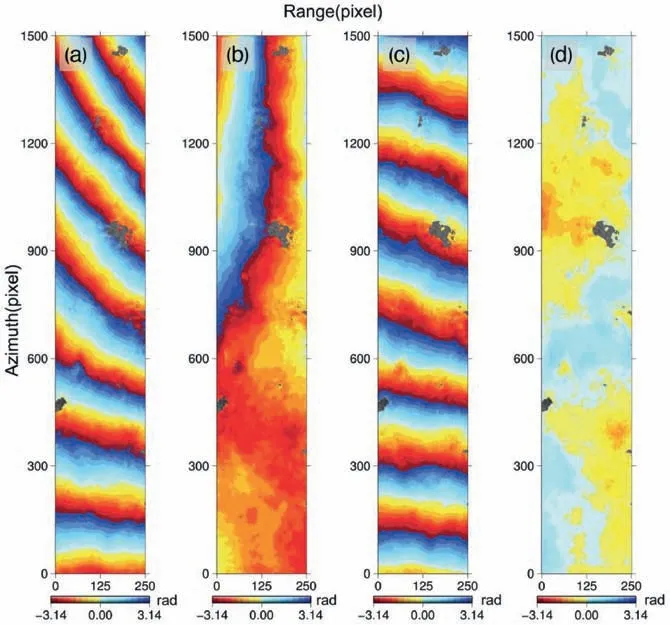
Fig.5.Mitigation of the ionospheric artifacts by using the Faraday rotation method.(a) Original interferogram,(b) corrected interferogram by subtracting FR-derived ionospheric phase screen from(a),(c)interferogram with corrections of orbital phase from(a),and(d)interferogram by subtracting the FR-derived ionospheric phase screen and residual longwavelength signals from (a).Reproduced from [48] with modifications.
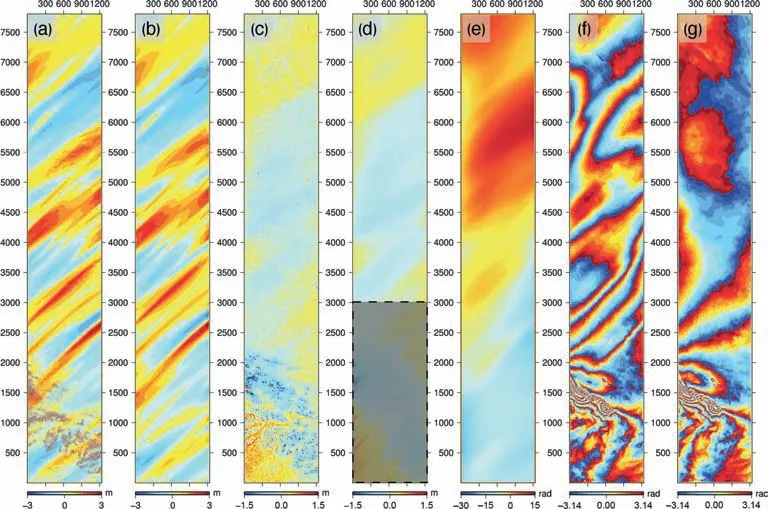
Fig.6.Mitigation of the ionospheric artifacts in track 471 of the 2008 Wenchuan earthquake with ALOS PALSAR data.(a) Azimuth pixel offset map generated with MAI [61].(b)Ionospheric azimuth pixel shift generated using adaptive directional filtering from(a).(c)Range pixel offset map produced by offset tracking[62].(d)Smoothed range pixel offset map.(e) Estimated IPS.(f) Original InSAR interferogram.(g) Ionospheric-corrected InSAR interferogram.Reproduced from [60] with modifications.
The range split-spectrum method is initially proposed to map the terrain elevations by calculating the absolute interferometric phase [63,64].It is implemented by separating the full range spectrum of SAR images into two sub-band spectrums with two different central frequencies,then the effective wavelength of the linearly synthetic interferogram will be significantly enlarged,and the absolute phase can be easily obtained by reducing the noise.
The basic idea of the range split-spectrum method is from the dispersive property of the ionosphere proposed in [65,66],where the signal traveling speed in the ionosphere is inversely proportional to the frequency of the microwave signal.Same as the dualfrequency GPS,if we simultaneously obtain two single look complex(SLC)images with two different central frequencies,the phase contributions in the InSAR interferogram can be separated into two components,i.e.,non-dispersive and dispersive.
The dispersive component is contributed by the ionospheric phase term only,while the non-dispersive component consists of other phase terms,including deformation,topographic,orbital,and tropospheric.If the central frequency of sub-band SLC is equidistant from the central frequency of full-band SLC,the method can be called as symmetric range split-spectrum method,otherwise,it can be called as asymmetric range split-spectrum method.The latter one was proposed as the operational method for correcting the ionospheric artifacts of the data from the NISAR mission[67].Then,the ionospheric phase component can be estimated from the interferograms generated by the sub-band SLC images.
However,two issues are also addressed in [66].For example,the phase noise is greatly amplified due to the coefficient that is usually very large,and the unwrapped phase in the interferograms generated by the sub-band SLC images needs to be scaled before estimating the final IPS.Gomba et al.[68] proposed the practical implementation procedures for correcting the ionospheric artifacts based on this method.Although the basic principle of the method is very simple,if the procedures are not carefully carried out,the IPS can be poorly estimated and the correction cannot be effectively performed.These procedures include refinement of the interferogram,phase unwrapping correction of the sub-band interferograms,detection of the outliers,and smoothing of the IPS [68].Recently,due to the effectiveness of the range split-spectrum technique,it has become the most popular method for estimating and removing the ionospheric phase contributions in InSAR.The method has extended to different observation modes and SAR missions,such as the terrain observation by progressive scans (TOPS) of Sentinel-1 and the scanning SAR(ScanSAR)of ALOS-2[69,70].Moreover,the method has been successfully applied to various applications and has enhanced the ability of InSAR to different scenarios,such as earthquake and glacier motion [71-75].
Fig.7 shows an example of the results of mitigating the ionospheric artifacts of theM
7.0 Kumamoto,Japan earthquake,which occurred on April 16,2016.Fig.7(a) is the original InSAR interferogram.Fig.7(b) shows the azimuth pixel shift map presenting the ionospheric azimuth streaks.The ionospheric-corrected InSAR interferograms using symmetric and asymmetric range splitspectrum methods are displayed in Fig.7(c)-(e).To quantitatively evaluate these results,we generated the normalized probability of the standard deviations from the symmetric and asymmetric methods (without smoothing).The standard deviation of symmetric and asymmetric range split-spectrum methods is highly consistent with the theoretical accuracy,as shown in Fig.8.Even the standard deviations of the asymmetric range split-spectrum methods are worse than those of the optimal symmetric range split-spectrum method,but in the case of broadband SAR data,the deviation between these methods can be further improved by postprocessing smoothing.4.Discussion and recommendations
4.1.Current challenges
The methods for mitigating ionospheric phase contributions in the differential InSAR are applicable to different types of SAR data,the scale of variations in the ionosphere,and monitoring scenarios.For example,the FR-based method is only suitable to the fullpolarization SAR data,and the rotation angle of the polarization plane cannot be directly estimated by the single-and dualpolarization data.However,full-polarization data for SAR missions are currently not frequently available and very limited in quantity.Moreover,the FR-based method is also limited due to the issues of parameter estimating,such as the inaccurate calibration parameters(i.e.,crosstalk,channel imbalance,and additional noise)that introduce biases during the ionospheric correction,and imprecise parameters of the geomagnetic field that directly degrade the accuracy of the IPS estimation.The azimuth shift method is very sensitive to the small-scale variations in the ionosphere and has the potential to measure its variations at high resolution.However,there are three main issues with this method.First,the ionospheric azimuth shift is difficult to be isolated from the deformation when the direction of the azimuth streak is almost the same as the direction of azimuth deformation.Second,the final IPS will be biased if the parameters such as scaling,offset,and integral constant are not accurately estimated,especially when deformation signals cannot be well separated from the ionospheric phase.Third,this method is not applicable to the area with spatial gaps due to integration errors.Since the azimuth shift method only resolves the medium-scale ionospheric variations [37],the longwavelength ionospheric component easily remains if the azimuth shift method is used alone,where the range split-spectrum method can be combined.The range split-spectrum method is effective for correcting the ionospheric artifacts in InSAR for the wideband SAR systems.However,this method is very sensitive to noise,and it can be largely amplified due to the split-spectrum processing and the linear combination of sub-band interferograms.For the interferometric pairs with low coherence,this method is challenging to be performed well [68].

Fig.7.Mitigation of the ionospheric artifacts of the 2016 Kumamoto earthquake using PALSAR-2 data.(a) Original InSAR interferogram.(b)Azimuth pixel shift map generated by MAI.Ionospheric-corrected InSAR interferogram using the (c) symmetric range split-spectrum method (one-third sub-bands),(d) asymmetric range split-spectrum method (onefourth and one-sixteenth sub-bands),and (e) asymmetric range split-spectrum method (one-half and one-sixteenth sub-bands).Reproduced from [73] with modifications.
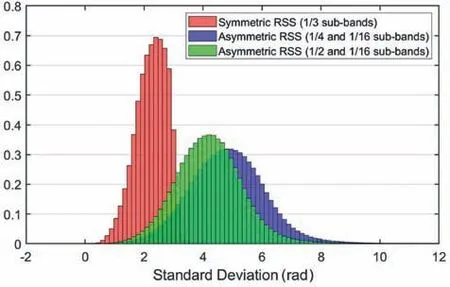
Fig.8.Normalized probability of the standard deviation of the results from Fig.7(c)-(e).Reproduced from [76] with modifications.
The accuracy of the Faraday rotation method mainly depends on the center frequency of the SAR system,the effective look number,the polarimetric coherence,and the geomagnetic field along the integration path [77].The value of the last factor decreases with increasing latitude,i.e.,the accuracy of the Faraday rotation method generally increases from the equatorial regions to the polar regions.For the azimuth shift method,the accuracy is related to the central frequency of radar,the effective antenna length,the azimuth pixel spacing,the effective look number,the scaling factor,and the coherence of the MAI interferogram [54].The accuracy of the range split spectrum method is mainly attributed to the central frequency and bandwidth of the SAR system,the effective look number,and the coherence of the subband interferogram [68].Since the accuracy of these methods depends on different factors and may vary from case to case,how to adaptively combine the different methods for estimating the IPS is still challenging.
4.2.Recommendations for future research
Although some methods have been developed to mitigate the ionospheric artifacts,there are still some limitations for the individual-based method,as discussed in Section 4.1.Some studies have already demonstrated that a combination of methods from different groups can improve the estimation of the IPS,such as the combined use of the range split-spectrum method and azimuth shift method [37,78].To improve the robustness of ionospheric corrections in InSAR,hybrid approaches based on each group of the methods are expected to be further integrated.
More and more SAR missions will be launched soon,with various imaging modes,such as the SweepSAR of NISAR [79] and the staggered stripmap of Tandem-L [80].The ionospheric correction methods should be further adapted or developed for these new imaging modes,such as those presented for the TOPS mode of Sentinel-1 and the ScanSAR mode of ALOS-2 [69,70].On the other hand,some algorithms improve the ability of InSAR applications but also change the methods of the traditional data processing,such as the Sequential Estimator [81] and the approach for“userfriendly”InSAR data [82].Future work is needed to adapt the ionospheric correction for these new algorithms.
Among these methods,the azimuth shift method and range split-spectrum method can only estimate the differential ionospheric propagation errors,and the Faraday rotation method can measure the absolute ionospheric propagation errors[37,77].If the azimuth shift or range split-spectrum method is applied for mitigating the ionospheric artifacts for multitemporal InSAR,the least square inversion can be applied to estimate the interval IPS from a connected network of IPS [83].However,if the amount of the SAR image is very large,the computation will be very timeconsuming.Developing methods for correcting the absolute ionospheric propagation errors in individual SLC images prior to the interferometric processing can highly reduce the computational time and improve the efficiency of the multitemporal InSAR.
5.Conclusions
InSAR has been broadly adopted to measure ground deformation,and it has experienced great success in the past three decades.However,when the SAR signals travel through the ionosphere,they may change in both space and time,and affect the measurement of InSAR.In this paper,we provide a review of the methods for mitigating the ionospheric artifacts in the differential InSAR and particularly focus on some of the most popular methods,such as the Faraday rotation,azimuth shift,and the range split spectrum methods.More effective and automatic methods are expected to be developed.By applying the ionospheric correction in InSAR,the understanding of the deformation induced by different activities will be less biased.
Conflicts of interest
The authors declare that there is no conflicts of interest.
Acknowledgments and Data
This work was supported by the National Key Research and Development Program of China (2020YFC1512001),the Guangdong Basic and Applied Basic Research Foundation (No.2021A15 15011427),the Research Grants Council of the Hong Kong Special Administrative Region (Projects PolyU 152232/17E,PolyU 152164/18E and PolyU 152233/19E),the National Natural Science Foundation of China(Grants 41790445,41974006,42074040 and 41941019),the Shenzhen Scientific Research and Development Funding Program(Nos.20200807110745001,KQJSCX20180328093453763 and 202008 12164904001),the Department of Education of Guangdong(218KTSCX196),the Fundamental Research Funds for the Central Universities (300102269207),the Research Institute for Sustainable Urban Development (RISUD) (BBWB),and the Innovation and Technology Fund of Hong Kong (ITP/019/20LP).The authors would like to thank the Japan Aerospace Exploration Agency (JAXA) for providing the ALOS PALSAR and ALOS-2 PALSAR-2 data under the RA6 PI Projects PI3380 and PI3232,and EO-RA2 Project ER2A2N040.Some of the ALOS PALSAR data were downloaded from the Alaska Satellite Facility (ASF) Distributed Active Archive Center (DAAC)website (https://vertex.daac.asf.alaska.edu/) and are copyrighted to JAXA/METI.Some of the figures were generated by Generic Mapping Tools(GMT 5.2.1)software(http://gmt.soest.hawaii.edu).
 Geodesy and Geodynamics2022年2期
- Geodesy and Geodynamics的其它文章
- Analysis of terrestrial water storage changes in the Shaan-Gan-Ning Region using GPS and GRACE/GFO
- Ocean tide loading correction for InSAR measurements:Comparison of different ocean tide models
- Co-and post-seismic slip analysis of the 2017 MW7.3 Sarpol Zahab earthquake using Sentinel-1 data
- Monitoring landslide associated with reservoir impoundment using synthetic aperture radar interferometry:A case study of the Yalong reservoir
- Extraction and analysis of saline soil deformation in the Qarhan Salt Lake region (in Qinghai,China) by the sentinel SBAS-InSAR technique
- Review of the SBAS InSAR Time-series algorithms,applications,and challenges
