Monitoring landslide associated with reservoir impoundment using synthetic aperture radar interferometry:A case study of the Yalong reservoir
Zhe Liu,Bing Xu,Qijie Wang,Wenyan Yu,Zelang Miao
School of Geosciences and Info-Physics,Central South University,Changsha 410083,China
Keywords:Landslide monitoring Two-dimensional deformation Yalong reservoir SBAS-InSAR
ABSTRACT The construction of large reservoirs can address the problem of uneven distribution of rivers in time and space,thereby meeting the needs of human production and living.However,the huge elevation of the water level in some areas may modify the distribution of the groundwater level,causing geological disasters,such as surface deformation and landslides.The Yalong reservoir supplies water to the downstream area of Shannan,Tibet;however,since the reservoir started storing water in 2017,the government has discovered two ancient landslides.In this study,to monitor the deformation of the Yalong reservoir since its construction in 2014,we first used synthetic aperture radar(SAR)data and the multidimensional small baseline subset(MSBAS)method to obtain the deformation in the east-west and vertical directions.The result indicated the presence of three large,slow-moving landslides:Landslides I and II,located on the right bank of the Yalong reservoir,which are consistent with the results obtained by the actual survey,and a new discovery,Landslide III,located on the left side of the reservoir.Meanwhile,the experimental results indicated that the dam had undergone obvious deformation after impoundment,which should not be ignored.The global positioning system and interferometric SAR(InSAR)timeseries deformation residual data were used to verify the accuracy of the InSAR method.The results also showed that the deformation caused by the three landslides had tended to accelerate after the reservoir's impoundment,and that the failure mode was retrogressive landslide.We found that InSAR plays a vital role in landslide detection and failure mode research around reservoirs,and assists in providing early warning for subsequent landslide disasters.
1.Introduction
Reservoirs have recently become a popular means of environmental improvement and economic development,as they can meet the demands for water storage,power generation,flood control and irrigation.However,they may change the surrounding ecological environment due to the flooded land,bank collapse,landslides and species extinction [1].In 1963,a huge landslide occurred in the Vajont reservoir in Italy,whose volume was approximately 270 × 10m,resulting in 1925 deaths [2].In 1982,the JiPazi landslide in the Yangtze River in China,with a volume of 15 × 10m,destroyed 1730 houses and raised the riverbed by 40 m,resulting in the disruption of shipping on the river[3].In 2018 and 2019,1631 and 4220 landslides,respectively,occurred worldwide,accounting for 55%and 68%of the total geological disasters in these years[4,5].Therefore,landslides should be timely monitored and evaluated to avoid substantial casualties and property losses.
The traditional approaches for monitoring landslide deformations include spirit levelling [6],global positioning systems(GPS) [7],extensometers [8],unmanned aerial vehicles [9] and optical remote sensing [10].Methods
such as spirit levelling,GPS and extensometers have high temporal resolution,but perform discrete point measurement with low spatial resolution,which makes it impossible to conduct large-area observations[11].Optical remote sensing can draw upon considerable archived data and cover a wide area.However,these data are affected by cloud and rain shielding and can only be used for a simple qualitative analysis of landslides [12].Recently,the emergence of interferometric synthetic aperture radar(InSAR)has substantially compensated for the deficiencies of the aforementioned observation methods.InSAR can observe the Earth through all types of weather at all times,and is resistant to cloud and rain due to its long wavelength,thereby exhibiting strong advantages in monitoring geological disasters,such as landslides[13].Achache et al.applied InSAR technology to the Saint-Etienne-de-Tinee landslide in the French Alps,proving that InSAR can be used for landslide monitoring [14].However,differential InSAR is highly susceptible to temporal coherence and atmospheric delay in landslide monitoring [15].Ferretti indicated that persistent scatterer (PS) points are smaller than the synthetic aperture radar (SAR) resolution and remain stable for a long time,and thus,are not affected by temporal and spatial incoherence.In addition,PS-InSAR can eliminate the atmospheric influence through a spatio-temporal analysis of the time-series differential interference phase of the points,to achieve millimetre-level deformation monitoring [16,17].Unlike other landslides,reservoir landslides are considered to be caused by heavy rainfall and reservoir activities[1,18,19].Therefore,the influence of water-level change or rainfall on reservoir landslides needs to be considered.The Yalong reservoir is located in the southeast of Zedang Town,Naidong County,Shannan city,Tibet,with a high altitude in the south and low altitude in the north.The project was initiated in July 2014,and the sluice was filled at the end of 2017.Besides downstream flood detention and urban water supply,this reservoir can also address the downstream irrigation of 60.6 kmof land.The reservoir's total capacity is 22.06 × 10m,and it is a class-III medium reservoir [20].When the water storage reached 4112 m,two large,slow-moving landslides appeared.At present,although the Global Navigation Satellite System (GNSS) is used to automatically monitor the surface deformation caused by these landslides,this method cannot monitor the entire landslide around the Yalong reservoir and assess the influence of reservoir impoundment on landslide occurrence.Therefore,this study applies multi-track SAR data to monitor the deformation caused in this region since the construction of the reservoir and to obtain the time-series deformation in the east-west and vertical directions.Furthermore,we analyse the relationship between water storage and landslides to assist in providing early warning of subsequent landslide disasters.
2.Study area and datasets
2.1.Study area
Yalong reservoir is located in the upper region of the Yalong River (latitude:285418.79N;longitude:915420.35E) in the central Himalayas,which is a landform type of high mountain denudation and river alluviation.The valley is U-shaped,with high southern and low northern terrain,sparse vegetation,exposed bedrock and relatively strong physical weathering (Fig.1).
The distribution of stratigraphic lithology plays an important role in the evolution and formation of landslides.The stratigraphic distribution around the Yalong reservoir area mainly includes the Lower Cretaceous Gabullah Formation (K1j),Upper Triassic Langyue Formation(T31),Lower Tertiary Nobusha group(E1b),Lower Jurassic Rindang Formation (J1r),middle-upper series (J2-3),quaternary series (Q) and magmatic rocks.The reservoir location encompasses the eastern wing of the Himalayan arcuate structure and east-west structure of the Yarlung Zangbo River,with a welldeveloped regional structure.The active fault zones mainly include the Yarlung Zangbo River fault zone and Renbu fault(Fig.1).
Shannan city has a temperate arid climate,with the rainy season mainly lasting from June to September.After the completion of the Yalong reservoir in late 2017,the water level was expected to rise from 4063 to 4130 m,which resulted in a reservoir with a width and backwater length of approximately 363 and 3500 m,respectively(Fig.2).Studies have shown that reservoir slope instability is mainly related to water in three ways.(1) Changes in reservoir water level will erode rocks and soil around the water-level line.(2)The rise in the reservoir water level will increase the hydrostatic pressure and buoyancy of landslides,and thereafter,decrease the landslide gravity and slope stability.(3) With a decrease in the reservoir water level,seepage pressure will be generated because the decline of the reservoir water level is considerably faster than that of the groundwater level,thereby reducing the slope stability[22].Therefore,it is necessary to monitor the reservoir deformation before and after impoundment.
2.2.Dataset
The SAR data coverage is shown in Fig.1(a) and its main parameters are listed in Table 1.The background image in Fig.1(a) is the digital elevation model data with 30 m resolution.

Table 1 Main parameters of the SAR data.
3.InSAR 2D time-series deformation solution method
In deformation monitoring using InSAR,misjudgements and omissions may occur as InSAR can only obtain 1D deformation in the line-of-sight (LOS) direction.To recover 3D deformation,at least three tracks of SAR data in the same region during the same period are required [23].Given the difficulty faced by different satellites in obtaining such data,the conventional method is to disregard the time interval of the different data when restoring the 3D time-series deformation.However,if this time interval is entirely disregarded,it may result in errors,which is not conducive to the interpretation of the subsequent deformation [24].Therefore,this study used the MSBAS technique,proposed by Samsonov et al.,to restore the 2D time-series deformation and rate in the studied region [25].
Fig.3 shows the detailed data processing strategy used in this study.In the experiment,we collected SAR data from October 2014 to March 2020,which included 127 Sentinel ascending SAR images acquired with track 41,118 Sentinel descending SAR images acquired with track 77 and 118 Sentinel descending SAR images acquired with track 150.The first SAR image was used as the master image,and the remaining images were registered to the master image using a network-based adjustment method [26].Subsequently,the three sets of data were processed using the SBAS-InSAR method to obtain LOS deformation.To ensure the same spatial resolution,the multi looking factor of 4:1 was set for the interferograms.To overcome the influence of temporal incoherence and atmospheric error,the network was constructed in the twoconnection mode,and a target (latitude:2855′48.02′′,longitude:9154′58.21′′) substantially distant from the deformation region was used as the reference point to obtain relatively consistent deformation results.Thereafter,the low-correlation region was masked and unwrapped using the minimum cost flow method.Generally,at high altitude,InSAR data processing faces more severe coherence loss and atmospheric influence due to the complex terrain.In the experiment,we used quadric surface fitting to remove a wide range of atmospheric and orbit errors,and then the space-time filtering method to purify a small range of the atmospheric phase according to the frequency characteristics of time and space.After refining the interferometric baseline [27] and removing atmospheric errors [28],the results were resampled to the same grid for unifying the spatial references.
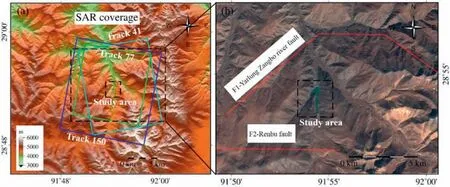
Fig.1.Study area of Yalong reservoir.(a) shows the digital elevation map of the study area.The light blue rectangle represents Sentinel ascending synthetic aperture radar (SAR)images acquired with track 41,the green rectangle represents the data of track 77 and the dark blue rectangle represents the data of track 150.The large black dotted rectangle in(a)delineates panel(b),i.e.the optical image region;the small black dotted rectangle indicates our study area.(b)indicates the main faults within 10 km of the Yalong reservoir.Fault data modified from Wang et al.[21],where the background is an optical image from Sentinel-2.
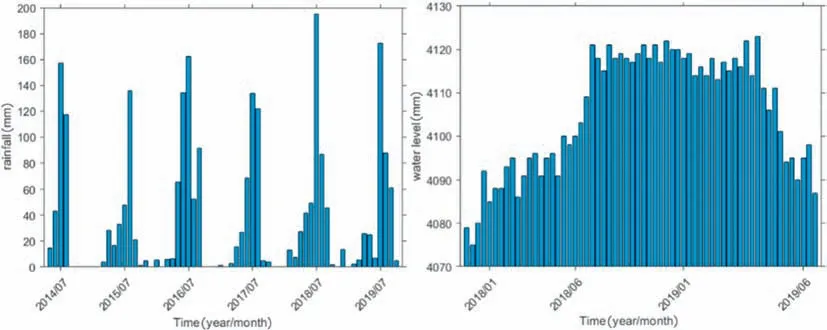
Fig.2.Statistics of rainfall and water level after impoundment in Shannan city.
Given that all SAR satellites are positioned close to the polar orbit satellites moving in the north-south direction,the deformation accuracy in this direction is low [29].As shown in Fig.1,Landslides I and II in the study area are moving in the east-west direction.
Although Landslide III is oriented northwest,the deformation sensitivity factor in the north-south direction has the smallest value in the 3D direction.Hence,the deformation in the north-south direction was disregarded.Thereafter,a 2D time series deformation was recovered using the MSBAS method,as follows:

A
={A
Δt A
Δt
},A
=-sinθ×cosα andA
=cosθ;λ is a regularisation parameter;I
is a parameter regularisation matrix(which can be a zero-,first-or second-order difference operator);V
andV
are the deformation rates in the east-west and vertical directions,respectively;φ is the geocoded unwrapping phase;t
refers to the time interval;θis the incidence angle;andαrefers to the azimuth angle.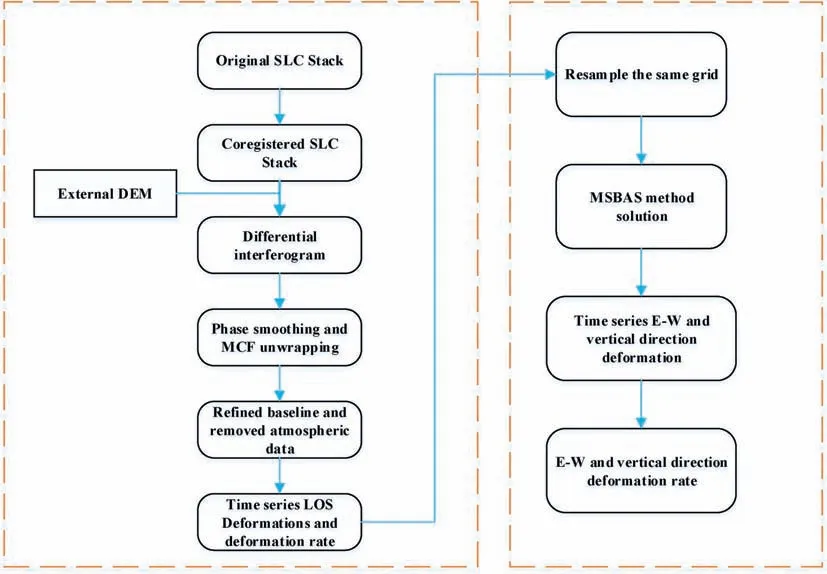
Fig.3.Detailed data processing strategy.
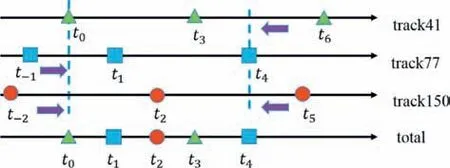
Fig.4.Merged acquisition times from different tracks.


i
=1,2 …n
-1 and λ originates from the L-curve method[30].By combining Equations (2) and (3),the deformation rates of each segment in the east-west and vertical directions can be obtained.Thereafter,the 2D time series of cumulative deformation can be obtained using Equations (4) and (5),as follows:
Note that the number of equations is considerably less than that of the unknowns,thereby leading to rank defect in Equation (2).Equation (2) is rank-deficient because the number of unknown parameters is greater than that of the linearly independent


4.SAR data results
4.1.Results
4.1.1.Time-series results in the LOS direction
Fig.5 shows three average deformation rates in the LOS direction for Sentinel-1 before and after the impoundment.As shown in Fig.5(a)-(c),there is no obvious deformation signal in the three Sentinel-1 datasets obtained before water storage.Fig.5(d) shows two distinct landslide areas on the right bank of the Yalong reservoir,where the maximum average deformation rate in the LOS direction is 30 mm/a.The result shown in Fig.5(e)agrees with the spatial distribution shown in Fig.5(d),but the maximum average deformation rate in the LOS direction is -60 mm/a.As shown in Fig.5(f),besides the two landslides with the same distribution,shown in Fig.5(d)and(e),a landslide area is evident on the left side of the reservoir,where the maximum average rate reaches -30 mm/a.Thus,we conclude that although the data of different orbits exhibit suitable consistency in spatial position,the maximum deformation rates are different,which may result from the different incidence angles and flight azimuth angles among the different data [31].To reveal the characteristics and sliding patterns of landslide deformation around the Yalong reservoir,the InSAR 2D time-series deformation solution method was used to solve the time-series deformation and average rate in the east-west and vertical directions.
4.1.2.Result of 2D deformation decomposition
The east-west and vertical time-series deformations in the Yalong reservoir area were obtained using the method introduced in Section 3.In addition,the effects of water storage were calculated and analysed,as shown in Fig.6.As the figure indicates,two landslides are present on the right bank of the Yalong reservoir due to water storage,which is consistent with results obtained from a local survey.However,the landslide area on the left bank has not been identified before and should be inspected by the relevant departments.The landslides on the right bank of this region are mainly in the horizontal direction and accompanied by vertical deformation,whereas that on the left bank is in the opposite direction.
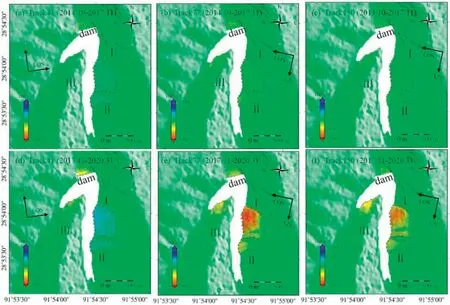
Fig.5.Average deformation rate in line-of-sight(LOS)direction for Sentinel-1A.(a)Average deformation rate in LOS direction for Sentinel Track 41 from building completion to the first impoundment;(d)Average deformation rate in LOS direction for Sentinel Track 41 from the first impoundment to present;(b),(e)and(c),(f)are the average deformation rates in LOS direction for Sentinel Tracks 77 and 150,respectively.Hereinafter,I,II and III represent Landslides I,II and III,respectively.(Positive values indicate movement closer to the satellite,whereas negative values indicate movement away from the satellite.)
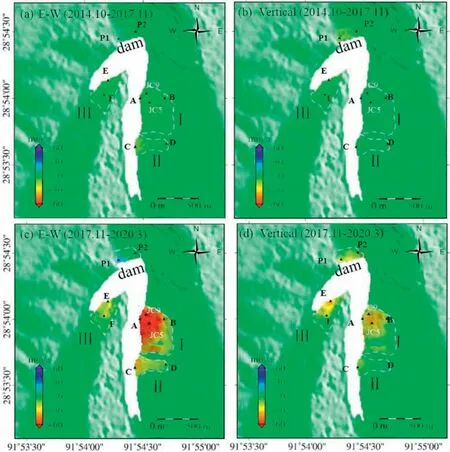
Fig.6.Two-dimensional deformation rate maps.(a)Deformation map in the east-west direction from building completion to the first impoundment;(c)deformation map in the east-west direction from the first impoundment to present;(b)and(d)corresponding deformation map in the vertical direction.Points JC5 and JC9 represent two GPS monitoring points of Landslide I;Points A and B represent two deformation feature points of Landslide I;Points C and D represent two deformation monitoring points of Landslide II;Points E and F represent two deformation monitoring points of Landslide III;and Points P1 and P2 represent two deformation monitoring points of the dam (positive in the east direction and in the vertical direction).
The Yalong reservoir had no visible signs of landslides from its construction in 2014 until its storage in 2017.Since the impoundment in December 2017,landslide deformation around the Yalong reservoir has accelerated,with the maximum average deformation rate in the east-west direction reaching -80 mm/a and the maximum cumulative deformation rate in the vertical direction reaching-40 mm/a.This implies that the reservoir will modify the distribution of underground water in the area,reducing the shear strength of soil mass,changing the bank slope stability of the surrounding reservoir and its own internal stress state and leading to slope deformation and instability.Given the fragile geological structure surrounding the Yalong reservoir,the large elevation of the water level will pose a substantial threat to the stability of the surrounding slope.A detailed analysis of the three existing landslide areas is described below.
5.Analysis and discussion
5.1.Accuracy verification
5.1.1.Verification of internal compliance accuracy
The accuracy of this experiment was evaluated by calculating the RMSE of the time-series deformation residual,and the results are shown in Fig.7.Then,we conducted a statistical analysis on the RMSE of the time-series deformation,and found that an RMSE value of less than 10 mm accounted for approximately 80.8%of the total sequence and that a value of less than 15 mm accounted for approximately 95.6%,thus validating the experimental accuracy.
5.1.2.Validation by GPS measurements
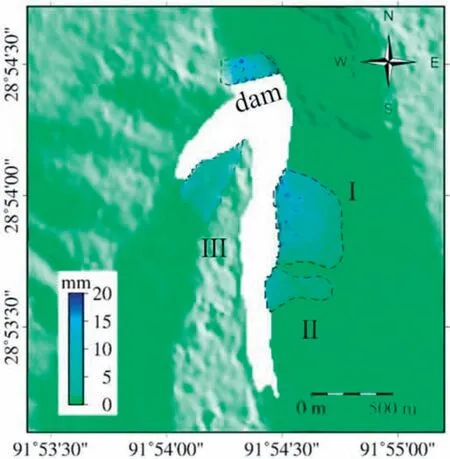
Fig.7.Residual map of time-series deformation.
We used the GPS data from the corresponding time of InSAR to calculate the RMSE,as shown in Table 2.The results showed that the east-west error between the InSAR and GPS data during this period was below 4 mm and the vertical error was under 5 mm,thereby indicating the accuracy of InSAR.

Table 2 RMSE comparison between GPS and InSAR.
5.2.Analysis of the time-series results
Landslide occurrence is a process ranging from quantitative to qualitative change.From deformation to instability of the slope,the three deformation stages on the displacement-time curve are the initial,constant velocity and accelerated deformations [32].Therefore,the deformation stage of the present landslide surfaces was investigated here.In general,the landslide instability failure mode can be classified as retrogressive,load-caused and complex landslide modes [31].To analyse the inducement of landslides in the Yalong reservoir,we introduce the deformation characteristics and failure modes of the three landslides.
5.2.1.Deformation analysis of Landslide I
The field investigation indicated that Landslide I (latitude:2853′56.20″N,longitude:9154′32.36″E) is fully connected except for the cracks on the left side,and its volume is 13.2×10m.It has caused serious damage to two sections of the subgrade,one of which could only be crossed on foot,whereas the other was cut off completely.According to the surface displacement monitoring set up by the local water conservancy department,the cumulative horizontal and vertical displacements at the monitoring point from 1 March 2019 to 6 June 2019,were 237and 197 mm,respectively.
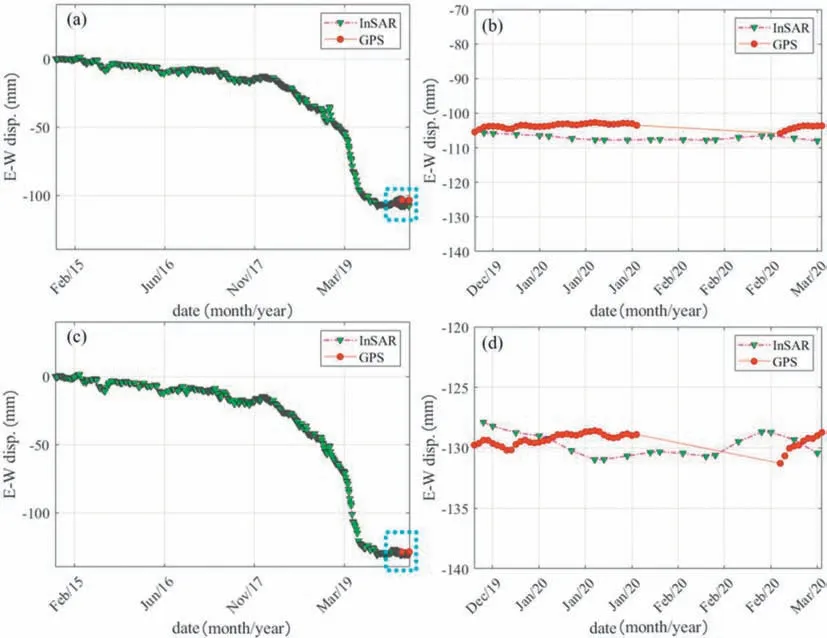
Fig.8.Comparison between global positioning system(GPS)and interferometric synthetic aperture radar(InSAR)in the east-west direction.(a)Comparison of GPS and InSAR at JC5 point in the east-west direction,(b)enlarged map of the framed section in(a),(c)comparison of GPS and InSAR at JC9 point in the east-west direction and(d)enlarged map of the framed section in (c).
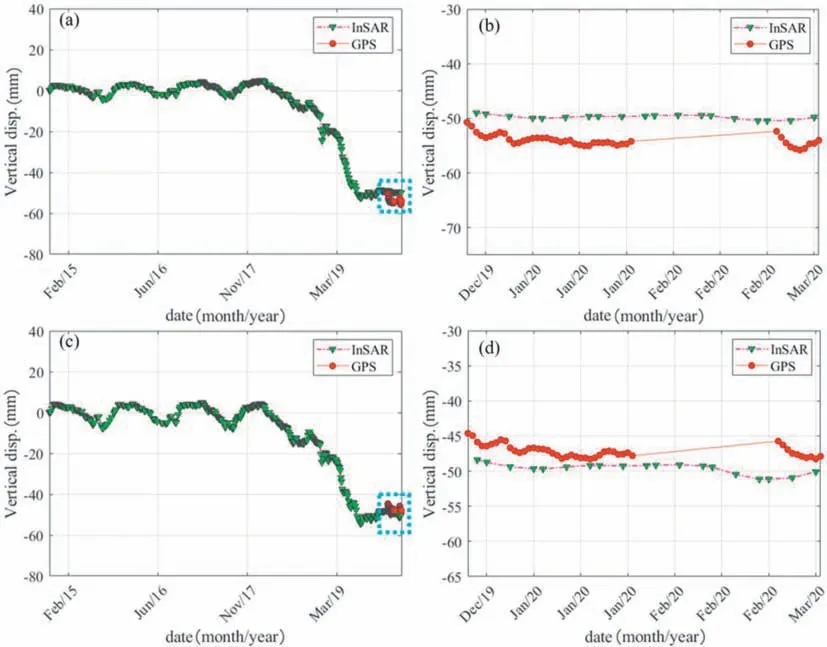
Fig.9.Comparison between global positioning system(GPS)and interferometric synthetic aperture radar(InSAR)in the vertical direction.(a)Comparison between GPS and InSAR at JC5 point in the vertical direction,(b)enlarged map of the framed section in(a),(c)Comparison of GPS and InSAR at JC9 point in the vertical direction and(d)enlarged map of the framed section in (c).
The landslide types were classified by analysing the characteristics of the landslide leading and trailing edge points in the east-west and vertical directions in the time series deformation of the results (Figs.6 and 10),and it was found that Landslide I deformation mainly occurred in the east-west direction.From October 2014 to March 2020,the cumulative east-west and vertical displacements at Point A were -120 and -35 mm,respectively.In addition,the cumulative east-west and vertical displacements at Point B were -70 and -20 mm,respectively.Moreover,the deformation trends in both directions have substantially accelerated since the impoundment of the reservoir in 2017.These results indicate that the reservoir impoundment has a significant correlation with deformation.Accordingly,it can be deduced that the landslide instability failure mode at the Yalong reservoir was a retrogressive landslide.The corresponding mechanism is as follows.The foot of the slope,as the slide resistance section,was scoured by the reservoir water level and the foot of the side slope deformed first.With the continuously changing water level,the slope was destroyed under hydrostatic and hydrodynamic pressures.Moreover,the shear force was higher than the resistance shear force,which resulted in the formation of pull cracks from bottom to top.The zone of pull cracks forms a plastic zone.Then the plastic zone continued to increase,and the sliding surface was connected.That is,slope instability resulted in landslides.
5.2.2.Deformation analysis of Landslide II
The large,slow-moving Landslide II is located in front of Landslide I (latitude:2853′39.21″N,longitude:9154′32.21″E).The field survey indicated that the right side of Landslide II had collapsed previously,the outside shoulder of the highway has cracked and the collapsed area on the left side has extended to the outer edge of the roadbed.The volume of Landslide II is 3 × 10m.Although there is no evident sign indicating the resurrection of Landslide II,its shear strength parameters continue to decrease,and this process will eventually reactivate it.
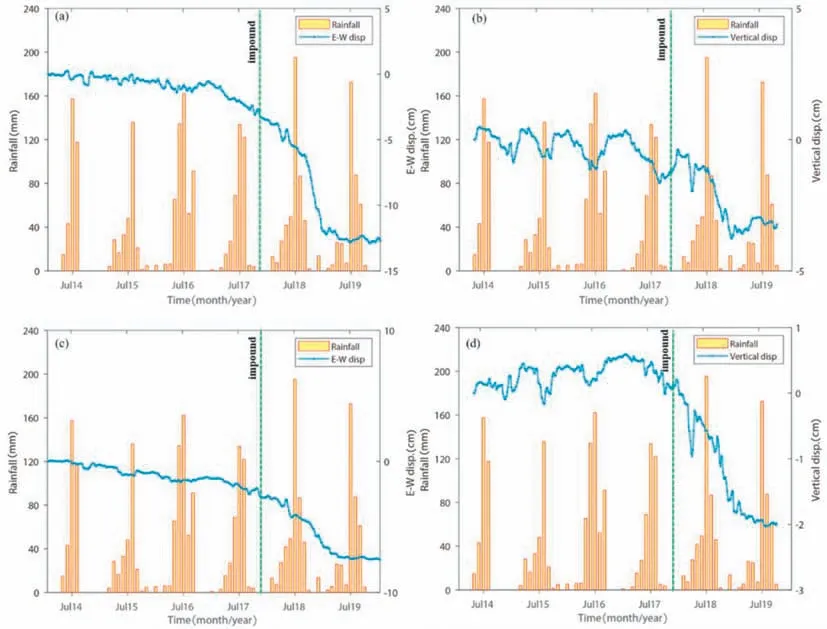
Fig.10.Cumulative displacements of the Yalong reservoir Landslide I in east-west (a) and vertical (b) directions at Point A.Cumulative displacements of the Yalong reservoir Landslide I in east-west (c) and vertical (d) directions at Point B.The orange bar represents rainfall data and the blue bar represents cumulative displacement data.
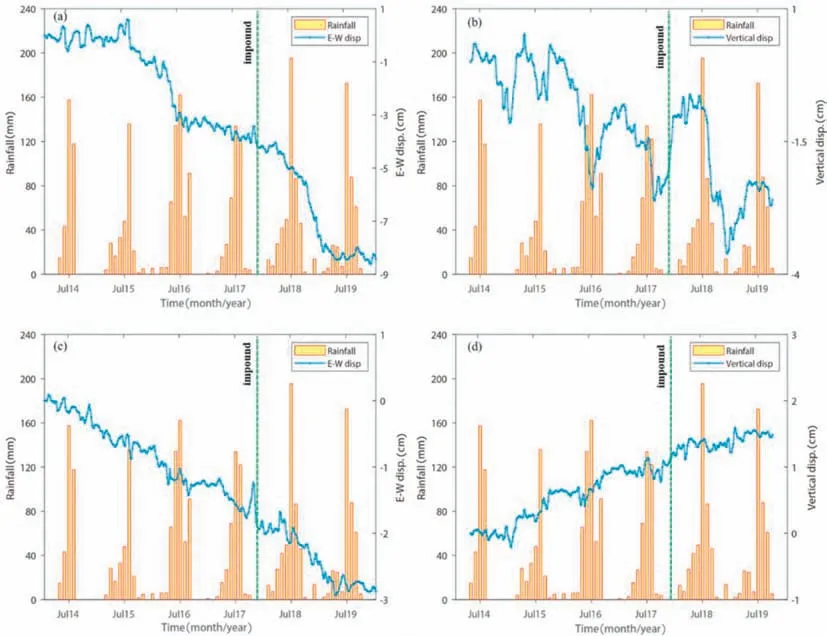
Fig.11.Cumulative displacements of the Yalong reservoir Landslide II in east-west (a) and vertical (b) directions at Point C.Cumulative displacements of the Yalong reservoir Landslide II in east-west (c) and vertical (d) directions at Point D.
Two feature points,namely the leading and trailing edges,were extracted for the analysis (Figs.6 and 11).Accordingly,Landslide II mainly occurred in the east-west direction.The cumulative displacements at Point C in the east-west and vertical directions were -80 and -20 mm,respectively.In addition,the cumulative displacements at Point D in the east-west and vertical directions were -30 and 15 mm,respectively.After the water-level impoundment in December 2017,the deformation showed a significant acceleration trend.However,both the acceleration and largest cumulative deformation were less than those observed for Landslide I.Landslide II has not completely recovered,but has appeared as a retrogressive landslide with destructive characteristics after the water-level impoundment.With the continued deformation,Landslide II will also be fully resurrected.
When Oscar the Cat visits residents of the Steere House Nursing and Rehabilitation1 Center in Rhode Island, the staff jump into action -- Oscar can sense within hours when someone is about to die.
5.2.3.Deformation analysis of Landslide III
Landslide III is located on the left bank of the Yalong reservoir(latitude:2854′1.75″N,longitude:9154′9.90″E).Although the site investigation did not reveal a landslide,the results of InSAR indicated a large landslide deformation,which should not be ignored.
Through the InSAR data analysis conducted from October 2014 to March 2020 (Figs.6 and 12),the vertical deformation of the landslide was found to be substantially larger than the east-west deformation.Two deformation feature points,namely leading and trailing edges,were also extracted for the analysis.The cumulative displacements at Point E in the east-west and vertical directions were -40 and -80 mm,respectively.In addition,the cumulative displacements at Point F in the east-west and vertical directions were -40 and -30 mm.Moreover,the deformation accelerated significantly after the completion of storage in December 2017.Landslides I and III are located close to the reservoir,whereas Landslide II is further away and has a low water level,and thus,will be less affected by the impoundments,but will still be affected.Similarly,the deformation in the middle front of Landslide III,which was speculated to be a retrogressive landslide,was larger than that in the rear.The landslide in this part is located close to the Yalong reservoir dam,and should be inspected by the relevant departments.
5.2.4.Dam deformation analysis
As shown in Figs.5 and 6,the dam's deformation is of large magnitude,and its stability is vital to the safety of life and property of downstream residents.Two feature points of the dam,as shown in Fig.13,were selected for the analysis.In the east-west direction,the deformations on the two sides of the dam were opposite,and the vertical direction was downward.The cumulative deformations at Point P1 in the east-west and vertical directions were 50 and -40 mm,respectively,and those at Point P2 were-10 and -20 mm.After the impoundment,there were different degrees of scour on the two sides of the dam,resulting in uneven forces induced on both sides and the occurrence of weak rotation deformation.The horizontal deformations on the two sides were also opposite.Dam deformation forms the foundation of reservoir safety evaluation,and thus,dams require continuous attention.
5.3.Genetic analysis of landslide
There was a periodic deformation signal in the vertical directions of Points A-F before and after the water storage(Figs.10-12).In July and August of each year,the cumulative displacement reached the maximum value.A comparison with the precipitation data indicated that the rainfall in the Yalong reservoir is mainly concentrated from June to September,which agrees well with the deformation result.After the impoundment,the horizontal deformation accelerated and the vertical deformation changed periodically under the joint action of rainfall and reservoir impoundment.

Fig.12.Cumulative displacements of the Yalong reservoir Landslide III in east-west (a) and vertical (b) directions at Point E.Cumulative displacements of the Yalong reservoir Landslide III in east-west (c) and vertical (d) directions at Point F.
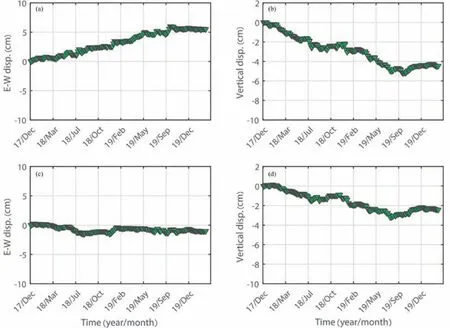
Fig.13.Cumulative displacements of the Yalong reservoir dam in east-west (a) and vertical (b) directions at Point P1.Cumulative displacements of the Yalong reservoir dam in east-west(c) and vertical (d) directions at Point P2.
6.Conclusion
Reservoir water storage can be used for flood control,power generation,water supply and irrigation.However,artificially raising the water level by tens of metres might modify the stress state and stability of the slope around the reservoir,which would induce surface deformation,landslides and other geological disasters in that area.Reservoir landslides can directly destroy buildings around the reservoir and reduce reservoir volume,as well as pose a threat to humans due to the secondary surge disaster.To this end,this study used the SBAS-InSAR method to monitor the large-scale deformation of the Yalong reservoir from 2014 to 2020.The following conclusions were drawn.
(1) By using SBAS-InSAR,we obtained the monitoring results for the surface deformation around the Yalong reservoir from October 2014 to March 2020.There was no evident deformation signal in the three Sentinel-1 datasets before water storage.The two large,slow-moving landslides identified on the right side of the Yalong reservoir in December 2017 after water storage were analysed.The maximum average deformation rates in the LOS direction were 30 and -60mm/a,respectively,which conformed to the field survey results.In addition,a third landslide was identified in the left area of the reservoir,and the maximum average deformation rate in the LOS direction was-30mm/a.The landslide was near the reservoir dam and was not found in the field survey,and should be inspected by the relevant departments.
(2) We also used MSBAS to obtain the 2Dtime-series deformation and 2D deformation rate of InSAR.The results showed no evident sign of landslides before the filling of the Yalong reservoir in December 2017.Since the beginning of December 2017,landslide deformation around the Yalong reservoir has accelerated,with the maximum average deformation rate in the east-west direction being-80 mm/a(positive in the east direction) and that in the vertical direction being -40 mm/a (positive in the vertical direction).Meanwhile,the landslide on the right bank of this area was mainly in the horizontal direction,whereas the left bank of the landslide mainly underwent vertical deformation.In addition,the deformation analysis of the dam showed that there was a weak horizontal rotation deformation of the dam,which should not be ignored.The GPS and InSAR timeseries deformation residual data were used to verify the accuracy of the InSAR methods.These results validated the accuracy of InSAR.
(3) An analysis of the deformation feature points on the landslide leading and trailing edges indicated that after the reservoir water storage began at the end of 2017,the three landslide deformations have exhibited evident acceleration.Moreover,the three landslide deformations of the leading edge were substantially higher than those of the trailing edge,indicating that all three landslide failure modes are retrogressive.With constant changes in the water level,the slope may be easily raised and trigger further landslides.
Conflicts of interest
None.
Acknowledgement
This work was partly supported by the National Natural Science Foundation of China(No.41804008),the National Science Fund for Distinguished Young Scholars(No.41925016)and the National Key R&D Program of China (No.2018YFC1503603).The Sentine-1 SAR data is downloaded from the Open Access Hub -Copernicus(https://scihub.copernicus.eu).
 Geodesy and Geodynamics2022年2期
- Geodesy and Geodynamics的其它文章
- Analysis of terrestrial water storage changes in the Shaan-Gan-Ning Region using GPS and GRACE/GFO
- Ocean tide loading correction for InSAR measurements:Comparison of different ocean tide models
- A review of methods for mitigating ionospheric artifacts in differential SAR interferometry
- Co-and post-seismic slip analysis of the 2017 MW7.3 Sarpol Zahab earthquake using Sentinel-1 data
- Extraction and analysis of saline soil deformation in the Qarhan Salt Lake region (in Qinghai,China) by the sentinel SBAS-InSAR technique
- Review of the SBAS InSAR Time-series algorithms,applications,and challenges
