
Mitigation of time-series InSAR turbulent atmospheric phase noise:A review
2022-03-26 09:04:30ZhiweiLiMengDuanYunmengCaoMinzhengMuXinHeJianchaoWei
Geodesy and Geodynamics 2022年2期
Zhiwei Li,Meng Duan,Yunmeng Cao,Minzheng Mu,Xin He,Jianchao Wei
School of Geosciences and Info-Physics,Central South University,Changsha 410083,Hunan,China
Keywords:InSAR Turbulent atmospheric phase Variance and covariance matrix Stochastic model Deep learning
ABSTRACT Synthetic Aperture Radar (SAR) interferometry is one of the most powerful remote sensing tools for ground deformation detection.However,tropospheric delay greatly limits the measurement accuracy of the InSAR technique.While vertically stratified tropospheric delays have been extensively investigated and well tackled,turbulent tropospheric phase noise still remains an intractable issue.In recent years,great efforts have been made to reduce the influence of turbulent atmospheric delay.This contribution is intended to provide a systematic review of the progress achieved in this field.First,it introduces the physical characteristics of atmospheric signals in interferograms.Then,a review of the main mitigation algorithms proposed in the literature is provided.In addition,the strengths and weaknesses of each approach are analyzed to provide guidance for choosing a suitable method accordingly.Finally,suggestions for resolving the challenging issues and an outlook for future research are given.
1.Introduction
Interferometric Synthetic Aperture Radar(InSAR)technique is a new type of space geodetic and remote sensing tool,which combines synthetic aperture radar and interferometric technique,with all-time,all-weather and continuous large-scale observations and other advantages [1].It has been widely used to monitor surface deformation caused by natural disasters such as earthquakes,volcanoes,landslides,glacier movements,and human activities (e.g.,coal mining and groundwater extraction) [2-7].
With the improvement of Synthetic Aperture Radar (SAR) satellite imaging technique,increasing number of SAR satellites have been launched.Especially for Sentinel-1A/B satellites,the revisit time has been shortened to 6 days mainly in America and Europe,providing a growing number of SAR images and interferograms[8].This facilitates unprecedented application of the InSAR technique.However,the reliability and accuracy of InSAR measurements are mainly limited by atmospheric delays,which include ionospheric and tropospheric parts [9].The former can be separated from the interferogram by using a polynomial function,and its influence on the C-band is limited [10,11].The tropospheric delay is caused by variations in temperature,pressure and relative humidity in the spatial and temporal domains [12].A previous study pointed out that 20% variations in the relative humidity in the troposphere could result in 10-14 cm errors in deformation measurements and 80-290 m bias in topographic estimations with spatial baselines ranging from 100 m to 400 m[12].Therefore,we only discussed the mitigation of tropospheric delay in this paper.
This paper was organized as follows.Section 2 introduced the physical characteristics of turbulent atmospheric phases in interferograms.Section 3 systematically reviewed the progress carried out in correcting turbulent atmospheric delays.Then,a discussion of the challenges and conclusions followed in Sections 4 and 5,respectively.
2.Physical characteristics of the atmospheric delay
2.1.Theory of atmospheric propagation delay
Since the atmospheric distribution is different in each time period,the atmospheric delay is inevitable and can be written as[9]:

r
)is the atmospheric delay of pixelr
in line of sight(LOS)direction,and θ andH
represent the incidence angle of the radar and the height of the satellite,respectively.According to Hanssen,the atmospheric refraction (i.e.,N
in equation(1))in the three-dimensional space could be decomposed into vertical stratification and horizontal turbulence parts [9].Therefore,equation (1) could be rewritten as the sum of the stratification delay and turbulence mixing: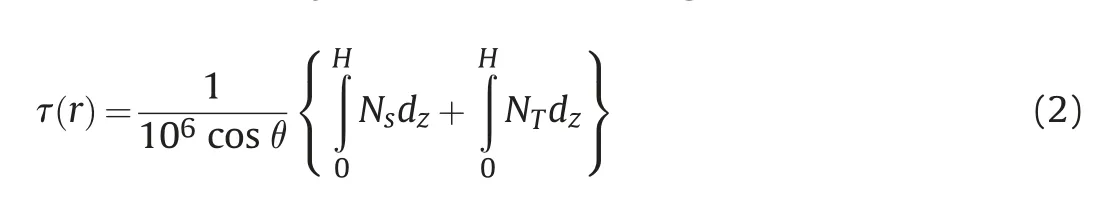
N
andN
represent the refraction of vertical stratification and horizontal turbulence,respectively.2.2.Vertical stratified atmospheric delay in InSAR

2.3.Turbulent mixing atmospheric delay in InSAR
Turbulent mixing is caused by a series of different turbulence processes in the atmosphere.Unlike the vertical stratified atmospheric delay,the turbulent delay is hard to describe by using a deterministic model because of its variability in the spatial and temporal domains [15].
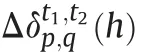
It is assumed that the turbulent atmosphere is isotropic,and the spatial variation in the refractivity obeys the Kolmogorov power turbulence law,the structure function(i.e.,D
(ρ))can be written as[13]: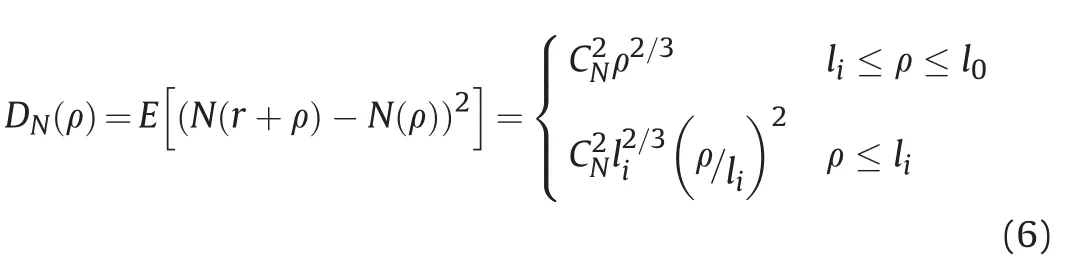

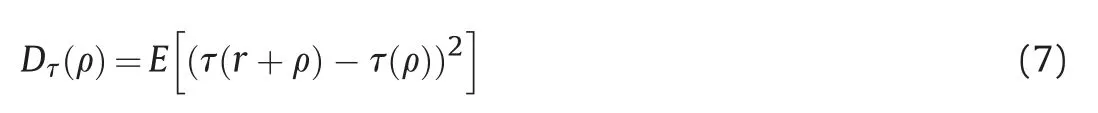
where τ(·)is the atmospheric delay in the LOS direction.Obviously,equation (7) reflects the degree of decorrelation of atmospheric turbulence with increasing distance.
According to the regionalized variable theory in geo-statistics,the corresponding experimental variogram (i.e.,γ(ρ)) can be calculated by:

Then,the experimental variogram can be estimated based on equation(8)and atmospheric turbulence samples.Subsequently,a number of empirical models have been commonly used to approximate the structure function of the spatial delay of the turbulent atmosphere[14,18].
2.4.Examples of atmospheric delay
In order to better understand the atmospheric delay in the interferogram,an interferometric pair in southern California is used for analysis.Fig.1(a)shows the study area covered by the Sentinel-1A image,and the acquisition time epochs of the two SAR images are 24 September 2017 and 6 October 2017.As shown in Fig.1(b),the corresponding differential interferometric phase can be obtained according to the standard Differential InSAR (D-InSAR)algorithm.
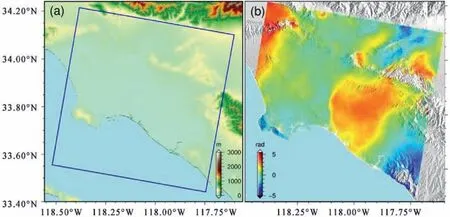
Fig.1.(a) Blue rectangle over the shaded relief map indicates the study area.(b) The corresponding differential interferometric phase.
Since the time interval between these two images is only 12 days,the effects of surface deformation can be ignored.To reduce the influence of decorrelation noise,pixels with low coherence have been masked.Therefore,the main component of the unwrapped differential phase in Fig.1(b) is atmospheric delay.
Subsequently,the stratified atmospheric phase can be approximately calculated (as shown in Fig.2(a)) by establishing a linear function between the interferometric phase and the elevation of each pixel.Subtracting the vertical stratified atmospheric phase(i.e.,Fig.2(a)) from the original differential interferogram (i.e.,Fig.1(b)),the residual phase (i.e.,Fig.2(b)) can be approximately regarded as the turbulent mixing atmospheric delay.
3.Progress of the InSAR turbulent atmospheric phase noise mitigation
3.1.Mitigation of turbulent atmospheric effects with the stacking method
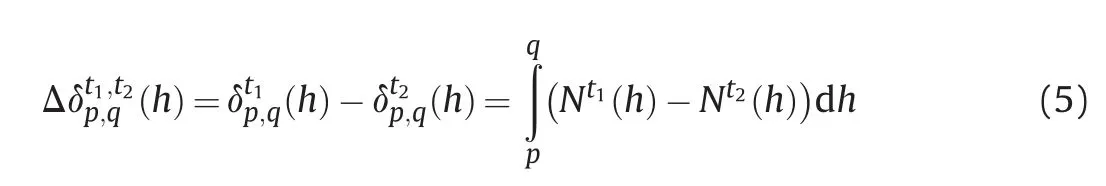
Based on the random nature of the turbulent atmospheric phase in the time domain,an interferogram stacking technique was presented to reduce the effects of atmospheric delay and to obtain reliable deformation results[19].In fact,this method assumed that the displacement phase increased linearly,whereas the other terms were random,which could be reduced significantly after averaging the interferometric phases.
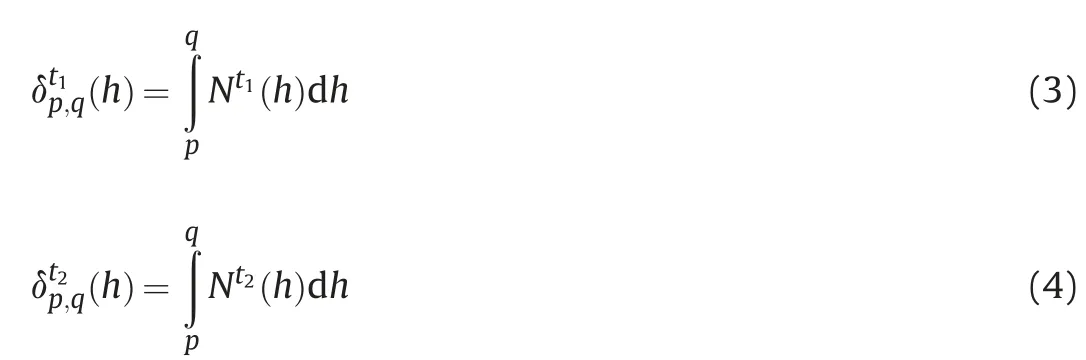
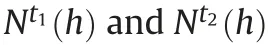
For example,considering two interferograms with acquisition datest
,t
(common data) andt
,the differential phase in each interferogram can be expressed as follows:
t
,and Δøand Δτare the differential phase and ground deformation phase between thei
th and(i
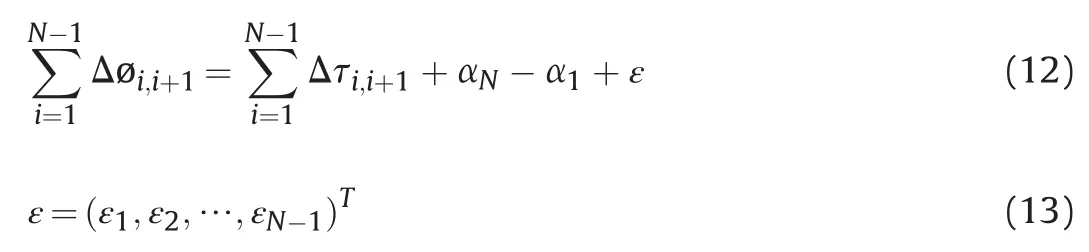
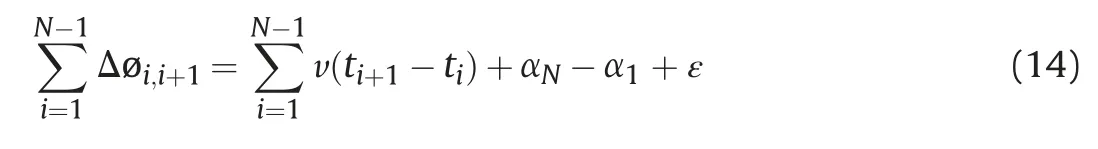
+1)th time epochs,respectively.εdenotes noise.Adding equations (9) and (10)together and ignoring the noise part,we can obtain: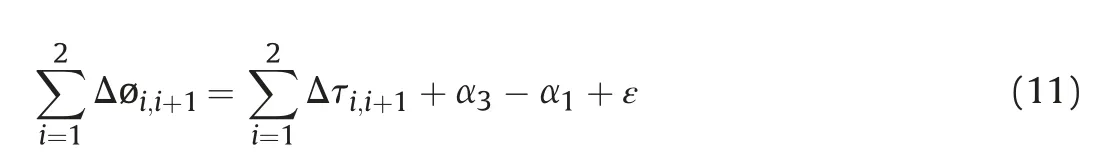
N
SAR images acquired at the corresponding time epocht
=(t
,t
,…,t
),equation (11) can be expressed as:
Fig.2.Estimation of atmospheric delay.(a) Stratified atmospheric phase,and (b) turbulent atmospheric phase.
According to the linear deformation,equation (12) can be written as:
The classical stacking method ignored the turbulent atmosphere in the first and last SAR images.The average deformation velocity v is computed as [19]:
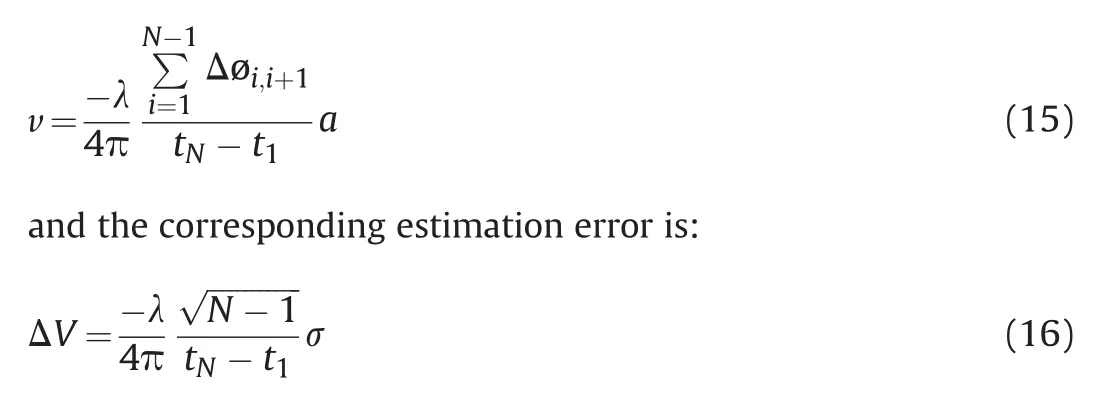
where λ is the wavelength and σ represents the phase error of each interferogram.Although this method is simple and easy to implement,there are still atmospheric artifacts partially present in this technique.
To estimate the turbulent atmospheric phase in each SAR image and further mitigate atmospheric effects,Tymofyeyva developed the classical stacking method by differencing the two interferograms[20],i.e.,Δø-Δø:

Under the assumption of equal time spans and deformation occurring at a constant rate,equation (17) can be written as:

N
SAR images andi
th is the common master image,equation (18) can be expressed as: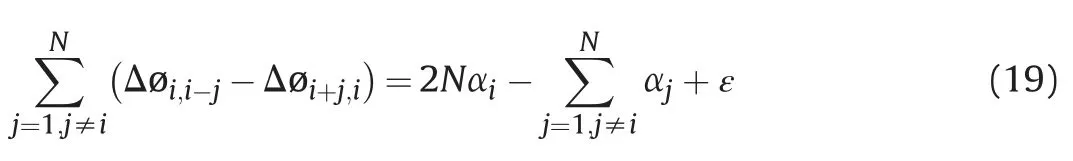
N
increases,namely: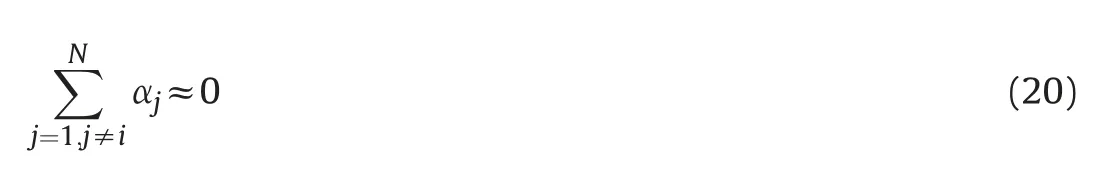
According to equations(19)and(20),the turbulent atmospheric phase of the master SAR image is:
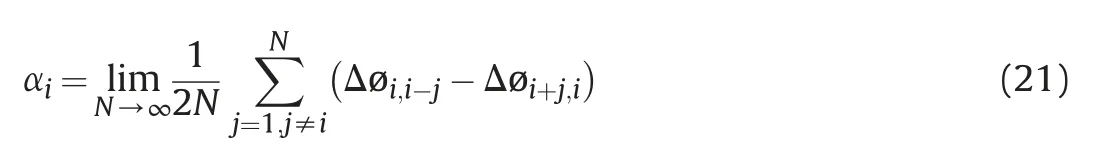
To minimize decorrelation noise,equation (21) is written as:

Subsequently,the estimated atmospheric phase is subtracted from the radar interferograms,and thus the ground deformation can be easily accomplished.
Tymofyeyva tested this algorithm by using synthetic data firstly and found 95% of the turbulent atmospheric signal can be recovered[20].Meanwhile,the estimated ground subsidence had a good agreement with continuous GPS data.In addition,the results from the eastern California also demonstrated the robustness and effectiveness of this method.
This method took advantage of the interferograms with common SAR images and same turbulent atmospheric delay phases,and estimated them to improve the measurement of deformation.However,the time baselines of the interferograms used in the averaging procedure should be equal,and the subsidence should be linear in time.
3.2.Mitigation turbulent atmospheric phase by using the filtering method
As mentioned above,the stacking technique could only be used to estimate linear deformation,which is not proper in many situations.The Persistent Scatterer InSAR (PS-InSAR) was proposed to precisely measure complex ground displacement[21].The classical PS-InSAR algorithm operates on a time series of interferograms all formed with respect to a single common master SAR image.The whole tropospheric delays in each interferogram are first reduced by taking the phase difference between nearby PS pixels.Then,the contribution from ground deformation is modeled and separated from the observed interferometric phases.The remaining phase includes mainly unmodeled deformation,atmospheric delay,and random noise.As the atmospheric phase of the master image obtained from the PS-InSAR is common to all of the differential interferograms,it is acquired by averaging these residual phases in the time series.Under the assumption that the unmodeled deformation is correlated but tropospheric delays and decorrelated noise are uncorrelated in the temporal domain,atmospheric delays and decorrelation noises in slave acquisitions can be separated from the unmodeled subsidence by using temporal high-pass filtering.Furthermore,the tropospheric delays and decorrelation noises can be separated by using spatial low-pass filtering under the assumption of correlation of the tropospheric delays but uncorrelation of noise in spatial domain.
As stated previously,the vertical stratification atmosphere can be estimated by using a functional model.In addition,only the turbulent atmosphere in tropospheric delays showed high variability in temporal domain.Therefore,the former was always fitted by a model related to the topography with differential interferometric phase separation.Subsequently,the spatial-temporal filtering method was used for tackling the turbulent delays.Fig.3 gives an example of the deformation rate of the southern California by the PS-InSAR technique [22].
If there are not enough dominant scatterers in the resolution elements,the deformation signal may be obscured by decorrelation noise.To overcome this problem,short time and spatial baseline interferograms,namely,the Small Baseline Subset(SBAS)approach were proposed[23].To further decrease the effects of decorrelation noise,interferograms acquired from the SBAS-InSAR technique were multi-looked.After removing the vertical stratification atmospheric delays and the residual topographic phase,the SBASInSAR approach determined the residual phases of each SAR acquisition by using the singular value decomposition (SVD) algorithm.Similar to the PS-InSAR technique,the turbulent atmospheric component can be extracted from the residual phases by using the spatial low-pass filtering and a temporal high-pass filtering in SBAS-InSAR [24].Once the turbulent atmosphere has been estimated and subtracted,the unmodeled deformation signal can be evaluated from the residual phase.Li et al.acquired 21 ENVISAT ASAR images to monitor temporal evolutions of Qinghai-Tibet Plateau by using the SBAS-InSAR technique [25].The estimated deformation sequences conformed well with physical characteristics of permafrost in this area.
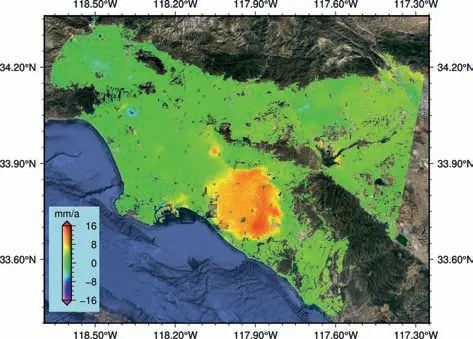
Fig.3.Ground deformation velocity map by using the PS-InSAR technique.
Although the method seems simple to implement and with high efficiency,the filter is not adaptive,and the filter function and windows are dependent on the users.Moreover,the spatialtemporal filtering approach assumed a Gaussian distribution of turbulent atmospheric signals,which cannot be applied to many situations.
3.3.Mitigation of turbulent atmospheric phase by using the stochastic model
Considering the abovementioned limitations of the stacking and filtering method,the potential of stochastic modeling of turbulent atmosphere in time series InSAR has been explored.In 2011,González and Fernández estimated the variance of the turbulent atmospheric phase in each interferogram by using the zero-order Bessel and exponential decay function model directly [26].Subsequently,the variance of the turbulent atmospheric phase at each specific epoch can be obtained by averaging the estimated variances of these interferograms with a common SAR image.In González's method,the turbulent atmospheric variance of a SAR image was regarded as the covariance of two interferograms that shared this SAR image.Based on this,the variance and covariance matrix (VCM) of turbulent atmospheric signals could be established.Combining with the VCM of decorrelation noise,a stochastic model has been established and can be used to reduce the effect of the turbulent atmospheric phase.However,the covariance(i.e.,the off-diagonal elements) of the turbulent atmosphere VCM is considered positive in González's method.This may be unreasonable when the common SAR image plays a“master”and“slave”image in the two interferograms.
To correct it,Graph Theory (GT) has been applied to the time series InSAR (TS-InSAR) technique for stochastic models [27].This method regards each SAR image and interferogram as vertex and edge,respectively.Based on GT,the design matrix G was formulated to describe the time dependence of InSAR data.Combining with the design matrix G,this approach estimates VCM (i.e.,the stochastic model) by the Laplace transformation.This operation can ensure that the covariance (i.e.,the off-diagonal elements) of the VCM is negative when the common image acts as a“master”and“slave”image in the two interferograms.Although it is easy to implement and computationally efficient,this approach is based on the whole interferogram.In other words,the VCMs of all pixels in each interferogram are equal.Obviously,it is unreasonable since the noise level of each pixel in the same interferogram is different.Furthermore,the calculated VCM did not consider the physical characteristics of turbulent atmosphere.
To overcome the aforementioned problems,the networkbased variance covariance estimation (NVCE) method was proposed [18].It first used geostatistical knowledge to estimate the spatial variances of the turbulent atmosphere of interferograms in time series.Then,it calculated the SAR image's variance based on the network of small baseline interferograms and the error propagation law.Meanwhile,the structure function of the turbulent atmosphere in each SAR image was modeled.Finally,the stochastic model(i.e.,VCM)of the interferograms in a time series was established.It should be noted that the NVCE method does not take into account the turbulent atmospheric covariance of interferograms in the spatial domain either.Considering this means an enormous VCM size,which is still a major challenge at present [26,28,29].
A study on the Kilauea caldera volcano that erupted on 3 May 2018 was carried out to validate the effectiveness of the NVCE method [29,30].Fig.4(a) shows the study area covered by 24 descending Sentinel-1A images.There are 163 interferograms under the conditions with a temporal baseline threshold of 145 days and a spatial baseline threshold of 100 m.The spatial-temporal baselines of these 163 interferograms are shown in Fig.4(b).According to the standard D-InSAR,we can obtain 163 unwrapped differential interferogram phases and corresponding coherence maps.
Fig.5(a),(b) and (c) represent the VCM of the turbulent atmosphere from the NVCE method,VCM of the decorrelated noise and the sum of (a) and (b) on the MOKP site,respectively.Due to the remarkable similarity of Fig.5(a)and(c),the turbulent atmospheric delay is the main error source for the MOKP site compared with the decorrelation noise.
Based on the VCM of the turbulent atmosphere and decorrelation noise(i.e.,Fig.5(c)),we establish a stochastic model and obtain the deformation of the MOKP site in time series(i.e.,Fig.6(b)).For comparison,Fig.6(a) presents the corresponding result by normal least squares.The root mean square error (RMSE) of these two methods are 1.023 cm and 1.477 cm,respectively.This indicates an approximately 31% improvement of the stochastic model over the normal least square.
Repeating these two algorithms to each pixel in the SAR image,the mean deformation velocity of the study area can be estimated,as shown in Fig.7.The result under the normal least square method shows some differences compared with the stochastic model method (i.e.,Fig.7(b)),especially in the Kilauea caldera.
To perform a quantitative analysis,GPS measurements are regarded as the truth,and Fig.8 displays the estimated RMSEs of each GPS site under these two methods.Obviously,the RMSEs of the stochastic model are smaller at the most GPS sites than those of the traditional method.The average RMSEs of these two methods are 1.79 cm and 1.66 cm,respectively.It indicates the improvement of the stochastic model.However,a few sites show poorer performance for the stochastic model than for the traditional method.This may be owing to no consideration was given to the covariance of the turbulent atmospheric phase of the interferogram in the spatial domain.As mentioned in other studies,this is still a major challenge at present [26,28,29].
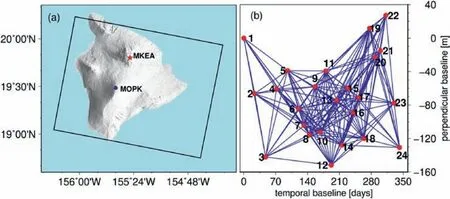
Fig.4.(a)Black rectangle contour denotes the study area,and the red star and the blue dot are the reference point and the location of the MOKP site,respectively.(b)The spatialtemporal baselines of interferograms selected by using the traditional method,red dots and blue edges are the corresponding image time epochs and interferograms,respectively[29].
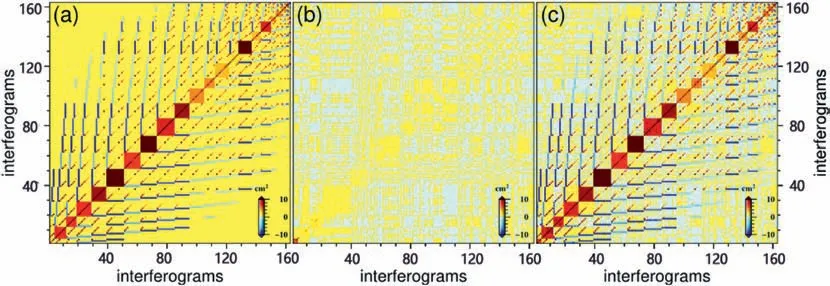
Fig.5.(a) VCM of the turbulent atmosphere.(b) VCM of the decorrelation noise.(c) The total VCM of the 163 interferograms in the time domain [29].

Fig.6.Comparison between the InSAR-derived time series displacement (blue stars with black error bars) and GPS daily observations in the LOS direction (gray triangles) at site MOKP.(a) and (b) show the results from the unweighted method and the VCM of the turbulent atmosphere are calculated from the NVCE method [29].
3.4.Mitigation of the turbulent atmospheric phase by the interferogram optimization
As most interferograms inevitably contain atmospheric signals and turbulent atmosphere are hard to model at present,an adaptive optimization selection method of interferograms before establishing stochastic models has been proposed [31].Unlike the traditional temporal and spatial threshold method,the new method generates all possible interferograms from SAR images in time series first.Subsequently,the turbulent atmospheric variances of each interferogram and SAR image can be estimated according to the NVCE algorithm [18,29].Based on these variances,SAR images and interferograms regarded as seriously polluted by turbulent atmosphere are discarded.The minimum spanning tree (MST) algorithm of GT was applied to the remaining interferograms to obtain the least number and highest quality interferograms(i.e.,the minimum variance of turbulent atmosphere) to connect these selected SAR images [32].Meanwhile,redundant interferograms for SBAS-InSAR can be adaptively identified from the residual interferograms by using mathematical statistics.Now,the selected total interferograms for detecting deformation are the total of MSTbased interferograms and the redundant interferograms.
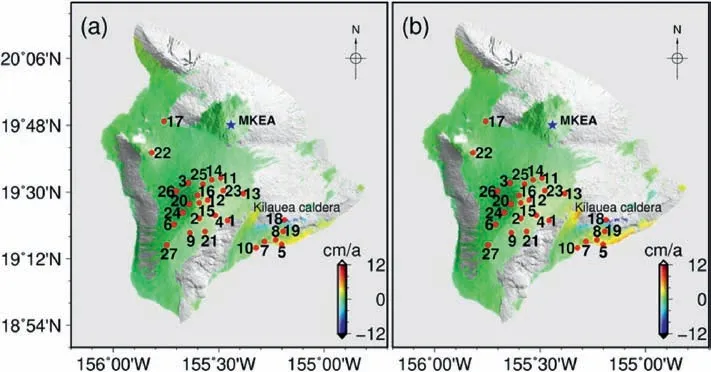
Fig.7.(a)and(b)show the mean deformation velocity of the study area obtained by using the normal least square method,and the new method,respectively.Red dots represent the 27 GPS stations used for validation,and the corresponding names are AINP,ALAL,ALEP,ANIP,APNT,BLBP,KAON,KEAW,KHKU,KULE,MLCC,MLES,MLPR,MLRD,MLSP,MOKP,NIHO,NUPM,PG2R,PHAN,PIIK,PMAU,PUKA,SLPC,STEP,TOUO and YEEP [29].
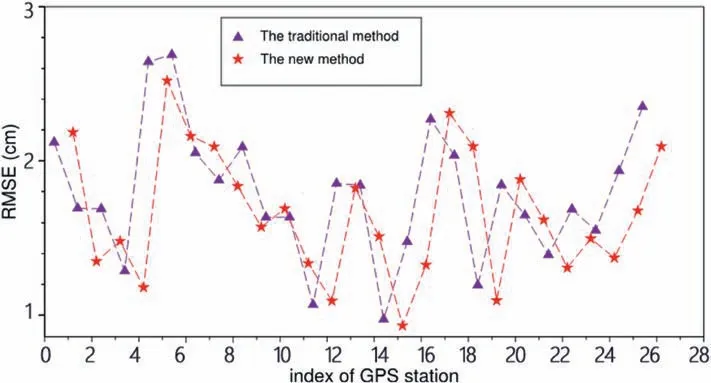
Fig.8.RMSEs of the displacement in the time series under the traditional (purple triangles) and the new method (red stars),respectively [29].
The main purpose of this new interferogram selection method is to ensure that the interferograms that participate in calculating deformations contain less turbulent atmospheric signals.Finally,the stochastic model introduced in Section 3.3 can be used for the selected quality-interferogram to further reduce the influence of atmospheric turbulence delays.
To validate the reliability,this proposed interferogram selection method was applied in Hawaii.A set of 24 descending Sentinel-1A SAR images were acquired for the period from 5 January 2018 to 12 December 2018.Thus,276 interferograms were generated from any two combined images.Each interferogram was multilooked with 4 pixels in range and 20 pixels in azimuth directions.Meanwhile,precise orbit data was used to correct the orbit phase.In addition,data from 27 GPS stations of the Nevada Geodetic Laboratory were collected for validation and the MKEA site was used as the reference point for each interferogram.The topography phase and vertical atmospheric phase could be removed by the external digital elevation model (30 m) from the SRTM and a second order polynomial [33].Subsequently,the improved Goldstein filter and the MCF algorithm were carried out for each interferogram.
According to the algorithm of the proposed method,162 highquality interferograms can be selected for SBAS-InSAR.To achieve the same number of interferograms selected by the proposed method,the traditional temporal-spatial baseline threshold was set to 89 m and 160 days.Fig.9(a) and (b) show the corresponding spatial and temporal baseline distributions from the proposed and traditional methods,respectively.
Comparing Fig.9(a) and (b),there are 54 interferograms that show different spatial-temporal baseline distribution from the two methods.In addition,Fig.10(a) represents the variances of the 54 interferograms selected only by the proposed method,not the traditional method.Fig.10(b) is the variances of the 54 interferograms selected by the traditional method,not the proposed method.Obviously,the variances in Fig.10(a) are smaller than the variances in Fig.10(b) on the whole.Moreover,the corresponding average values of the variances in Fig.10(a) and (b) (i.e.,the black line in Fig.10) are 16.42 mmand 44.69 mm,respectively.This means that the average variance of the traditional method is approximately 2.7 times than that of the proposed method.This illustrates the superiority of the proposed method.Meanwhile,it also indicates that the traditional method missed several highquality interferograms with unfavorable spatial-temporal baselines and selected low-quality interferograms.
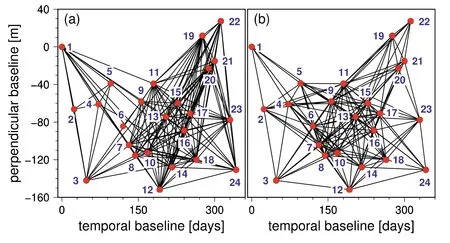
Fig.9.(a) and (b).Spatial and temporal baseline distribution of the 248 selected interferograms from the proposed method and the traditional method,respectively.Red dots represent the image time epoch and edges represent the interferogram [31].
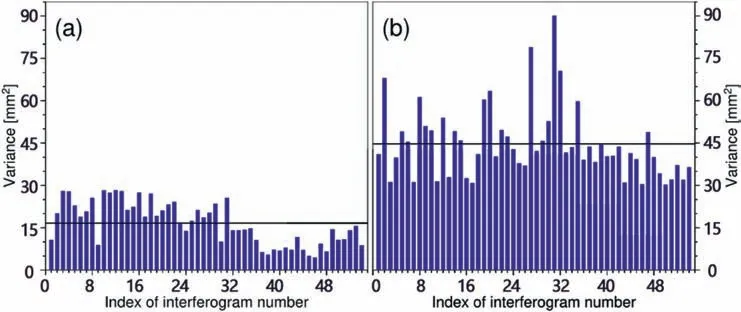
Fig.10.(a)and(b).Variances of the different interferograms selected by the proposed and traditional methods,respectively.Black lines denote the mean variance for each method[31].
According to the stochastic model mentioned in Section 3.3,the mean velocities can be obtained on the basis of the two different interferograms (i.e.,Fig.9(a) and (b)).To better validate the proposed method,the time series displacements of the 27 collected GPS stations are calculated under the two selected interferograms(i.e.,Fig.9(a)and(b)).Subsequently,the corresponding RMSEs are shown in Fig.11.
From Fig.11,we can see that the RMSE under the proposed algorithm is smaller than that of the traditional on the whole.Meanwhile,the average RMSEs of these two methods indicate a 0.57% improvement of the proposed algorithm.This illustrates the reliability of the proposed method.It should be noted that there are a few GPS stations with larger RMSEs in the proposed method.This may be caused by the weighting method used in this paper.However,weighting is beyond the current scope and therefore can be explored in the future.
3.5.Mitigation of the turbulent atmospheric phase by using a deep learning method
In recent years,deep learning has been widely used in InSAR techniques,such as phase unwrapping,volcano deformation detection,InSAR filtering and coherence estimation[34-36].These previous studies have shown the ability of deep learning algorithms to learn phase patterns from input interferograms.Taking advantage of this feature,an attention-based deep residual U-shaped network (ARU-Net) method based on deep learning has been proposed to mitigate turbulent atmospheric delays in TS-InSAR [37].This approach includes the U-Net subnetwork to obtain richer features from interferograms,attention gates to ensure that the network is more concerned about informative features,and a single residual learning mechanism to speed up the learning process and predict the residual image.With this algorithm,turbulent atmospheric phases and short temporal baseline interferograms,which are regarded as no deformation phases,are sampled from InSAR interferograms to train the network.
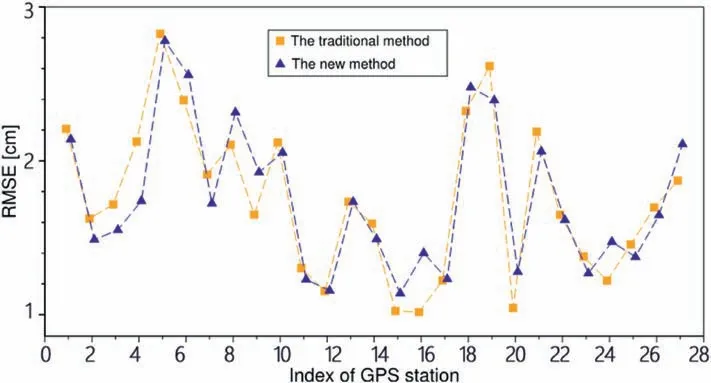
Fig.11.Comparison of RMSEs of the traditional method (orange rectangles) and the proposed method (blue triangles) [31].
To ensure enough atmospheric signal and training data diversity for the network,a generative adversarial network(GAN)is inserted into the ARU-Net algorithm to generate more samples from input data.Then,the atmospheric delay can be calculated from the attention-based U-Net subnetwork based on these samples.In addition,feature information from attention gates and original interferograms are propagated to the modularity of a single residual to estimate the residual mapping between the distorted and latent clean patches.This step mitigates the turbulent atmosphere from the original interferograms.However,clean interferogram patches only containing turbulent atmospheric phases are a precondition for this method.
4.Challenges and perspectives of turbulent atmospheric phase mitigation
4.1.Optimization of filtering function and parameters
Benefiting from simple implementation,the filtering method is widely used to mitigate turbulent atmospheric delay in the TSInSAR technique.As mentioned above,however,the mitigation accuracy of the turbulent atmosphere is mainly dependent on the filtering function and the optimal window length in the time and spatial domains.Obviously,a good filter window should not only reflect the degree of correlation length of the unmodeled deformation,but also vary from one pixel to another.Therefore,a more adaptive filter should be developed to prevent users from specifying the corresponding filter parameters.In addition,the varying magnitude of the turbulent atmospheric phase in each SAR image should also be taken into account in the filtering method.This means that an optimal filtering method should weight all acquired SAR images according to the magnitude of the turbulent atmosphere.
4.2.Accurate estimation of the structure function
As mentioned above,the structure function of the turbulent atmosphere plays a crucial role in describing the spatial correlation properties of atmospheric signals.As shown in Table 1,a number of empirical models have been proposed to estimate the structure function of the turbulent atmosphere.However,there is no common standard to guide empirical models for users.Therefore,comparison and selection among these models should be appropriately evaluated in the future.Furthermore,the anisotropic characteristics of the turbulent atmosphere in interferograms should be considered in the structure function to satisfactorily meet the physical and statistical properties of atmospheric delay.
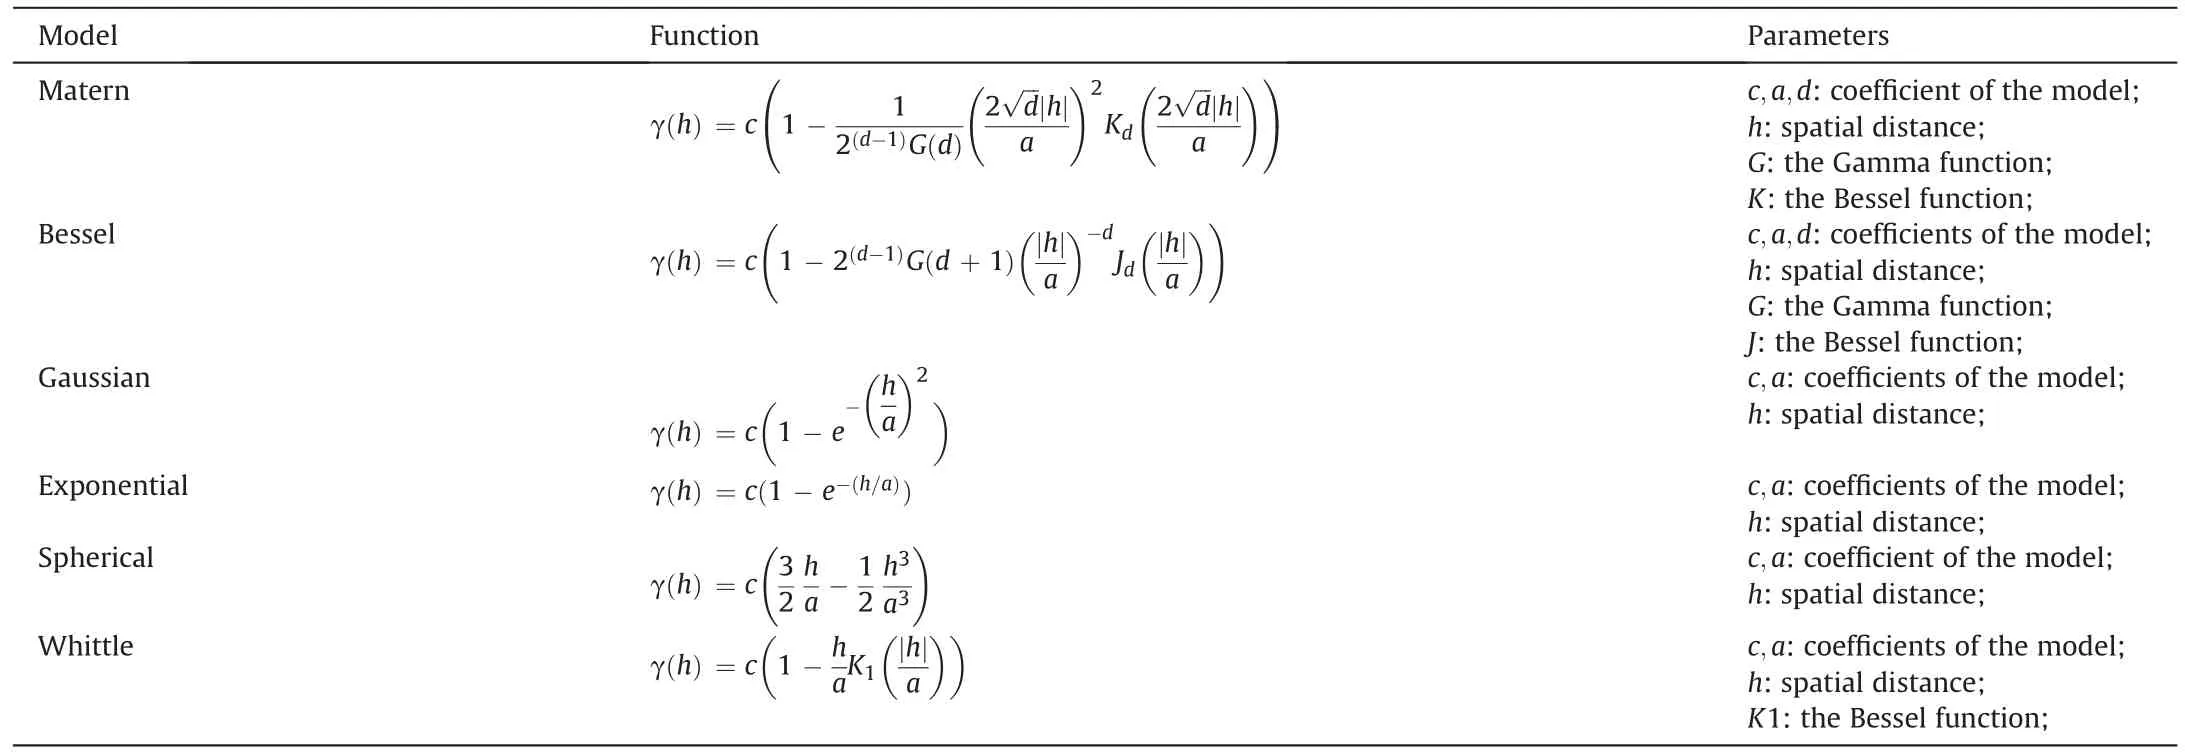
Table 1 Common structure function model.
5.Conclusions
InSAR is one of the most powerful geodetic techniques for providing high spatial resolution ground deformation results over large areas.With the development of InSAR data processing algorithms,it has become a relatively mature technique and has been applied to measure ground subsidence and topography.However,turbulent atmosphere delay limits the measurement accuracy of InSAR.Several approaches,which have been well developed to reduce the influence of turbulent atmospheric signals,are presented in this paper.
Besides,the European Centre for Medium-Range Weather Forecasts (ECMWF) and the National Centers for Environmental Prediction (NCEP) reanalysis data have been demonstrated useful to reduce tropospheric phases [38].Meanwhile,the Generic Atmospheric Correction Online Service (GACOS) products has been used for the atmospheric correction of InSAR [39].These methods have showed their successfulness in mitigating tropospheric delays,especially for the elevation-dependent and long-wavelength components.However,the spatial resolutions of these external datasets are always too low to accurately capture the turbulent atmosphere phase.
As each of these methods has their respective advantages and disadvantages,the most favorable approach for correcting turbulent atmosphere should be chosen according to the condition of the study area.In the future,more experiments should be conducted to validate the accuracy and effectiveness of the turbulent atmosphere mitigation methods.
Conflicts of interest
The authors declare that there is no conflicts of interest.
Acknowledgment
This work was partly supported by the National Science Fund for Distinguished Young Scholars,grant number 41 925016;the National Natural Science Foundation of China,grant number 41804008.
 Geodesy and Geodynamics2022年2期
- Geodesy and Geodynamics的其它文章
- Analysis of terrestrial water storage changes in the Shaan-Gan-Ning Region using GPS and GRACE/GFO
- Ocean tide loading correction for InSAR measurements:Comparison of different ocean tide models
- A review of methods for mitigating ionospheric artifacts in differential SAR interferometry
- Co-and post-seismic slip analysis of the 2017 MW7.3 Sarpol Zahab earthquake using Sentinel-1 data
- Monitoring landslide associated with reservoir impoundment using synthetic aperture radar interferometry:A case study of the Yalong reservoir
- Extraction and analysis of saline soil deformation in the Qarhan Salt Lake region (in Qinghai,China) by the sentinel SBAS-InSAR technique