Active forest management accelerates carbon storage in plantation forests in Lishui,southern China
Jiaojiao Diao ,Jinxun Liu ,Zhiliang Zhu ,Xinyuan Wi ,Mingshi Li,*
a College of Forestry,Nanjing Forestry University,Nanjing 210037,China
b Co-Innovation Center for Sustainable Forestry in Southern China,Nanjing Forestry University,Nanjing 210037,China
c U.S.Geological Survey Western Geographic Science Center,Moffett Field,CA 94035,USA
d U.S.Geological Survey,Reston,VA 20192,USA
e Environmental Sciences Division,Oak Ridge National Laboratory,Oak Ridge,TN 37830,USA
Keywords:Active forest management Carbon storage IBIS Plantations STSM
ABSTRACT Background: China has committed to achieving peak CO2 emissions before 2030 and carbon neutrality before 2060;therefore,accelerated efforts are needed to better understand carbon accounting in industry and energy fields as well as terrestrial ecosystems.The carbon sink capacity of plantation forests contributes to the mitigation of climate change.Plantation forests throughout the world are intensively managed,and there is an urgent need to evaluate the effects of such management on long-term carbon dynamics.Methods:We assessed the carbon cycling patterns of ecosystems characterized by three typical plantation species(Chinese fir (Cunninghamia lanceolata (Lamb.) Hook.),oak (Cyclobalanopsis glauca (Thunb.) Oerst.),and pine(Pinus massoniana Lamb.))in Lishui,southern China,by using an integrated biosphere simulator(IBIS)tuned with localized parameters.Then,we used the state-and-transition simulation model (STSM) to study the effects of active forest management (AFM) on carbon storage by combining forest disturbance history and carbon cycle regimes.Results:1)The carbon stock of the oak plantation was lower at an early age(<50 years)but higher at an advanced age(>50 years)than that of the Chinese fir and pine plantations.2)The carbon densities of the pine and Chinese fir plantations peaked at 70 years(223.36 Mg•ha-1)and 64 years(232.04 Mg•ha-1),respectively,while the carbon density in the oak plantation continued increasing(>100 years).3)From 1989 to 2019,the total carbon pools of the three plantation ecosystems followed an upward trend(an annual increase of 0.16-0.22 Tg C),with the largest proportional increase in the aboveground biomass carbon pool.4)AFM increased the recovery of carbon storage after 1996 and 2009 in the pine and Chinese fir plantations,respectively,but did not result in higher growth in the oak plantation.5) The proposed harvest planning is reasonable and conducive to maximizing the carbon sequestration capacity of the forest.Conclusions: This study provides an example of a carbon cycle coupling model that is potentially suitable for simulating China's plantation forest ecosystems and supporting carbon accounting to monitor peak CO2 emissions and reach carbon neutrality.
1.Introduction
Global warming,which is mainly caused by the increasing carbon emissions released from the combustion of fossil fuels,deforestation,forest fires and land use changes,is becoming the most critical environmental issue (Fearnside,2006).The area of naturally regenerated forests has decreased since 1990(at a declining rate of loss);however,the area of planted forests has increased by 123 million ha according to the Global Forest Resources Assessment 2020 (FAO,2020).Increases in planted forests can enhance forest vegetation coverage,accelerate aboveground carbon storage,and enable the forest floor to accumulate more litter and further maintain carbon storage for a longer period,which untimely augments the functionality of ecosystem carbon sinks(Cheng et al.,2015).By storing carbon provided by wood and nonwood products,plantations have become a promising way to combine climate change mitigation with economic development (Kongsager et al.,2013;Myint et al.,2021).Additionally,the tradeoff between timber value and carbon storage and climate change has become a priority research area in many scientific programs (Fischer et al.,2017).
Active forest management (AFM) involves planting,thinning,final cutting,and replanting (Gao et al.,2016).Forest bioenergy from AFM plays an important role in mitigating long-term climate change and supplying renewable energy.Most importantly,active management allows more atmospheric carbon to be stored in forests and other ecosystem functions and services to be improved.In fact,increasing forest carbon storage via AFM has been an important component under the REDD+(reducing emissions from deforestation and forest degradation and enhancement of forest carbon stocks) scheme of the Paris Agreement (Schroeder et al.,2020).Improving forest carbon storage through forest management and restoration efforts,such as reforestation,will eventually lead to the accumulation of carbon stocks in forests(Global Forest Observations Initiative,2016).Other studies also address the role of plantations in response to climate change,deforestation and energy crises(Pawson et al.,2013;Kongsager et al.,2013;Mateos et al.,2016;Myint et al.,2021).
With China already committing to peak CO2emissions before 2030 and achieving carbon neutrality before 2060,there is a need for accelerated efforts to better implement carbon accounting in the industry and energy fields as well as ecosystems.The carbon storage and carbon density of forests in China decreased drastically before the mid-1970s due to the overuse of forest resources.Over the last 40 years,the carbon storage in forests in China has been significantly improved due to the implementation of six key forestry programs,including the Natural Forest Protection Program,the Program for Conversion of Cropland to Forests,Key Shelterbelt Development Programs in such regions as the three north and the middle and lower reaches of the Yangtze River,the Sandification Combating Program for areas in the vicinities of Beijing and Tianjin,the Wildlife Conservation and Nature Reserve Development Program and the Fast-growing and High-yield Timber Plantation Development Program (Lei,2002;Bryan et al.,2018).In southern China,plantation forests have been rapidly developed to provide various forest goods and services while simultaneously reducing the pressure on natural forest ecosystems;these plantations also serve as a carbon sink and have become an effective component of climate change mitigation(Tong et al.,2020).Therefore,the carbon cycle and redistribution of plantation forest ecosystems in southern China deserve thorough investigation.
Different kinds of large-scale models,including terrestrial biosphere models,inversion models,and bookkeeping models,have been applied to estimate various impacts on the carbon cycle (Hayes et al.,2012;Le Quéré et al.,2018;Wei et al.,2018).However,these models are primarily applied at global or continental scales;thus,there are many challenges and uncertainties involved when estimating forest carbon budgets at the local management level and small regional level.Consequently,developing more reliable methods,for example,by tuning models with parameters more suitable for the regional scale,to fully elucidate the impacts of forest management measures on regional-scale carbon storage capacities and harvest cycling is currently a top priority(Fitzpatrick et al.,2013).
The integrated biosphere simulator (IBIS) is a dynamic global vegetation model (DGVM) that links mesoscale atmospheric drivers and vegetation ecophysiology via a physically consistent representation of canopy photosynthesis and stomatal conductance(Foley et al.,1996).Liu et al.(2016) modified the IBIS and then used it to simulate the carbon dynamics of land cover changes in the United States (Liu et al.,2020).The state-and-transition simulation model (STSM) is a general,randomized,and spatially explicit approach for projecting landscape dynamics(Daniel et al.,2018).Based on the landscape dynamics model in ApexRMS®SyncroSim software,STSM simulates and predicts ecosystem carbon cycles by integrating land use changes,forest age,and carbon process models(Daniel et al.,2016).With the parameters of carbon flow between various pools calibrated by the IBIS,STSM can be employed to project land changes and calculate carbon storage and fluxes (Sleeter et al.,2015).
By combining IBIS and STSM with locally parameterized plant functional types (PFTs),as well as the disturbance and recovery history resulting from the vegetation change tracker (VCT) (Diao et al.,2020),this study aims to understand the effects of active forest management on the carbon balance of plantations in Lishui,southern China.Our goals were 1) to estimate and analyze the carbon density of three typical plantation ecosystems;2) to evaluate the effects of plantation management on carbon stocks and sequestration;3)to project the carbon storage in future plantation forests in China under varying management activities;and 4) to provide suggestions toward optimizing forest management in the study area.
2.Materials and methods
2.1.Study area
Lishui is located within a mountainous area of southern China,with an administrative region spanning from 27°25′to 28°57′N and from 118°41′to 120°26′E.Lishui has a land area of 1.73 Mha,of which 80.79%is forested(Fig.1).The region has a subtropical monsoon climate with a mean annual precipitation of 1468 mm and a mean annual temperature of 17.2°C (Exbrayat et al.,2017).The zonal vegetation of the study is broad-leaved forest such as oak(Cyclobalanopsis)and castanopsis(Castanopsis) (Wang,1986).
In recent decades,this area has undergone considerable land use changes,primarily due to deforestation,reforestation and accelerated urbanization.Most deforestation events occurred prior to the 1970s,and ever since,wood production has been the sole aim of forest management.Consequently,various environmental and socioeconomic issues,such as the continued degradation of water and soil quality,high risks of species extinction,and invasion of pernicious exotic species,quickly arose (Fu and Chen,2000;Guo et al.,2002;Ho,2006;Zhang et al.,2006).
To effectively improve the quality of the local environment while accounting for international responsibilities,the State Council began to implement actions in 1999 based on proposals by the central government to accelerate forestry development (Zhou,2003).This led to the establishment of fast-growing/high-yield timber plantations with short-rotation tree species such as Chinese fir (Cunninghamia lanceolata(Lamb.) Hook.)and pine(Pinus massonianaLamb.),as well as broadleaved forest like oak(Cyclobalanopsis glauca(Thunb.) Oerst.) plantation.Forest Inventory data(2013)revealed that the dominant woodlands in this study area were pine,Chinese fir,and oak,which comprised 33.83%,26.02%,and 16.99%,respectively,of its forested land.Over the last 31 years (1989-2019),active management of the forests in this area resulted in 14%of the study area being cut at least once,while the remainder of the forested region was undisturbed during this study period(Diao et al.,2020).The AFM activities(e.g.,frequent logging and post harvesting restoration)in this area have a substantial impact on the forest carbon cycle.
2.2.Conceptual models
2.2.1.Framework for tracking management activities
The STSM provides a mechanism and platform for combining land use changes,forest age,and carbon process models at a high spatial resolution and at a simulation speed 10,000 times faster than process-based models (Daniel et al.,2016;Liu et al.,2021).In this study,two state variables,including land cover type and forest age,were tracked in the STSM.Four land cover types,including Chinese fir,pine,oak,and nonforest,were defined and tracked in the model.For the data from 1989 to 2019,forest cells were classified as nonforest after experiencing disturbance,and the ages of the cells were reset to 0 in the following year.The nonforest recovery period was classified as 3-31 years according to a statistical result(Diao,2021).For the data from 2020 to 2050,forest cells covering Chinese fir,pine and oak plantations were partially cut at 33,50 and 71 years and recovered in the following year.
In our STSM model,a forest species map and a forest management history map from 1989 to 2019 were used to initialize and track land cover transitions.Here,we defined eight transition types,including transition from Chinese fir to nonforest,transition from nonforest to oak,etc.(Fig.2).The eight land cover transitions were considered AFM events,which usually cause drastic changes in carbon stock and flux compared to forests without AFM events.Due to the lack of available related data,we did not include wildfire and thinning in this study.
2.2.2.Carbon cycleflow chart
IBIS is a physically consistent process model(Foley et al.,1996)that is capable of simulating vegetation phenology,biomass growth,soil biogeochemistry and vegetation dynamics.IBIS uses many linear and nonlinear equations and many fixed and dynamic parameters.In this study,we aggregated carbon cycle of the IBIS model into six carbon pools(squares) and ten carbon fluxes (arrows) (Fig.3).The annual carbon input from the atmosphere to the ecosystem grew,and this process was represented by ecosystem net primary productivity(NPP).The remaining flows were expressed as the ratio of their respective source inventories(i.e.,flow rates).The carbon components included living biomass,standing deadwood,down deadwood,harvested wood product (HWP),litter,and soil organic matter.The carbon pools from the atmosphere and HWP were included in the ecosystem to enforce the mass balance.The carbon fluxes between carbon pools included (1) the growth,mortality,harvesting,and litterfall of living biomass;(2) the decay of deadwood;(3) decomposition;and (4) emissions from living biomass,deadwood,litter,and soil organic matter.These pools and fluxes were converted to an age-dependent lookup table,and the carbon stock and flow parameters were used directly by STSM.
Liu et al.(2021) listed a set of macroequations of carbon stocks and fluxes derived from IBIS outputs:

where the subscript“old”denotes the year-beginning value and the subscript“new”denotes the year-end value.The variables decwd,declit,emlit,and emsoc represent the decomposition of deadwood,decomposition of litter,emission from litter and emission from SOC,respectively.These equations represent processes shown in Fig.3.
2.3.Model input and runs
2.3.1.Data processing
In this study,we constructed and validated age estimation models based on data from the Forest Resources Sampling Survey (FRSS) of Zhejiang Province conducted during the summers of 1994,2004,and 2014.The FRSS is based on a systematic sampling design consisting of a 4 km × 6 km grid in Zhejiang Province;at each grid cell intersection,a permanent field plot was established to perform a repetitive and comprehensive investigation during which the ages of individual trees and other forest attributes were estimated(Shen et al.,2018).Each plot covers 800 m2(28.28 m × 28.28 m),and each tree is permanently marked and periodically revisited.In the current work,forest tree species and their corresponding longevity data were compiled from the Forest Management Inventory conducted separately in 2013.
The main standing tree stocks of Chinese fir,pine,and oak in the 2014 forestinventorydatawereconvertedtocarbonstoragebasedonthebiomass expansion factor and carbon content coefficient of each species;then,carbondensitywascalculatedbydividingthe carbonstoragebythesample size(800m2)forIBISmodelcalibration.The numbersofsample plots ofChinese fir,pine,and oak plantations used for model calibration in this study were 26,51,and 63,respectively.To create a distribution map,we converted the 2013 inventory data into a 90-m grid of tree plantation raster data based on the dominant tree species.The dominant tree species and forest age data were extracted from the forest resource inventory data to establish and verify the forest age and compare it with that in the carbon density model.
2.3.2.Model adjustment
The IBIS model is a DGVM for regional and global scale studies.However,the model can be used at local scale when calibrated with local observation data.In this study,we adjusted the model in three aspects:1)Modified map projection and interpolation process to locate the Lishui region in China's land cover,soil and climate dataset;2)Each of the three simulated vegetation types,Chinese fir,pine and oak,was applied with a biomass scalar based on the growth curve of our study area (Fig.1b);3)The soil carbon density value obtained from IGBP-DIS (Global Soil Data,2000) was used as the initial value of the soil carbon pool.Besides,the relationships among live biomass,litter,dead wood and soil carbon follows Liu et al.(2020).

Fig.3.Carbon stocks and flows defined in the IBIS.
2.3.3.Carbon density estimation
It was necessary to use the biomass carbon density data of Chinese fir,pine,and oak as the primary data for model initialization.Data sampled from the three tree plantation forests were employed to fit the growth equations of biomass carbon density.Growth equations are mathematical models used to describe the changes in various factors with forest age.By modeling the forest age and carbon density,the growth rate of tree species can be well understood.The commonly used tree growth equations include the logistic,Richard,Gompertz,and Korf equations.
The central standing tree stocks of Chinese fir,pine,and oak stands in the study area from the forest inventory data of Lishui city,Zhejiang Province(2014),were expanded to stand biomass and then multiplied by the carbon coefficient to convert the values to carbon storage;then,carbon storage was converted to carbon density using the sample plot size(800 m2).Through experiments,it was found that the logistic model(Eq.(5)),which had a determination coefficient (R2) higher than 0.79,was the best fit for the plantation data used in this study.Therefore,for this investigation,a logistic model was employed to fit the relationship between forest age and carbon density for the three tree species and to calibrate their growth curves in the study area(Fig.4).

whereyrepresents the biomass carbon density in kg•m-2,trepresents the average age of the forest stand,aandcrepresent model parameters to be solved,andeis Euler's number.
With the fitted equations,the maximum values of living biomass of the three plantations were obtained.We used the maximum living biomass and the IBIS model to find the 100-year simulated forest carbon density.Then,sample plot data were used to verify the carbon density obtained by the IBIS model.Two indicators,RMSE and BIAS,were used to express simulation accuracy.
2.3.4.Input dataset
The initial meteorological data,including monthly average temperature,monthly average precipitation,relative humidity,cloud cover,wind speed,daily temperature range,and evaporation were averaged from 1996 to 2005 using GISS-E2-R (NASA Goddard Institute for Space Studies E2-R Model,http://glisaclimate.org/node/2226).Other variables,such as wind speed and the lowest temperature,were extracted from the UK Climate Research Unit(https://crudata.uea.ac.uk/cru/data//temperature/).The soil texture and soil carbon content data were obtained from a Global Soil Data Products CD-ROM (IGBP-DIS) (Global Soil Data,2000).The soil data were reprojected and converted using ArcGIS software to make them consistent with other geospatial input datasets (e.g.,DEM,vegetation map and meteorological data) and resampled to a spatial resolution of 1 km× 1 km.
The vegetation cover map was based on the tree species,and age maps of each species were compiled on 90-m grid from the 2013 Zhejiang Forest Resources Management Inventory.The diameter at breast height,canopy density,and tree species corresponding to each forest stand were collected.To meet the requirements of this investigation,the forest vegetation types in the study area were combined and divided into three typical forest types:Chinese fir,pine,and oak.
2.4.Estimation scenario
Based on the AFM history (1989-2019),four simulation scenarios were designed to study the impacts of AFM on carbon storage:Scenario 1,carbon stock with no AFM activities;Scenario 2,carbon stock with disturbance but no recovery;Scenario 3,carbon stock with implemented AFM activities;Scenario 4,carbon stock trend with implemented AFM activities plus the wood harvested from the plantation.
According to the distribution of forest resources and the cutting quota of the Zhejiang Forest Management Plan (2016-2050),four harvest regime scenarios were employed to test the impacts of AFM on the forest carbon of Lishui from 2020 to 2050.The four scenarios were as follows:Scenario 1,no harvesting in the future;Scenario 2,harvesting according to the planned harvest area;Scenario 3,harvesting 0.5 times the planned harvest area;Scenario 4,harvesting twice the planned harvest area.
3.Results
3.1.Uncertainty of IBIS
The observation-derived carbon densities of living biomass at 100 years of age for the study region were 97.45,99.99 and 121.86 Mg•ha-1for Chinese fir,pine and oak,respectively.We used these values as the target biomass output of the IBIS.To evaluate the IBIS biomass uncertainty,we compared the simulated biomass of the three species with inventory data.The living biomass C values simulated by IBIS for Chinese fir,pine and oak have BIAS values of 0.71,-0.50 and 7.10 Mg•ha-1,respectively.The root mean square errors(RMSEs)are 39.24,45.29 and 33.70 Mg•ha-1for Chinese fir,pine and oak,respectively (Fig.5).
3.2.Area changes resulted from management activities
The annual average disturbed areas were estimated to be 4,484,2,191,and 3167 ha for Chinese fir,oak,and pine,respectively(Fig.6a),based on the VCT product.The corresponding annual average recovery areas were 6,135,2,702,and 5339 ha(Fig.6b).From 1989 to 2019,the average areas of the three dominant tree species (i.e.,pine,Chinese fir and oak) were 32.85,30.42,and 24.65 Mha,respectively(Fig.6c).The total areas of the three tree species increased over time(pine,by 1700 ha;Chinese fir,by 1000 ha;oak,by 400 ha).The overall forest disturbance and recovery area showed a downward trend.One reason for this finding was that forest management policy was altered from solely considering wood production to both wood production and ecological benefits.The other reason is that the original pure forests of Chinese fir and pine,which had fragile ecological functions,were gradually transformed into broadleaved forests with relatively stable stand structures(Zhang et al.,2007).
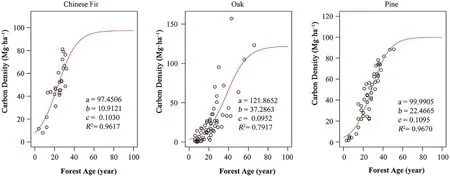
Fig.4.Carbon density over the forest age-growth curves of the three tree species.
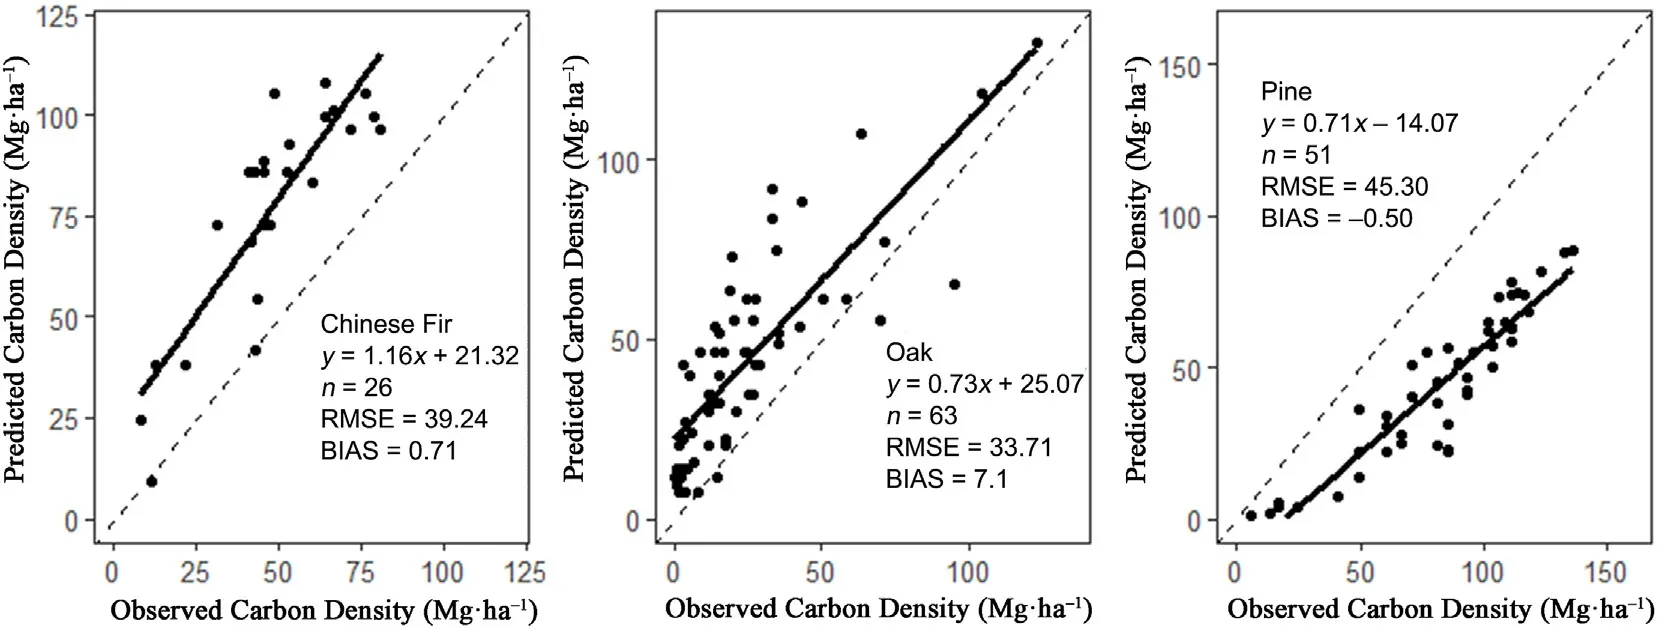
Fig.5.Verification of the IBIS results by inventory data.
3.3.Initialization of carbon stocks for each pool
To elucidate the contributions of forest stands to the carbon storage of entire forests,this study estimated the carbon storage potentials of Chinese fir,pine,and oak plantations based on the 100-year forest growth curves simulated by IBIS.For this investigation,the carbon pools of the three plantation ecosystems were divided into four carbon pools:aboveground biomass,deadwood,litter,and soil.The carbon density of the various carbon pools and the total carbon pools of the forest ecosystems from 0 to 100 years showed that forest age was an essential influencing factor that controlled forest carbon density,with the average carbon density increasing over time.
The carbon density curves of the aboveground biomass values of the three tree species indicated that the growth rate was high before the forests were mature.Table 1 illustrates the simulated carbon biomass of the three plantations in different age groups,showing that the total carbon densities of pine and Chinese fir gradually increased with age and attained the highest level at 64 years (232.04 Mg•ha-1) and 70 years(223.36 Mg•ha-1),respectively,and then decreased annually.However,the total carbon density of oak in overmature forests continued to exhibit a gradually increasing trend.The average carbon densities of the three tree species at 100 years were 182.34 Mg•ha-1for Chinese fir,179.02 Mg•ha-1for pine and 168.07 Mg•ha-1for oak.Among these species,the carbon density of Chinese fir was higher than the average carbon in the overmature forest stage,whereas the carbon density of pine was higher than the average in the mature and overmature forest stages.The carbon density of oak was lower than the average in the mature stage but greater than the average in other age groups.
The rank of living tree biomass carbon densities in the first 50 years was as follows:Chinese fir>pine>oak.After 50 years,the oak entered the near-mature growth stage,Chinese fir entered the overmature forest growth stage,and pine entered the mature forest growth stage;the relationship among the carbon densities of the species was as follows:oak>pine>Chinese fir(Fig.7).The carbon density curve of the deadwood from all three tree species was consistent with that of living standing wood biomass carbon density.The litter carbon density curve was similar to that of live Chinese fir and pine but higher than that of live oak.
In the early forest stage,soil organic carbon decreased as the forest stand was not entirely closed,and the soil carbon density of the three plantations was low.With the increased decomposition of new litter,soil organic carbon gradually accumulated,and its carbon density increased annually.However,once Chinese fir and pine became overmature,the soil carbon decomposition rate was higher than that of litter,and the soil carbon density exhibited a downward trend.However,the soil carbon density of oak continued to exhibit an increasing trend annually(Fig.7).
3.4.Carbon stock trend
The size of each carbon pool directly reflects its long-term carbon sequestration capacity in an ecosystem.This study conducted a quantitative estimation of the interannual changes in the carbon pools of the three typical plantation ecosystems from 1989 to 2019.The results revealed that the order of the average carbon densities of the three tree species were as follows:pine (118.94 Mg•ha-1) >Chinese fir (118.78 Mg•ha-1)>oak(110.86 Mg•ha-1)(Table 2).The average annual carbon storage capacities of the three plantation ecosystems were ranked as follows:pine(38.26 Tg C)>Chinese fir(38.25 Tg C)>oak(27.74 Tg C).As shown in Figs.8 and 9,the forests showed a relatively strong carbon accumulation process.

Table 1 Simulated carbon statistics of the three species included in this study by age group (TEC=total ecosystem carbon,unit:Mg•ha-1).

Table 2 Average ecosystem carbon density for the three plantations from 1989 to 2019(unit:Mg•ha-1).
The total carbon storage of the pine,Chinese fir,and oak plantation ecosystems increased by 0.58,0.45,and 0.38 Tg C•year-1,respectively.Within these ecosystems,the living biomass carbon pools showed the largest increases,with the living biomass carbon pools and soil carbon pools accounting for the major proportions of the total forest carbon storage.These carbon pools had a significant impact on the carbon storage of the entire forest,while the litter carbon and deadwood carbon pools had a negligible impact on forest carbon storage,particularly in the pine plantation ecosystem,for which the proportion was the smallest.
3.5.Effects of active management on carbon stocks
Active management,such as logging,thinning and planting,was implemented in the study area.Logging and thinning remove a portion of the aboveground biomass while promoting the growth of the retained wood.The total carbon storage of ecosystems is affected by the intensities and types of disturbances,and the same disturbance patterns can have variable effects between tree species.Changes in the carbon storage of the three plantations under the four scenarios were simulated,as shown in Fig.10.Disturbances reduced the carbon storage of the three plantation ecosystems by 0.29-0.59 Tg C per year on average,whereas forest recovery following disturbances increased the carbon storage of the three plantation ecosystems by 0.17-0.51 Tg C per year,on average.Including the carbon storage of harvested wood,the carbon storage of the pine plantations,with disturbance and restoration events,was higher than that of the undisturbed plantations after 1996.The carbon storage of the disturbed Chinese fir plantation was higher than that of the undisturbed plantation after 2009;however,the disturbed oak plantation did not recover to the undisturbed level.
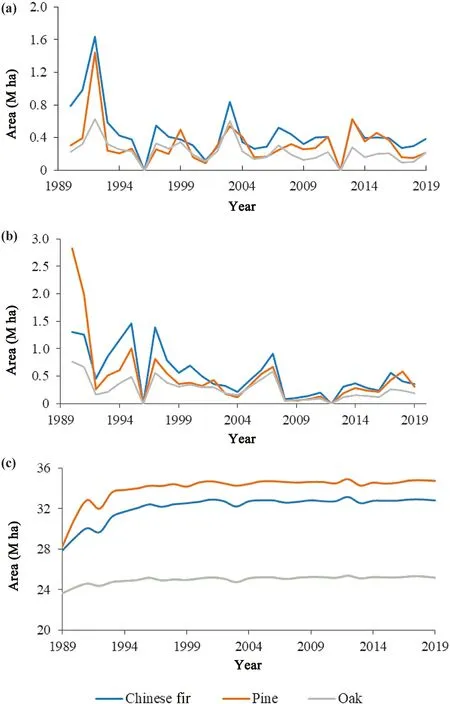
Fig.6.Forest area changes in Lishui based on VCT products from 1989 to 2019.(a)Forest area changes due to disturbance;(b)forest area changes due to recovery;and (c) forest areas of the three plantation tree species.
To elucidate the effects of active forest management on future carbon storage,we compared the future changes in the total ecosystem carbon of the three plantations under the four logging scenarios.The results show that the total ecosystem carbon of the three tree plantations increased in Scenario 2(harvesting within the planned harvest area)but decreased in Scenario 4 (harvesting twice the planned harvest area);however,the total ecosystem carbon of Chinese fir and pine decreased under the other three scenarios.Although the total ecosystem carbon of oak showed an increasing trend under Scenario 1 (no harvesting) and Scenario 3 (harvesting 0.5 times the planned harvest area),the increase was lower than that under Scenario 2(harvesting within the planned harvest area).This indicates that the planned harvest area is relatively reasonable and helpful for maximizing the carbon sequestration capacity of the forest(Fig.11).

Fig.7.Growth curves of the largest carbon pools simulated by the IBIS for the three tree species.
4.Discussion
4.1.Comparison with existing literature
Researchers use various methods,such as site observations,field surveys,and model simulations,to describe the processes and characteristics of carbon cycles in different ecosystems.Many research papers have been published on the carbon cycles of Chinese fir,pine,and oak.Based on the collection of a large number of relevant journal publications and technical reports,we verified the accuracy and adaptability of the IBIS model for modeling carbon density(Table 3).To compare with other studies,we calculated the carbon densities of the three tree species simulated by the IBIS model by age group,including young forest,middle-age forest,premature forest,mature forest and overmature forest.The results of this comparison are shown in Fig.12.
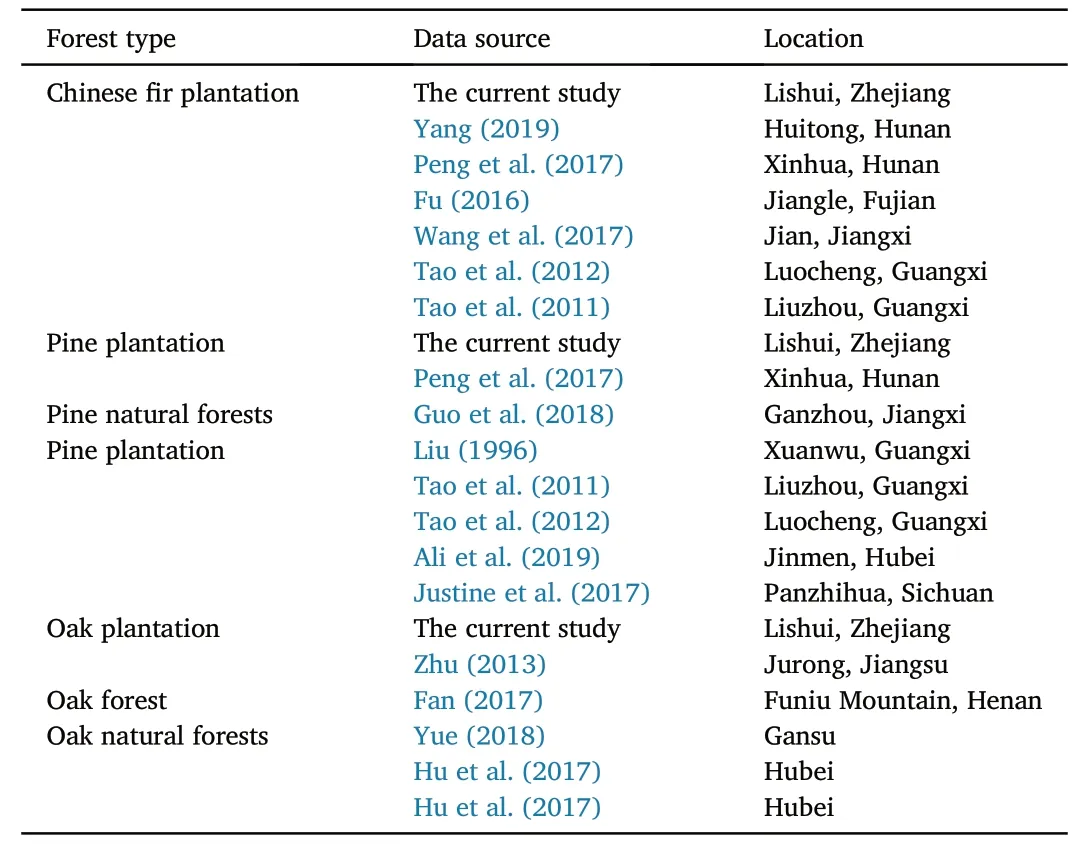
Table 3 The articles used to verify the carbon density.
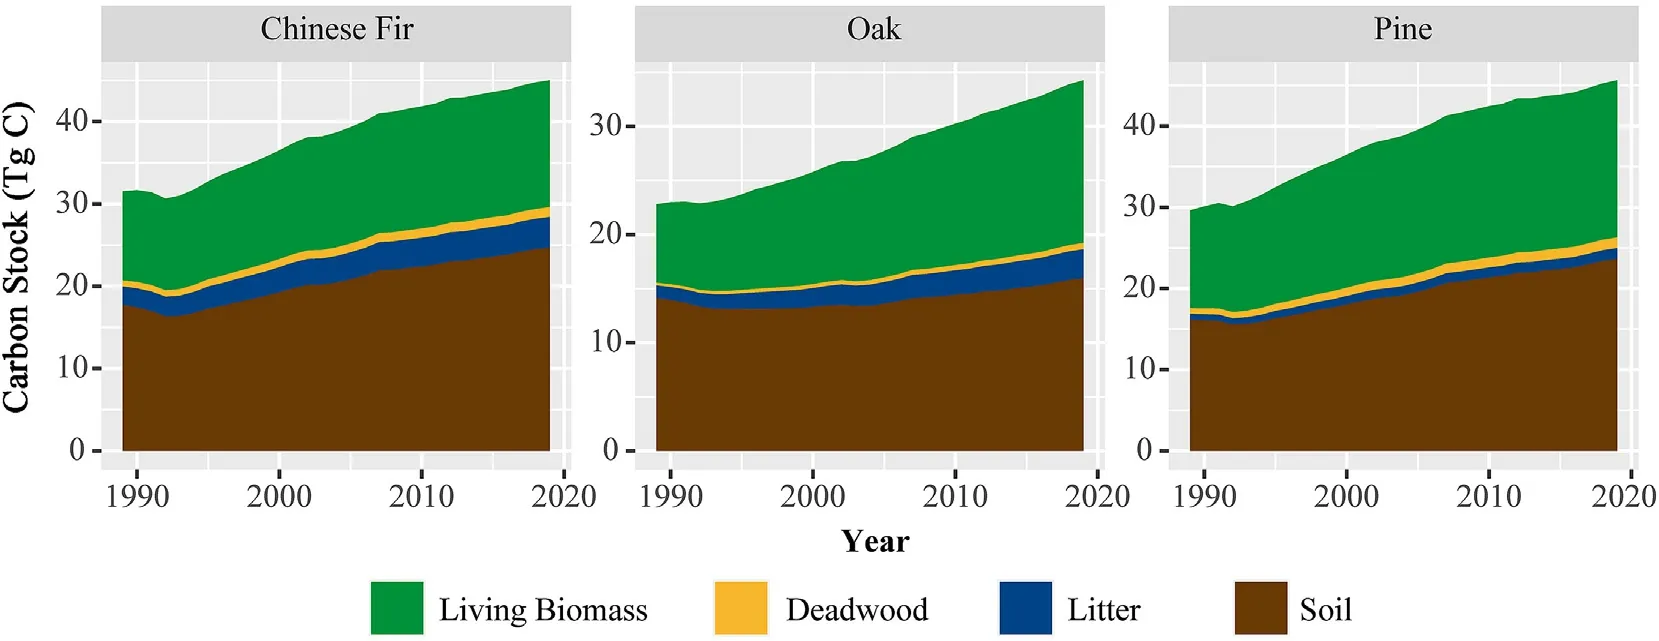
Fig.8.Temporal distributions of the decadal carbon stocks of the three typical forest ecosystems from 1989 to 2019 in Lishui city,Zhejiang Province.

Fig.9.Density comparisons for each carbon pool between 1989 and 2019.
We compared our Chinese fir plantation carbon density estimations with the results of similar studies(Fig.12a).Fu(2016)studied the Chinese fir plantation biomass in Jiangle County,Fujian Province,using field surveys and reported that the carbon density was 75.77-148.47 Mg•ha-1,which is higher than our result.Peng et al.(2017) reported the carbon densities of young and middle-aged plantations(13.24 and 20.84 Mg•ha-1,respectively) using a continuous biomass conversion factor with spatial analysis in ArcGIS,and the results were lower than our estimation.The carbon density estimation of Yang(2019)derived from growth models is higher than our estimate for the young age group and lower than our estimate for the other age groups.Compared with the regression results of Tao et al.(2012),the carbon densities of the young forests and overmature forests in our study were higher,while the carbon densities of the other age groups were lower.Wang et al.(2017) analyzed the characteristics of carbon storage changes in Chinese fir plantations using sample plots.The carbon densities of overmature forests in that study were similar to those in our study;however,for the other age groups,the carbon densities were higher in the previous study than in our study.These comparisons indicate that our carbon density values of Chinese fir simulated by the IBIS are within an acceptable range and reliable.
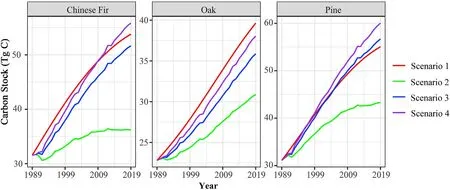
Fig.10.Effects of active forest management (AFM) on total ecosystem carbon accumulations in the three forest types from 1989 to 2019.Scenario 1,carbon stock with no AFM activities;Scenario 2,carbon stock with disturbance but no recovery;Scenario 3,carbon stock with implemented AFM activities;Scenario 4,carbon stock with implemented AFM activities plus the wood harvested from the plantation.
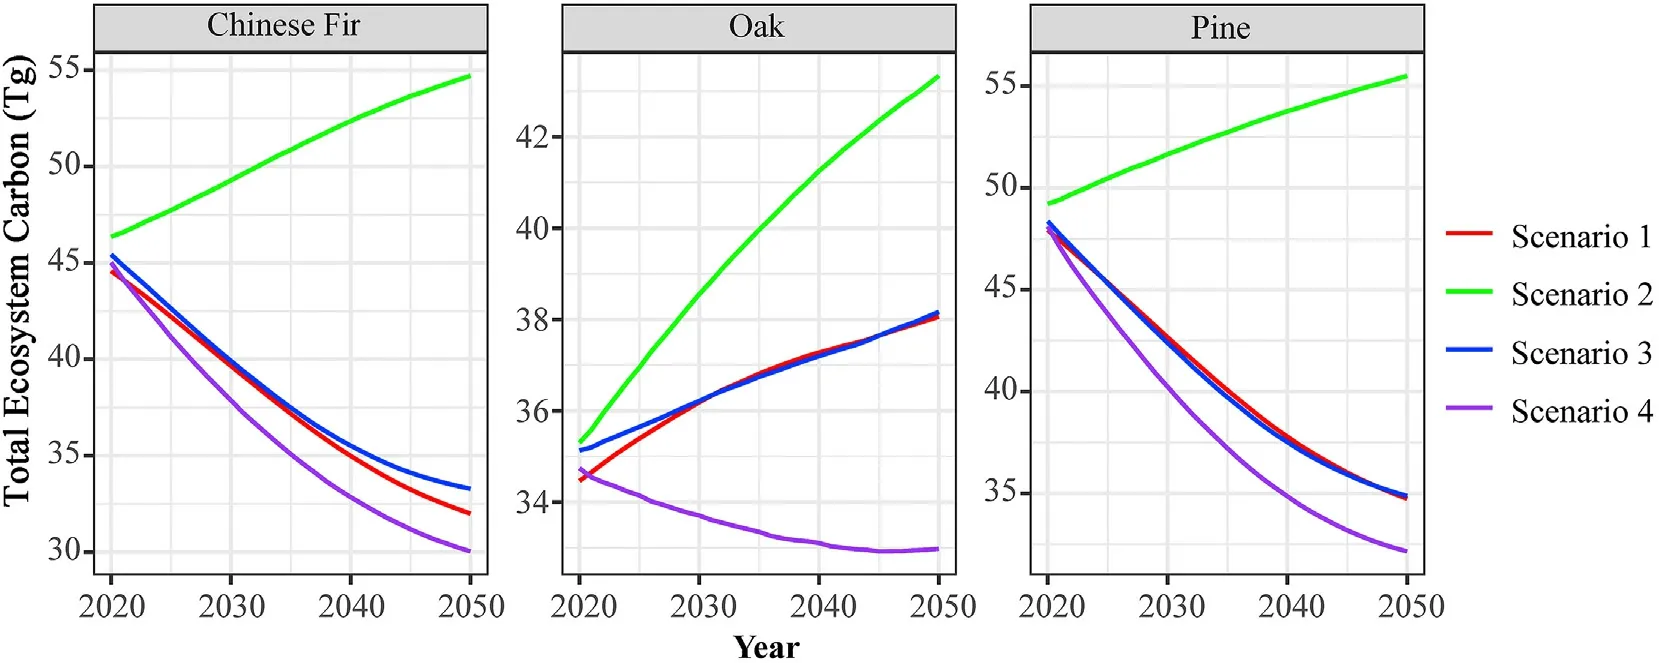
Fig.11.Comparison of total ecosystem carbon under different harvest scenarios in the future (2020-2050) according to the logging quota of the Zhejiang Forest Management Plan(2016-2050).Scenario 1,no harvesting in the future;Scenario 2,harvesting according to the planned harvest area;Scenario 3,harvesting 0.5 times the planned harvest area;Scenario 4,harvesting twice the planned harvest area.
Hu et al.(2017)obtained the carbon density(58.21-163.05 Mg•ha-1)of natural oak forest in western Hubei using the method recommended by the IPCC for forest carbon storage estimation.The carbon densities of all the age groups in the natural oak forests in that study were higher than those in other studies,including ours.The carbon densities of the young forest(9.28 Mg•ha-1)and middle-age forest(41.30 Mg•ha-1)in our study were lower than those in other studies;however,the carbon densities of the other age groups were higher.Zhu(2013)found a carbon density of 12.29-104.07 Mg•ha-1for a subtropical oak plantation ecosystem in northern Jurong,Jiangsu,using a regression model;of the similar studies,this result is closest to our results (9.28-120.14 Mg•ha-1)(Fig.12b).Similarly,the carbon densities of oak plantations in different age groups simulated in our study are within the ranges present in the comparable literature.
Peng et al.(2017) reported the carbon density of Masson pine in Xinhua County,Hunan Province (2.80-24.35 Mg•ha-1);these values were the lowest among all the literature compared in this study.Liu(1996)sampled the biomass of pine plantations of different age groups in the hilly area of central Guangxi,and the corresponding transformed carbon densities were lower than the carbon densities found in our study.Using a sample plot survey and growth equation,Ali et al.(2019) estimated the carbon density by age group to be 23-133 Mg•ha-1for pine plantations in Taizishan,Hubei Province.The carbon density of young forests in this study was higher than that estimated in Luocheng,Guangxi,by Tao et al.(2011),and it was also higher than that found in Panzhihua,Sichuan Province,by Justine et al.(2017).However,the carbon densities of the other age groups in this study were lower than those in other studies.Fig.12c shows that the carbon density values of pine simulated by the IBIS in this study fall in the middle of all the comparable literature values.
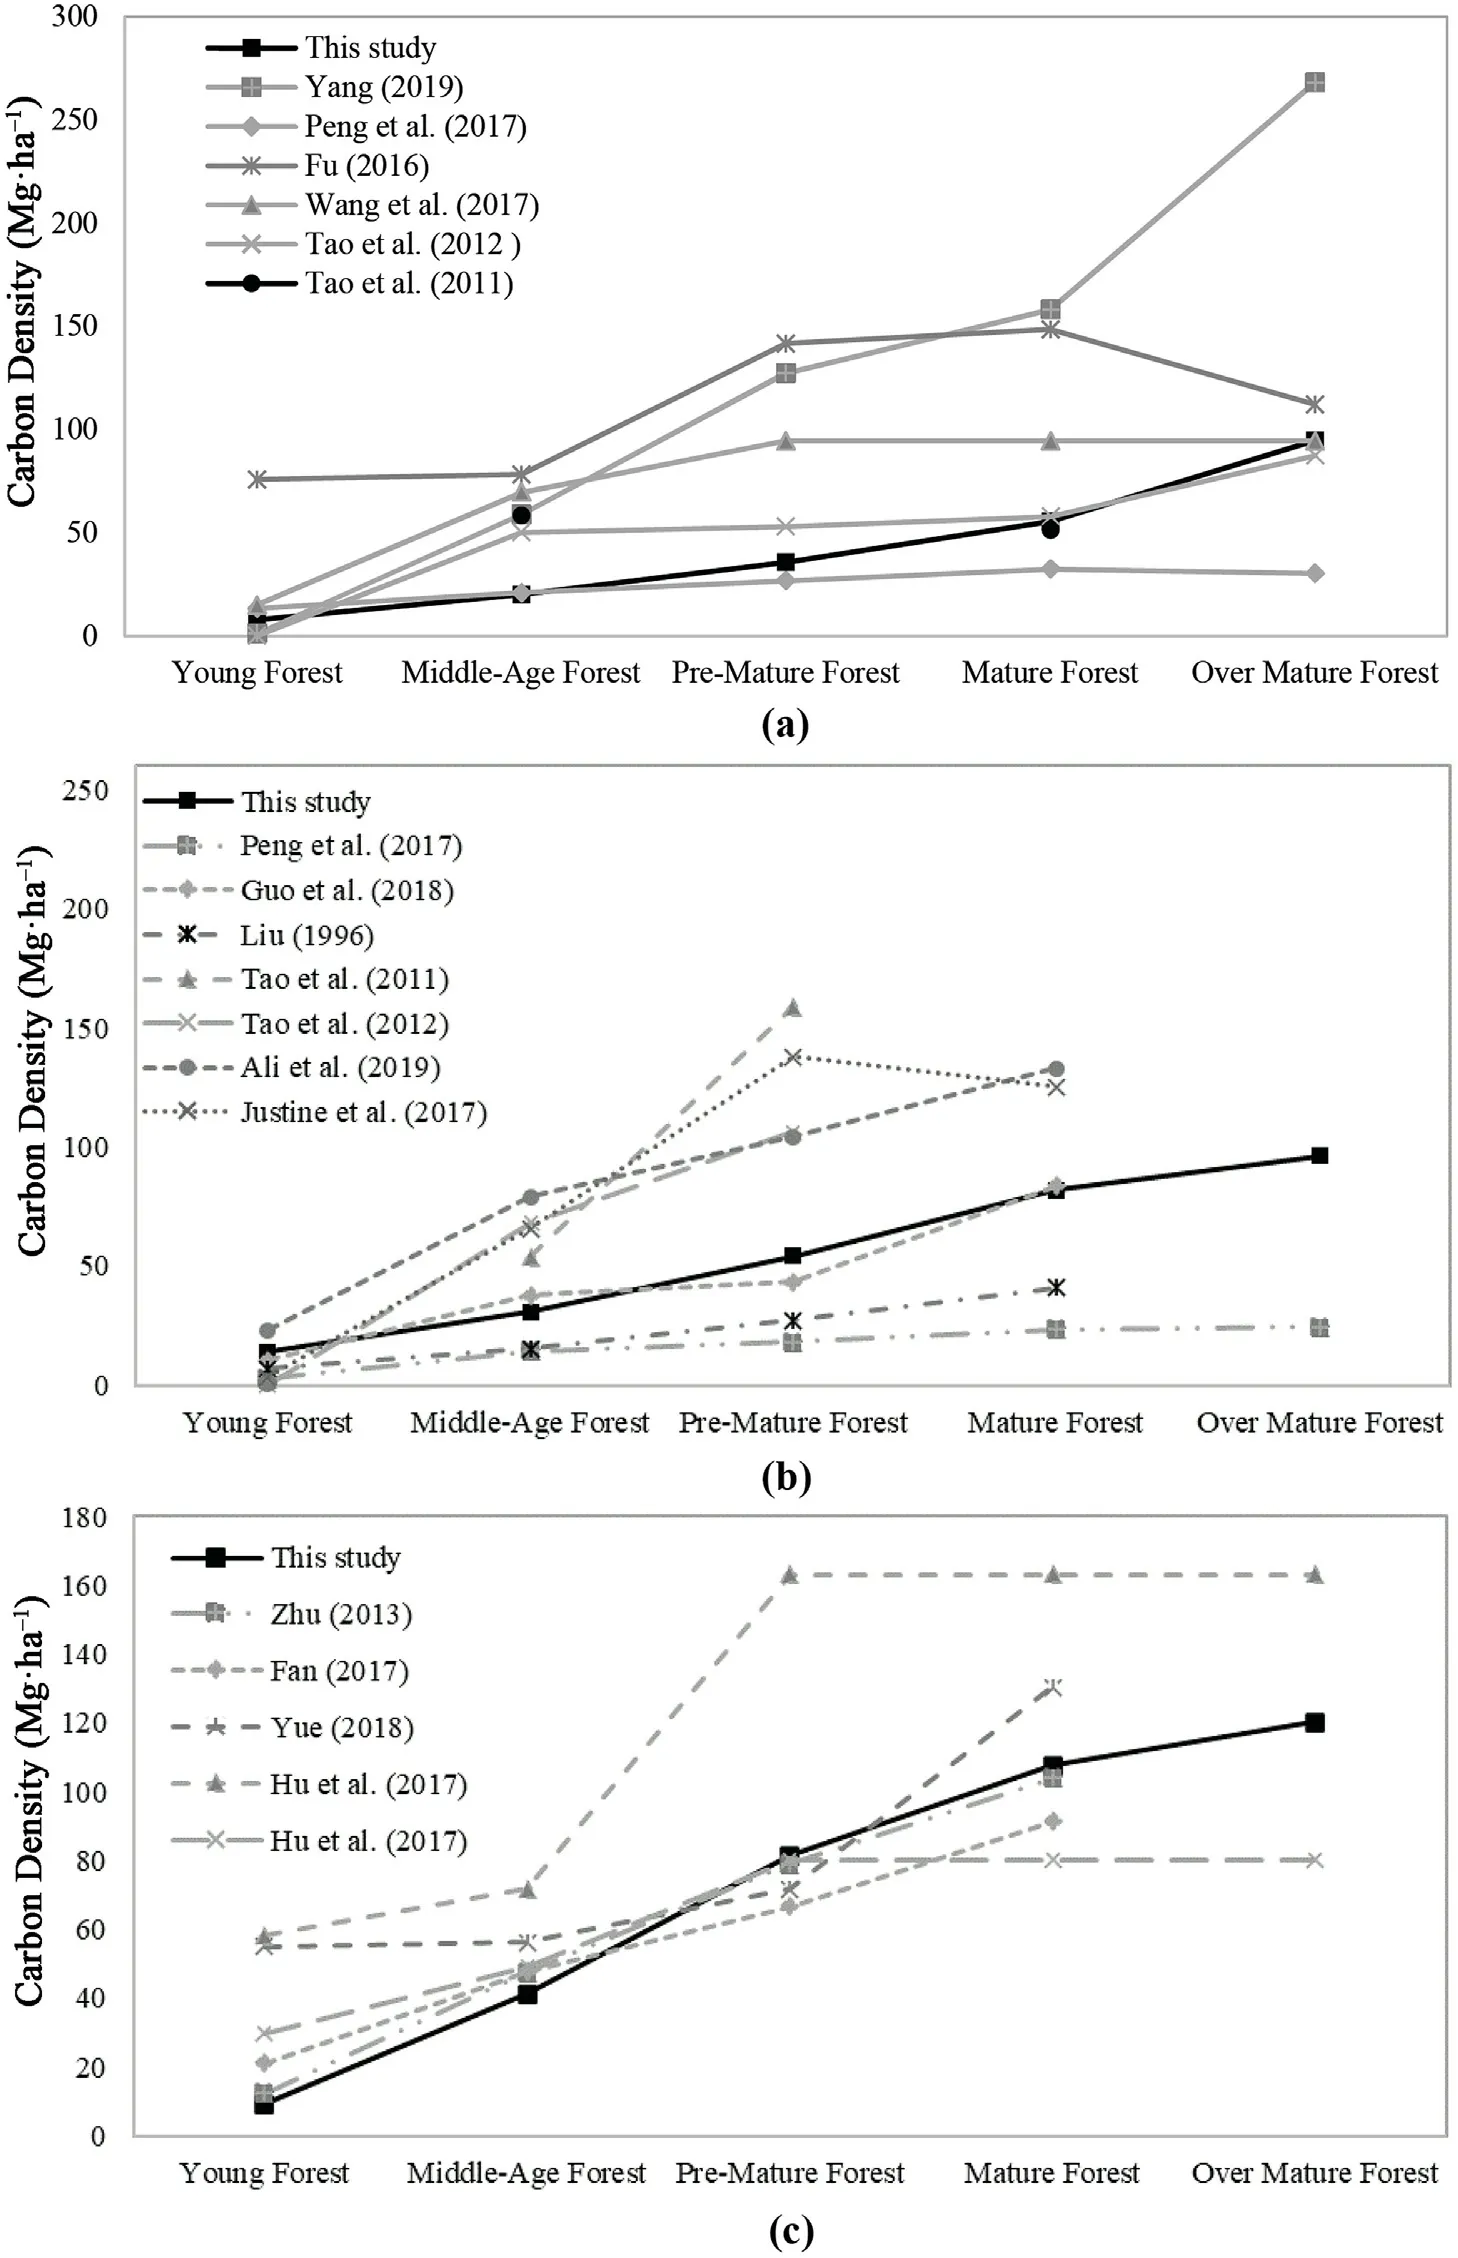
Fig.12.Comparison of the results with results from other researchers.(a)Shows results for the Chinese fir plantation,(b)shows results for the oak plantation,and(c)shows results for the pine plantation.
Strategic management,such as“mountain refining”and land preparation before afforestation,has altered the litter decomposition of forestlands,which leads to soil carbon losses.The order of carbon densities for all the carbon pools was as follows:soil layer(56.17-63.65 Mg•ha-1)>living biomass layer (42.24-49.09 Mg•ha-1) >litter layer (7.73-9.94 Mg•ha-1)>dead wood layer(1.69-3.19 Mg•ha-1).This indicates that the forest soil carbon pool,as the largest carbon pool in the forest ecosystem,played an essential role in the carbon balance and carbon cycle of the forest ecosystem.This result was consistent with the findings of He et al.(2013).In our study,the litter carbon densities of the three plantations increased with age,which is consistent with the results of Yang(2019).Soil carbon density is affected by many factors,such as soil type,soil thickness,soil physical and chemical properties,and litter layer coverage.For example,Guo et al.(2018)argued that soil carbon density increased with forest age,while Hu et al.(2017)found that in natural oak forests Hubei,soil carbon density follows a pattern of middle-age forest>mature forest>premature forest>young forest.In this study,the soil carbon density of the three plantations in the mature forest stage decreased and then increased.In the overmature forest stage,the soil carbon densities of the Chinese fir and pine plantations gradually decreased,while the soil carbon densities of the oak plantations increased at all stand ages.
In summary,the carbon densities simulated in this study for plantations of three species are within a reasonable range compared to those published in the literature,indicating that the IBIS model is suitable for the current study area.
4.2.Carbon density of forest plantations
By comparing our results with those from other studies(Zhang et al.,2007;Li et al.,2016),we found that the carbon densities of the living biomass in Chinese fir and pine are similar with them.However,the carbon densities of living biomass oak plantation are lower.This might be caused by the dominant distribution of young and premature oak planation in the study area.Deadwood and litter studied in our study were higher than the average carbon densities in similar forest ecosystems in Zhejiang Province(Li et al.,2016).However,the modeled carbon densities for the total ecosystem were all lower than the average carbon storage values for Chinese forests(258.83 Mg•ha-1) (Zhou et al.,2000).In this case,the reason for this finding was that the carbon storage in the soils of the plantations of the three tree species in this study(56.17-63.65 Mg•ha-1)was much lower than that observed by Zhou et al.(2000),who reported the soil carbon storage of the forest ecosystems to be 193.55 Mg•ha-1.
4.3.The effects of AFM forest on carbon storage
Our results suggest that AFM,including forest species selection,forest age management,and forest disturbance and recovery,can alter regional carbon cycles and accelerate tree growth.However,the change of carbon stock after AFM activates varies from type,degree,time period and study scale(Krankina and Harmon,2006;Bottalico et al.,2016).
Disturbances can directly or indirectly release carbon to the atmosphere (Seidl et al.,2014),alter the age structure of forests (Meigs and Keeton,2018),and affect regional carbon fluxes,which subsequently impacts forest regrowth (Magnani et al.,2007).The age structures of forests determine the level of carbon accumulation,reflecting the spatial and temporal changes throughout the history of forest ecosystem disturbances;this carbon accumulation can change regional carbon cycles within a certain time period and affect subsequent forest regrowth(Magnani et al.,2007).Our results suggest that the time and frequency of disturbances of the different tree species affected the restoration periods of those species and the forest carbon storage levels.Forest disturbances in the oak plantation from 1989 to 2019 decreased the carbon stock,which did not fully recover to its original state until 2019;however,the carbon stocks in the Chinese fir and pine forests were restored to their original levels.The main reason for this result was that the total carbon densities of pine and Chinese fir increased gradually with age,reached their highest level after 50 years,and then decreased annually.However,the total carbon density still showed a gradually increasing trend in overmature oak forests;hence,forest management strategies could be customized for different forest species using the conclusions in this study.
In earlier forest management schemes in Lishui,the rotation period of Chinese fir was 26 years,whereas the rotation period of pine was 30 years.Consequently,to develop timber production and to promote the production of large-diameter timber,it was recommended to increase the rotation age of Chinese fir and pine to~50 years or longer.This not only improves the carbon sequestration capacity of the forest but also enhances the quality of wood production.Furthermore,given that oak has a higher carbon sequestration capacity over a longer time period than the other species investigated(Zhang et al.,2007)and is a zonal vegetation(Wang,1986),we determine that existing plantation management methods that promote the succession of coniferous forests to broadleaved forests,for example,by accelerating the transition of Chinese fir or pine to oak,would achieve more effective results.
Furthermore,forest harvesting methods and intensity affect forest biomass and productivity (Lei and Xiao,2015),which may alter the structures of plantations as well as soil water and heat conditions.This affects the growth of forest trees and their carbon storage and will also change the rate of soil organic matter decomposition and soil carbon emissions (Wu et al.,2014;Lei and Xiao,2015).In this study,by comparing the total ecosystem carbon under four harvesting strategies from 2020 to 2050,we found that the planned harvest area is suitable and is conducive to maximizing the carbon sequestration capacity of forests.
4.4.Methodological strengths and limitations
Compared with other carbon models like cellular automata (White and Engelen,2000) and Markov chains (Baker,1989),the STSM model has the ability to track multiple state variables such as forest age,forest cover type,etc.(Daniel et al.,2016).In contrast to LANDIS model(Scheller and Lucash,2015),the STSM model does not necessarily require knowledge of species life-history traits which always have wide variation (Orrell and Kunz,2016).Furthermore,the STSM model can simulate the structures and functions of forest ecosystems at different temporal and spatial scale and assist in developing proper management strategies for plantations while providing an accurate assessment of the roles of forests in relation to the global carbon balance.However,several aspects of the study may result in uncertainties.First,certain disturbances initiated by extreme weather events,such as fire,drought,wind,and snow,were included since forest disturbances and recoveries were identified via remote sensing-based analysis.Second,the effects of climate were not considered in our study,and only average historical weather data were used in the model.Third,there is typically a several-year time lag for the successful identification of forest recovery from remotely sensed data.Consequently,some early forest restoration events may not have been recognized by remote sensing methods and therefore could not be considered in the current model.Finally,other forest management activities,such as forest fertilization and forest disease and insect control,as well as the balance of economic gain and investment from forest management,could also be considered if relevant data are available.
Although the simplifications and assumptions mentioned above potentially affected the accuracy of the model,they had no obvious effects on the overall trend described in this report.In addition,other site conditions,such as site preparation,fertilization and thinning,were not included in the model due to the complexity and uncertainty of the dynamic vegetation model.We will continue to improve the simulation process and the accuracy of the model in subsequent research and will analyze the impacts of additional factors on the carbon cycle.
5.Conclusions
Through the implementation of the VCT algorithm,the IBIS process model,and the STSM land change model,the spatial and temporal dynamics of the carbon flux and storage of the three typical forest ecosystems in Lishui,southern China,were characterized.The research methods and results are useful for evaluating the carbon cycle process of forest ecosystems in this area and provide a model basis and theoretical reference for the establishment of a carbon cycle coupling model that is suitable for the forest ecosystems of southern China.These techniques can simulate the structures and functions of forest ecosystems at different spatial scales.Therefore,these results can contribute to the understanding of stabilization of the global climate and the reduction in greenhouse gases (CO2) in the ambient atmosphere and advance the assessment of the roles of forests in the global carbon balance.Thus,this study provides a prototype of a land change and carbon model for effectively managing and assessing regional carbon budgets.
Funding
This work was jointly funded by the following grants:the National Natural Science Foundation of China (31971577,31670552),the DOD ESTCP Program(RC_201703),and the PAPD(Priority Academic Program Development)of Jiangsu Provincial Universities(2017).
Availability of data and materials
The datasets used and/or analyzed during the current study are available from the corresponding author on reasonable request.
Authors’contributions
Jiaojiao Diao:Conceptualization,Methodology,Software,Resources,Writing-Original draft preparation,Writing -Review &Editing.Jinxun Liu:Conceptualization,Methodology,Software,Data Curation,Writing-Review &Editing.Zhiliang Zhu:Conceptualization,Writing-Review&Editing.Xinyuan Wei:Writing -Review &Editing.Mingshi Li:Conceptualization,Supervision,Funding acquisition,Writing -Review &Editing.
Ethics approval and consent to participate
Not applicable.
Consent for publication
Not applicable.
Declaration of competing interest
The authors declare that they have no competing interests.
Acknowledgements
The authors would like to acknowledge the Zhejiang Provincial Center for Forest Resources Monitoring for sharing their forest inventory data.The authors appreciate ApexRMS team for providing SyncroSim software and ST-Sim State-and-Transition Simulation Model.In addition,all the authors are grateful to Prof.Xianli Wang for his valuable suggestions to improve the draft of the manuscript.Any use of trade,firm,or product names is for descriptive purposes only and does not imply endorsement by the U.S.Government.
List of abbreviations
AFM Active Forest Management
DGVM Dynamic Global Vegetation Model
FRSS Forest Resources Sampling Survey of Zhejiang Province
HWP Harvest Wood Production
IBIS Integrated Biosphere Simulator
RMSEs Root Mean Square Errors
STSM State-and-Transition Simulation Model
PFTs Plant Functional Types
NPP Net Primary Productivity
VCT Vegetation Change Tracker
- Forest Ecosystems的其它文章
- Two-level optimization approach to tree-level forest planning
- No treeline shift despite climate change over the last 70 years
- Variation in water supply leads to different responses of tree growth to warming
- Patterns and driving factors of leaf C,N,and P stoichiometry in two forest types with different stand ages in a mid-subtropical zone
- Forest height mapping using inventory and multi-source satellite data over Hunan Province in southern China
- Conifer establishment after the eruption of the Paricutin volcano in central Mexico

