
Carbonic anhydrase inhibitor U-104 inhibits tumor progression through CA9 and CA12 in tongue squamous cell carcinoma
2021-12-04 08:54YangZixuanZhangXuehanShenTaoShiRonghuaWangXiangting
中国科学技术大学学报 2021年5期
Yang Zixuan, Zhang Xuehan, Shen Tao, Shi Ronghua, Wang Xiangting*
1. Division of Life Sciences and Medicine, University of Science and Technology of China, Hefei 230026, China;2. Core Facility Center for Life Sciences, School of Life Sciences, University of Science and Technology of China, Hefei 230026, China
Abstract: U-104, an effective inhibitor of carbonic anhydrases (CAs), has been shown as a potential anti-tumor drug in several human cancer types.However, the downstream mechanisms of U-104 and its functions in tongue squamous cell carcinoma (TSCC) remain unclear. It is neither confirmed that whether the anti-tumor effects of U-104 are dependent on CA9 and CA12. In this work, we found differentially expressed genes (DEGs) and potential cellular processes regulated by U-104 through RNA sequencing. The cell death-related, cell proliferation, migration and response to drug cellular processes were among the top GO (gene ontology) processes, which were consistent with the observed biological effects upon U-104 treatment in TSCC15 cells. Furthermore, knockdown (KD) of CA9 or CA12 completely eliminated the U-104 effects on the cell migration, cell death, and the expression of critical DEGs. All together, our study suggests the regulatory mechanisms of U-104 at the transcriptome level and demonstrates the anti-tumor functions of U-104 dependent on CA9 and CA12 in TSCC. Our findings expand the current knowledge on the anti-tumor functions of U-104 and provide a potential therapeutic option for TSCC.
Keywords: carbonic anhydrase inhibitor; U-104; CA9; CA12; tongue squamous cell carcinoma
1 Introduction
Carbonic anhydrases (CAs) are metalloenzymes that catalyze hydration of CO2to bicarbonates and protons. In human cells, 15 α-CA isozymes have been described[1]. Among these, CA9 and CA12 are the two transmembrane isozymes that are aberrantly upregulated in tumors[2]. Both CA9 and CA12 contribute to regulate tumor microenvironment pH homeostasis, promote tumor cell growth and accelerate tumor progression[2]. Interfering with the expression of tumor-associated CA9 or CA12 results in impaired tumor growth and reduces the population of cancer stem cells[3,4]. It has been suggested that CA9 and CA12 are promising anti-tumor targets[3-5].
The CA inhibitors (CAIs) area group of agents in different formats to inhibit the catalytic activity of CA family members[6]. Some CAIs have been shown to effectively slow down the progression of cancer[7]. U-104 (also known as SLC-0111) is an ureido-substituted benzene sulfonamide derivative CAI, which acts by binding to the catalytic Zn2+ion in the active site of the enzyme and blocking its function[6]. In vitro enzyme activity assay has confirmed that U-104 can selectively and effectively inhibit CA9 and CA12 enzyme activities[8,9]. Vivo and ex vivo studies showed that U-104 can inhibit the growth and metastasis of several types of solid tumors including breast cancer, colon cancer and pancreatic cancer[10-12]. Recently, U-104 has been applied into phase Ib clinical trial as an antitumor/antimetastatic agent in pancreatic cancer[12,13]. In addition, U-104 has been reported to induce a notable depletion of the cancer stem cell population in breast cancer[14]. U-104 also shows properties to sensitize tumor cells to traditional chemotherapy[14,15]. However, the downstream molecular networks regulated by U-104 remain largely unclear. Whether the anti-tumor effects of U-104 are dependent on CA9 and CA12 is not explored either.
Tongue squamous cell carcinoma (TSCC) is a malignancy with high incidence and mortality in males, and high risk of metastasis in early stage[16,17]. The tongue is located in the oral cavity with a rich lymphatic drainage and dense neural network, which provides a beneficial environment for tumor cells to gain access to the lymph vascular compartment and accelerate the locoregional metastasis[16]. For decades, the 5-year survival rate of TSCC patients remains approximately 50%[18]. The standard treatment of primary TSCC is surgical resection with adjuvant radiotherapy or chemoradiotherapy[19]. CA9 was evaluated as a contributor to chemoresistance of the tongue cancer and may become a predictor for TSCC[20,21]. However, the role of CA9 and CA12 in TSCC progression has not been reported before. Additionally, the targeted therapy is still a relatively new concept for TSCC[19]. Exploring novel targeted drugs, such as U-104 that inhibits the CA9/CA12 activities, may become promising for TSCC therapeutics.
In this work,we evaluated the effects of U-104 as well as RNA interfering against CA9 and CA12 on TSCC15 cell proliferation, migration and cell death. Through the RNA sequencing analysis, we revealed the downstream cellular processes regulated by U-104 and further discovered critical U-104-regulated DEGs including TGFB2, ITGB3 and TNFAIP3. In addition, we showed that the anti-tumor effects of U-104 and its regulation on TGFB2, ITGB3 and TNFAIP3 were dependent on CA9 and CA12. Altogether, our study expands the current knowledge of U-104’s anti-tumor effects at the transcriptome level.
2 Materials and methods
2.1 Cell culture and transfection
The human TSCC15 cell line was purchased from the American Type Culture Collection (ATCC). TCC15 cells were cultured in Dulbecco’s modified Eagle’s medium/Nutrient Mixture F-12 (DMEM/F-12) medium (Sigma, USA), containing 10% of the fetal bovine serum (FBS, Biological Industries, Israel) and 1% of penicillin-streptomycin (WISENT Inc, CA) in a humidified incubator at 37 ℃ with 5% of CO2. The siRNA oligos were designed and synthesized by Ribobio (Guangzhou, China). The sequence information of the siRNA oligos is listed in Supplementary Table S1. The transfection of the siRNA was finished by Lipofectamine TM 3000 Reagent (Invitrogen, USA) according to product instructions.
2.2 Carbonic anhydrase inhibitors treatment
U-104 and topiramate (Apex Bio, USA) were dissolved in DMSO following product instructions. All compounds were stored at -20 ℃ prior to use. When the cell density was around 50%, 50 μmol/L or 100 μmol/L CAI was incubated with cells for 24 h or 48 h. For the CAI treatment of cells transfected with the siRNA oligos, 24 h after transfection, 100 μmol/L CAI was incubated for another 24 h.
2.3 BCECF-AM assay
BCECF-AM kit (Invitrogen, USA) was used to determine intracellular pH. BCECF-AM is a sensitive indicator of intracellular pH, which can penetrate the cell membrane and be hydrolyzed into BCECF by phosphatases in the cell. BCECF can be excited to produce green fluorescence, intensity of which indicates the intracellular pH value. A more acidic intracellular environment will show a higher fluorescence intensity. Cell suspensions were prepared in HEPES buffer at a concentration of 3×10⁶cells/mL. 1 mmol/L BCECF-AM/DMSO solution was added to the cell suspension to the 3 μmol/L final concentration of BCECF-AM. After 30-min incubation at 37 ℃, the cells were washed with HEPES buffer 3 times and adjusted to the same density. Finally, the fluorescence intensity of the cells was measured by the fluorescence microscopy.
2.4 Colony formation assay
200 cells were seeded in 6-well cell culture plates (Corning, USA). 3 days later, U-104 or TPM was added to the fresh culture medium. At day 14 after seeding, cells were fixed with 4% of paraformaldehyde (Sangon, USA) and stained by 0.25% of the crystal violet. Colonies containing over 50 cells were counted manually under the microscope.
2.5 Cell migration assay
The cell migration assay was performed with 8 μm pore size chambers in 24-well cell culture plates (Corning, USA). 2×10⁵cells were suspended in 100 μL serum-free medium and added to the upper chamber. Medium containing 20% of FBS was added to the bottom chamber. After 24 h incubation in the cell culture incubator, upper cells that didn’t migrate across the chamber were washed and removed. Then membranes were fixed with 4% of paraformaldehyde and stained by 0.25% of the crystal violet. Migrated cells from 5 random fields were counted under the microscope and then the migration rate was calculated.
2.6 Wound cutting assay
6×10⁵TSCC15 cells were cultured in 6-well cell culture plates until margins of cell communities fused. A straight line was drawn by using a 200 μL sterile plastic pipette tip. Then cell residues were removed by PBS washing. The serum-free DMEM/F12 medium added with 100 μmol/L U-104 or TPM was used during the cell migration test. The wound healing effect was evaluated at 0, 12, and 24 h through photographs.
2.7 Hoechst 33342/PI dual staining assay
Cell death was detected by Hoechst 33342/PI dual staining kit (Solarbio Science & Technology, China). For adhesion cells, after washing cells with cold PBS, staining buffer, Hoechst 33342 and PI were added in turn. After 30-min incubation (protecting from light) at 4 ℃, cells were washed with cold PBS and then images of 5 random fields were captured under the fluorescence microscope. PI-positive staining cells represented both red and bright blue fluorescence were considered as dead cells. The percentage of cell death was calculated by the average ratio of PI-positive cells in the 5 random image fields.
2.8 RNA sequencing and data analysis
TSCC15 cells were divided into two groups named as the DMSO control group and the U-104 treated group. Total RNA was extracted from TSCC15 cells using TRIzol (Ambion, USA). Prior to the high-throughput sequencing analysis, an aliquot of the RNA from each sample was reverse transcribed. The RNA library construction and sequencing were all performed by BGI Genomics using the DNBSEQ platform. The differentially expressed genes (DEGs) were determined by using |log2FC| ≥ 0.5 and Q value < 0.05 as criteria. The gene ontology (GO) was analyzed in the “Dr. Tom” system provided by BGI Genomics. The heatmap was drawn using the R package “pheatmap”.
2.9 RNA isolation and reverse transcription (RT)-quantitative PCR (qPCR)
Total RNA of TSCC15 cells was extracted with TRIzol according to the manufacturer’s instructions. Then the reverse-transcription was finished by the HiScript II 1st strand cDNA synthesis Kit (Vazyme, China). The real-time PCR was performed using SYBR©Green Master Mix (Vazyme, China) on Light Cycle©96 (Roche, USA). 18S ribosomal RNA was used as the internal control to analyze the relative quantification. Primers for the real-time PCR are listed in Supplementary Table S2.
2.10 Statistical analysis
All data were presented as the mean ± SEM. Statistical significance was carried out by two-tailed Student’s t-test for the comparison of two groups. A value ofP<0.05 was considered statistically significant.
3 Results
3.1 U-104 inhibits TSCC proliferation, migration and promotes cell death
To determine the effects of U-104 on TSCC, we treated TSCC15 cells with 100 μmol/L U-104. At the same time, topiramate (TPM), a weaker CAI that may have potential to inhibit tumor development[22], was used as a control for U-104. With the same initial cell density and incubation time, the U-104 treatment changed the morphology of the cell community and decreased the cell density (Figure 1(a)). The BCECF-AM assay showed U-104 interfered with intracellular pH homeostasis of TSCC15 (Figure S1), which implied that U-104 inhibited CA9 and CA12 enzyme activities. Moreover, the colony formation ability of TSCC15 was significantly suppressed by U-104 (Figure 1(b)). Based on the morphology change of cell margins, we inferred the migration of cells may be affected so cell migration assays were performed to detect the migration ability of TSCC15 treated by U-104. Results showed that U-104 inhibited the migration of TSCC15 while TPM showed no inhibition effects (Figure 1(c, d)). Next, we examined the effect of U-104 on cell death by the Hoechst 33342/PI dual staining experiment. U-104 induced a higher cell death rate of TSCC15 according to the quantification analysis (Figure 1(e)). These data indicated that U-104 could suppress the proliferation and migration of TSCC15 and induce cell death.
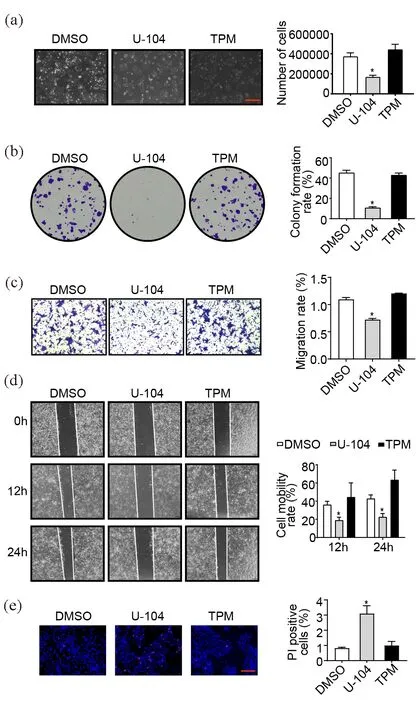
Figure 1. U-104 inhibits TSCC proliferation, migration and promotes cell death. (a) Morphological features and cell density of TSCC15 treated by U-104. The results were shown at 100× magnification (scale bar, 1mm) (n=3). (b) Representative images of the colony formation assay to compare the proliferation abilities of TSCC15 cells treated by U-104 and TPM (n=3). (c, d) The migration abilities of TSCC15 determined by transwell assay (c) and wound cutting assay (d) after CAI treatment. The results were shown at 100× magnification (n=3). (e) Representative images of the Hoechst 33342/ PI staining to determine the cell death rates of TSCC15 cells treated by U-104 and TPM. The results were shown at 200× magnification (scale bar, 500μm) (n=3). Data were presented as mean±SEM. *P<0.05.
3.2 Functions of U-104 are related to cell death, proliferation and migration processes analyzed by RNA sequencing
To explore the downstream networks regulated by the U-104 inhibition, we submitted RNA samples of U-104-treated and DMSO-treated control TSCC15 cells for RNA sequencing. There were 544 differentially expressed genes (DEGs) between the U-104 treated and control group (|log2FC|≥ 0.5 and Q value< 0.05) (Figure 2(a)). Furthermore, the GO enrichment analysis indicated the cellular processes in which these DEGs participated. Consistent with our observations on cell biological functions, the top 20 GO processes included apoptotic process, cell migration, regulation of cell proliferation and response to drug (Figure 2(b)). We screened out and validated the top 10 upregulated and downregulated DEGs enriched into these processes based on log2fold change and expression levels of DEGs (Figure 2(c-e)). In addition, CA9 and CA12 were not among the DEGs, and several genes among the top 10 downregulated or upregulated DEGs were related to the microenvironment pH regulation[23,24], which hinted that these genes might respond to the pharmacological inhibition of CA9 and CA12.
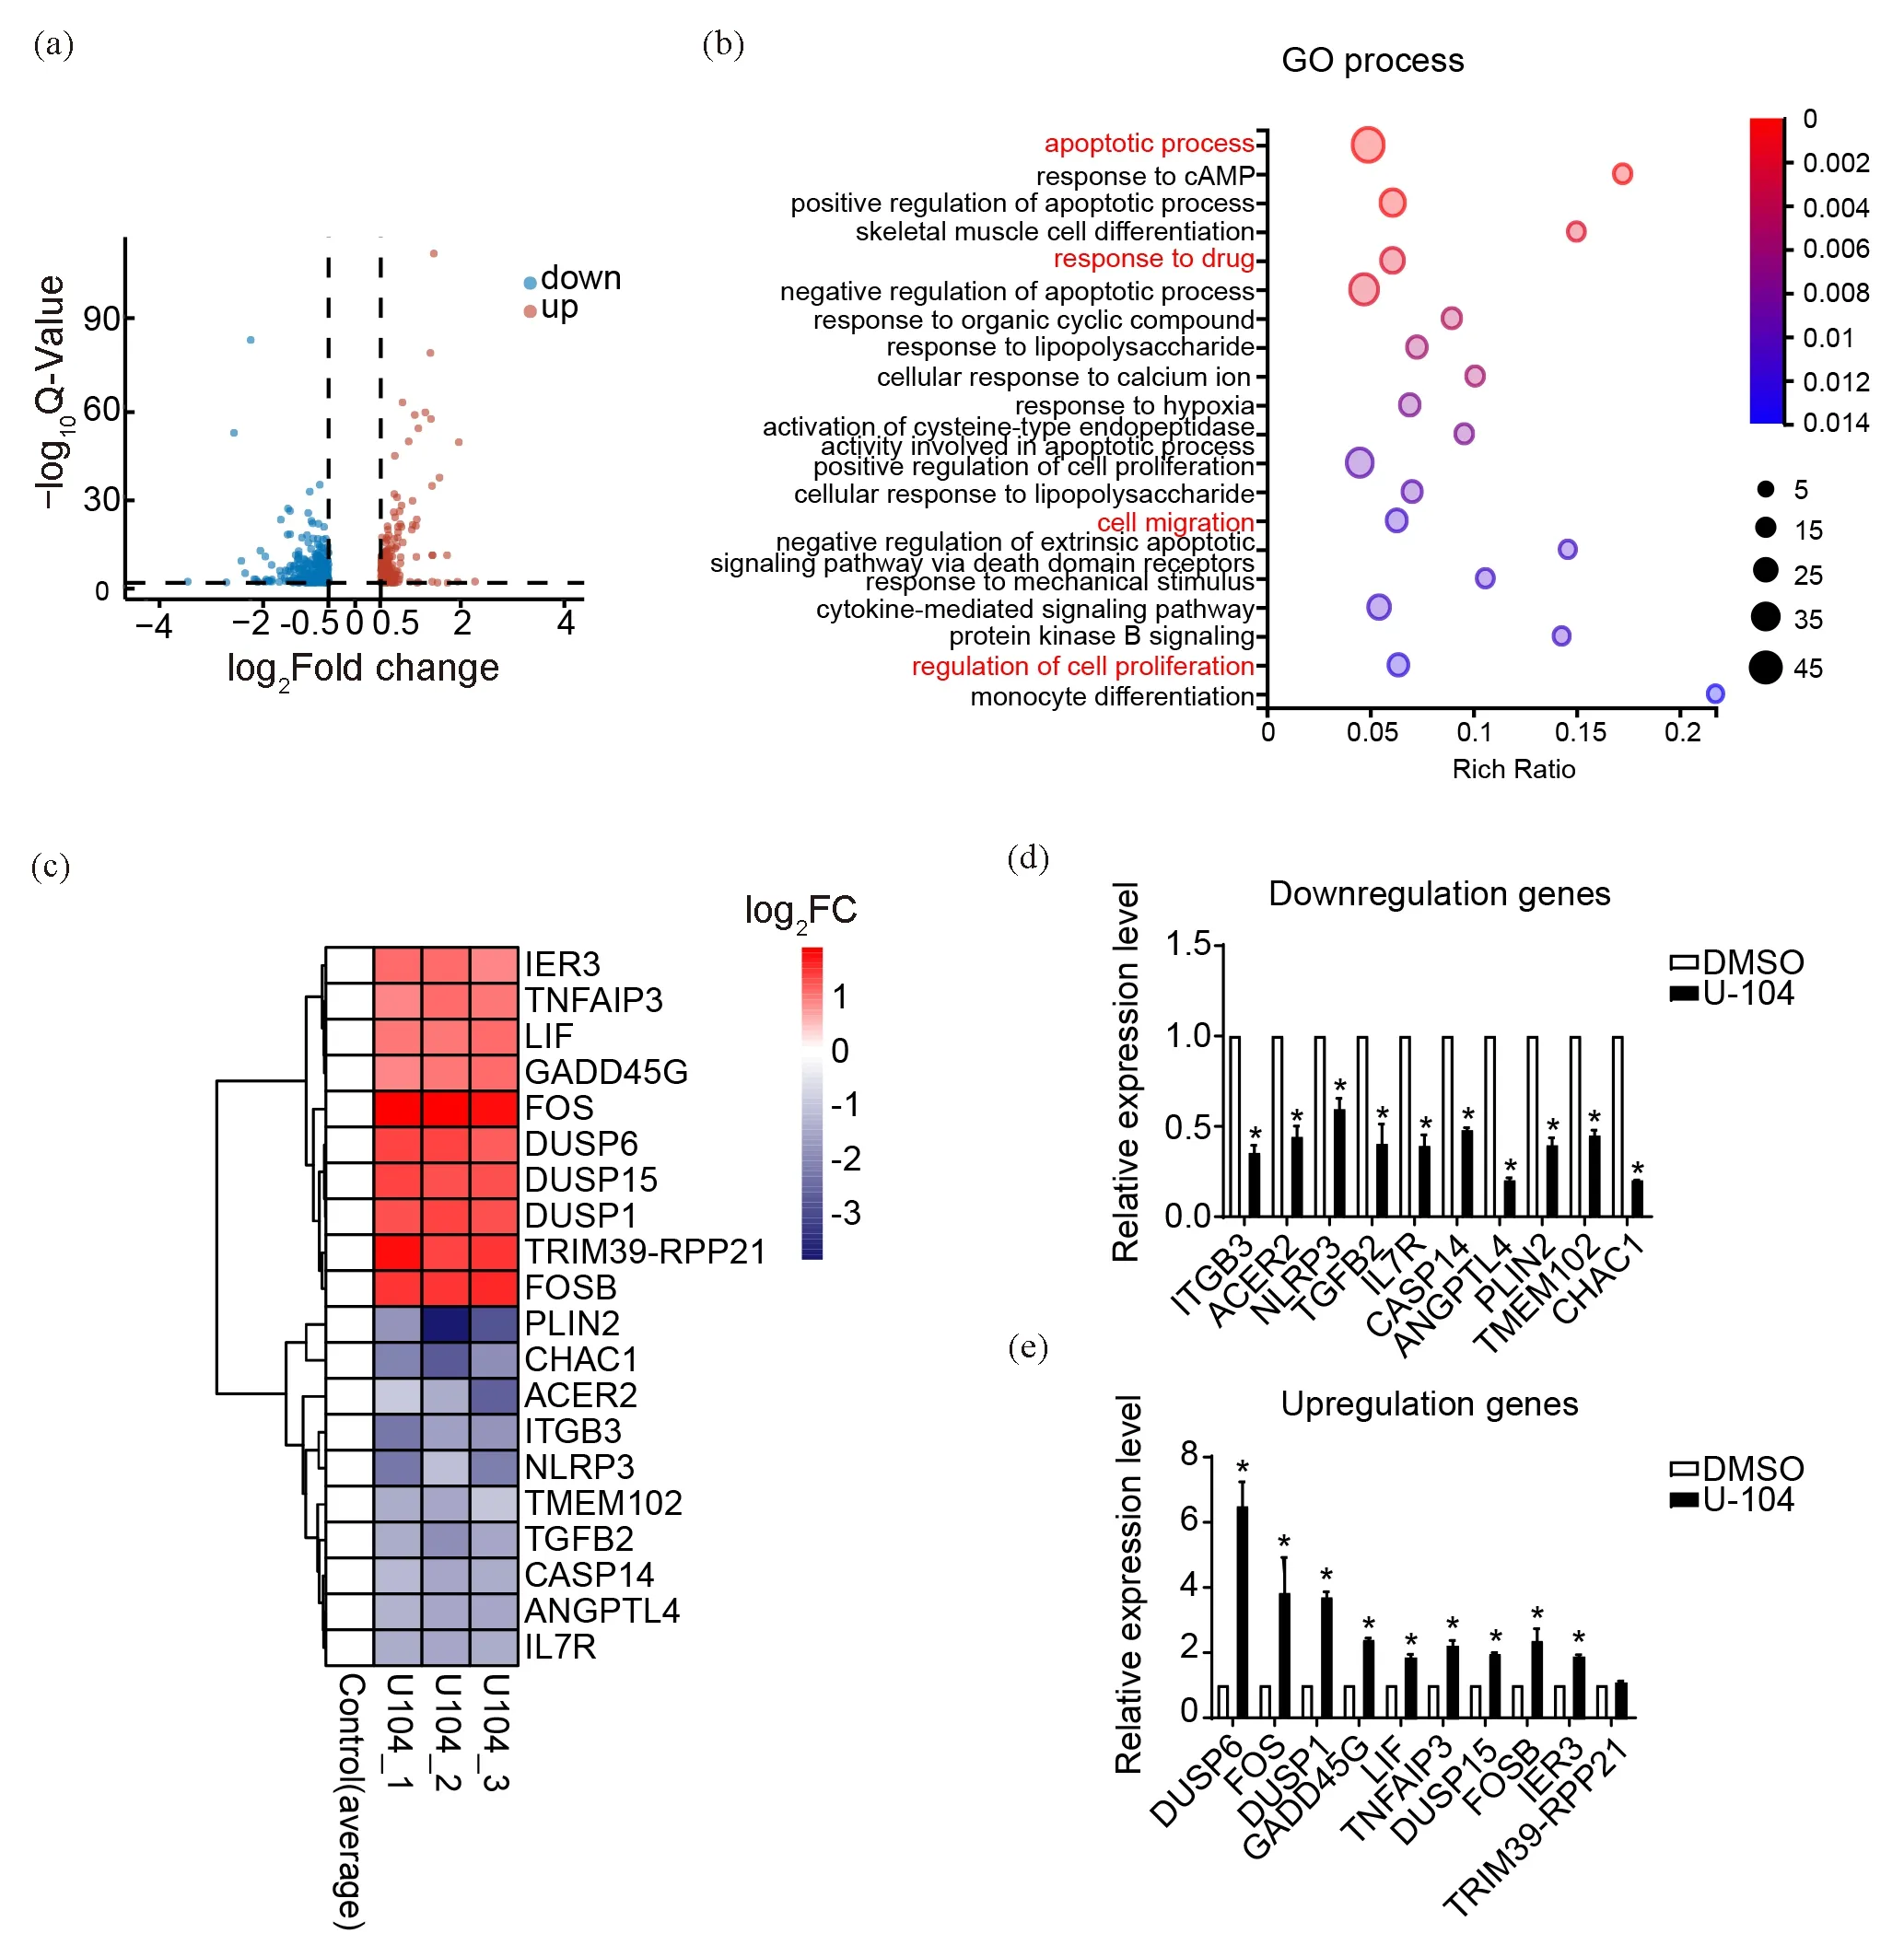
Figure 2. Functions of U-104 are related to cell death, proliferation and migration processes analyzed by RNA-sequencing. (a)Volcano plot displayed 544 differentially expressed genes (DEGs) after U-104 treatment. (b) GO process enrichment of the 544 DEGs between the U-104 treated group and control group. (c) Cluster heat map of the top 10 downregulated and upregulated DEGs enriched in apoptotic, response to drug, migration, proliferation-related cellular process. (d, e) RT-qPCR validation of the top downregulated DEGs (d) and upregulated DEGs (e) in (c) (n=3). Data were presented as mean±SEM. *P<0.05.
3.3 CA9 and CA12 are required for TSCC cells proliferation, migration and survival
CA9 and CA12 are important regulators of tumor microenvironment homeostasis in many tumors[2,25]. Functions of CA9 and CA12 in TSCC have not been evaluated so we investigated the role of these two isozymes in the TSCC development. We respectively knocked down the expression level of CA9 or CA12 mRNA by RNA-interference. Then colony formation assay was performed to test the proliferation ability of CA9 or CA12 knockdown (KD) TSCC15 (Figure 3(a,b)). As expected, CA9 or CA12 KD TSCC15 showed a lower colony formation rate, suggesting the positive role of CA9 and CA12 in the TSCC15 proliferation. Next, the transwell assay indicated that knocking down CA9 and CA12 significantly reduced the migration ability of TSCC15 (Figure 3(c,d)). In addition, CA9/CA12 KD TSCC15 showed higher rates of cell death (Figure 3(e,f)). All results showed that CA9 and CA12 were required for the TSCC proliferation, migration and cell survival.
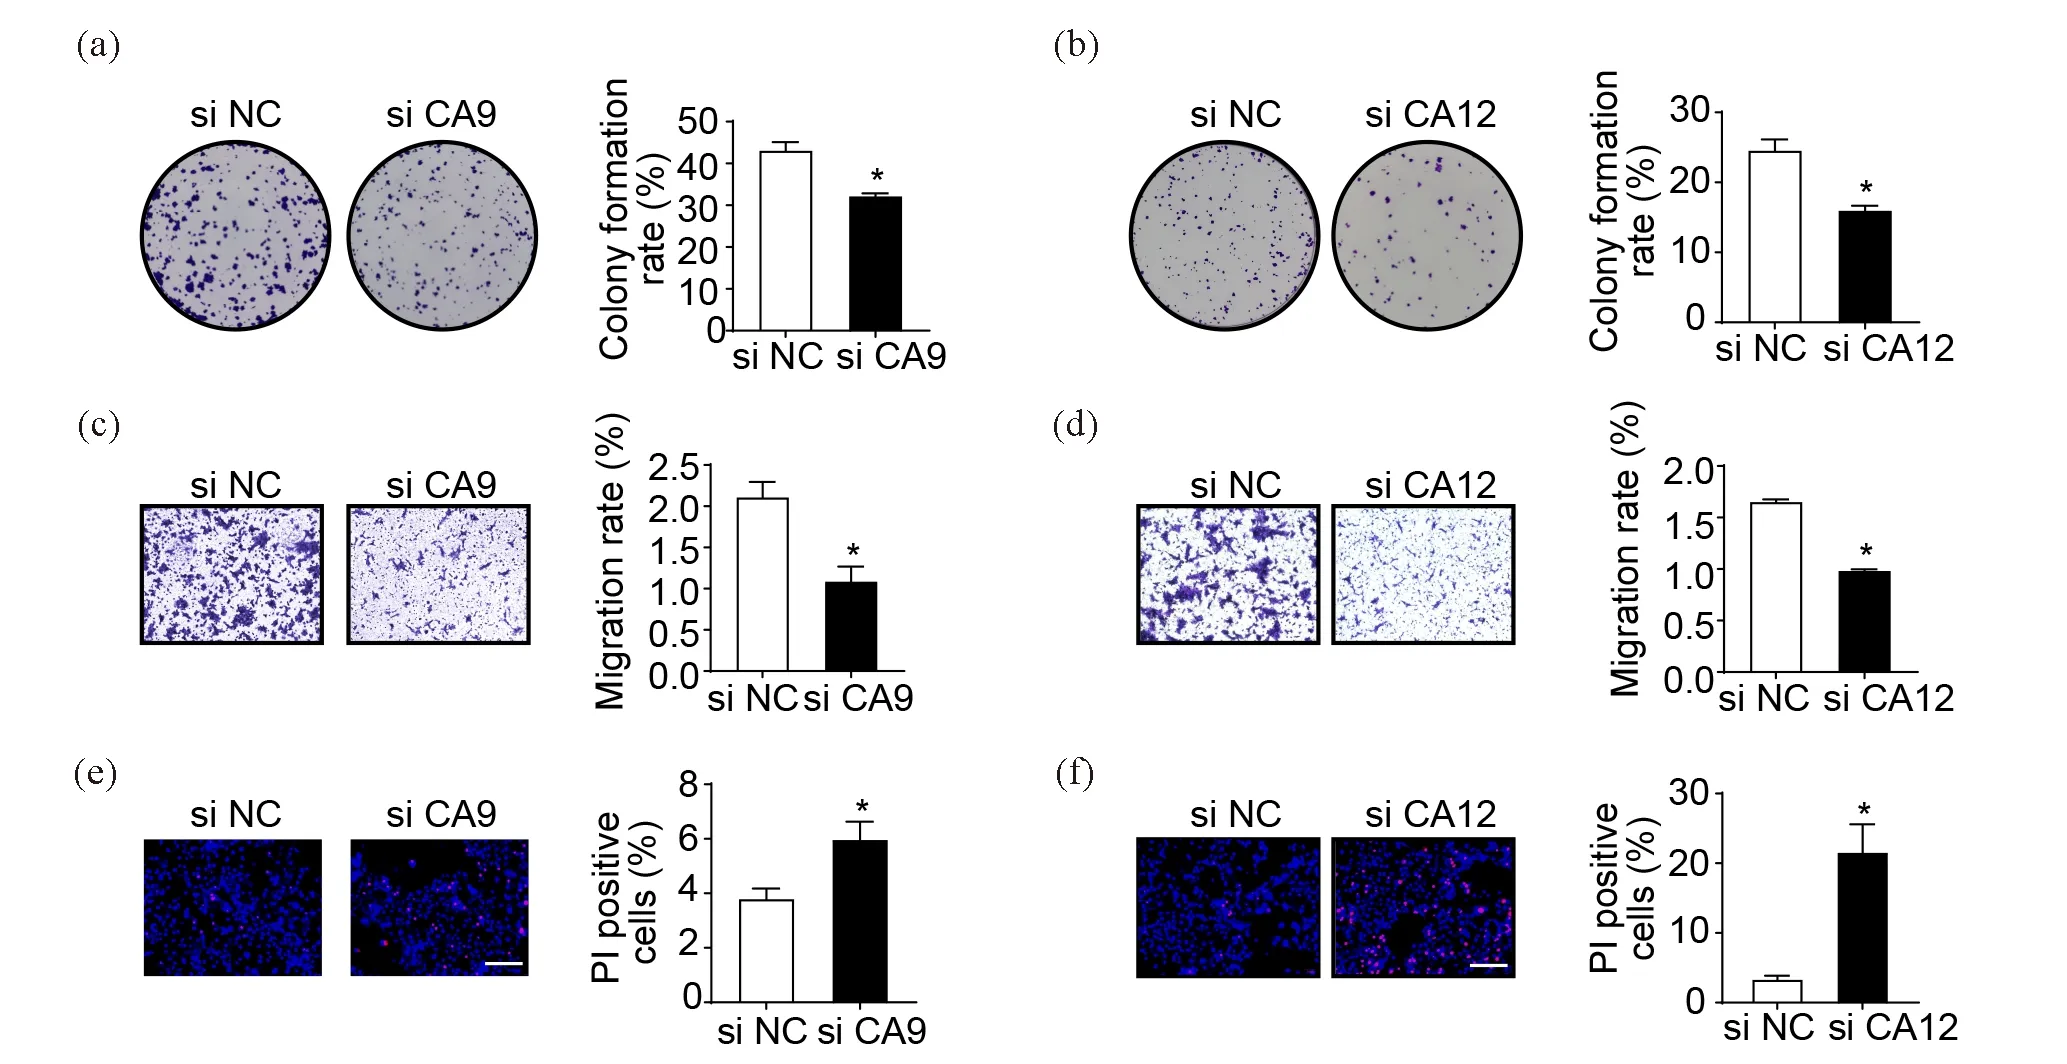
Figure 3. CA9 and CA12 are required for TSCC cells proliferation, migration and survival. (a, b) Representative images of colony formation assay to demonstrate the proliferation abilities of CA9 or CA12 KD TSCC15 cells. (c, d) Representative images of transwell assay demonstrating the migration abilities of CA9 or CA12 KD TSCC15 cells. The results were shown at 100× magnification. (e, f) Representative images of the Hoechst 33342/ PI staining to determine the cell death rates of CA9 or CA12 KD TSCC15 cells. The results were shown at 200× magnification (scale bar, 500μm) (n=3). Data were presented as mean ± SEM.*P<0.05.
3.4 U-104-mediated anti-tumor events and regulation of critical DEGs are dependent on CA9 and CA12
To examine whether U-104 inhibited TSCC progression dependent on its pharmacological target CA9 and CA12, we treated CA9 or CA12 KD TSCC15 cells with U-104, then counted the rates of cell migration and cell death. As expected, in CA9 or CA12 KD TSCC15, U-104 did not significantly inhibit cell migration or induce cell death (Figure 4(a-c)), which suggested that the U-104-induced migration attenuation and cell death were dependent on CA9 and CA12. Interestingly, expression levels of TGFB2, ITGB3, and TNFAIP3 that have been validated as DEGs were not regulated by U-104 in CA9 or CA12 KD TSCC15 (Figure 4(d)). This indicated that U-104 regulated the expression of these DEGs dependent on CA9 and CA12. TGFB2 and ITGB3 often cooperatively promote the epithelial-to-mesenchymal transition (EMT)[24,26,27]. TNFAIP3 encodes the protein A20, whose degradation target is RIPK1, an essential factor in the activation of NF-κB signaling[28,29]. RIPK1 was also one of the downregulated DEGs in the results of the RNA sequencing. RT-qPCR results suggested that these three DEGs may be the potential downstream targets of CA9/CA12 inhibition. All results indicated that the anti-tumor events caused by U-104 were dependent on CA9 and CA12.

Figure 4. U-104-mediated anti-tumor events and regulation of critical DEGs are dependent on CA9 and CA12. (a) Representative images of transwell assay demonstrating the migration abilities of CA9/CA12 KD TSCC15 cells treated by U-104. The results were shown at 100× magnification (n=3). (b, c) Representative images of the Hoechst 33342/ PI dual staining demonstrating the cell death rates of CA9 KD TSCC15 cells (b) and CA12 KD TSCC15 cells (c) treated by U-104. The results were shown at 200× magnification (scale bar, 500μm) (n=3). (d) The RT-qPCR analysis showed the DEGs that were not affected by U-104 in CA9 or CA12 KD TSCC15 cells (n=3). Data were presented as mean ± SEM.*P<0.05.
4 Discussion
Although U-104 has been progressed to phase the Ib clinical trial in pancreatic cancer, the anti-tumor impact of U-104 is limited to a few types of solid tumors[12,13]. The molecular mechanism of the U-104’s anti-tumor impact is also largely unexplored. In the present work, we investigated the anti-tumor impact of U-104 in TSCC15 cells, revealed the downstream cellular processes regulated by U-104 through transcriptome analysis, and demonstrated the requirement of CA9 and CA12 in U-104-mediated anti-tumor effects and regulation on the critical DEGs.
U-104 has been reported to interfere with several signaling pathways that mediate key processes in tumor development. The U-104 treatment has been shown to inhibit the mTOR signaling or KRAS pathway, and slowed down the tumor growth in breast cancer and pancreatic cancer[10,14]. To comprehensively analyze the downstream molecular networks regulated by U-104, we performed the transcriptome analysis and demonstrated 544 DEGs regulated by U-104 in TSCC15 cells. These DEGs were enriched for genes that are involved in cell death-related, cell migration, cell proliferation and response to drug processes, which are in agreement with our observed biological effects upon the U-104 treatment. Therefore, our results will provide valuable information and insight to understand the molecular mechanisms of U-104 in tumor cells.
The current knowledge of U-104 only shows that U-104 specifically inhibits CA9/CA12 activities and slows down a few types of tumor progression, but it is still unclear that whether the inhibitory effects of U-104 are dependent on CA9 and CA12. In the present work, we found that both U-104 treatment and knockdown of CA9 and CA12 exhibited similar anti-tumor effects on TSCC. We further determined that the anti-tumor effects of U-104 are dependent on CA9 and CA12. TGFB2, ITGB3, TNFAIP3 are the three critical DEGs identified from the U-104 treated TSCC15 cells by RNA-Seq. TGFB2 and ITGB3 have been reported to promote the tumor EMT progression through the TGFβ signaling pathway[24,26]. TGFB2 is involved in the uptake of fatty acids for storage or immediate use to generate energy and in the adaptation of cancer cells to the acidic microenvironment[24]. ITGB3 has been shown to interact with CA9[30]. The silencing of CA9 has been shown to decrease ITGB3 expression[31]. TNFAIP3 is a key factor of the TNF signaling pathway, which inhibits the NF-κB system to favor necroptosis[28]. We demonstrated that regulations of these critical DEGs by U-104 are also dependent on CA9 and CA12. These results together prove that the anti-tumor effects of U-104 are mediated by CA9 and CA12.
The 5-year survival rate of TSCC patients has no significant improvement in recent years[18]. Tongue cancer has been reported to be insensitive to immunotherapy and chemotherapy and lack effective targeted therapy strategies[32,33]. It has been proposed that targeting tumor microenvironment pH homeostasis may sensitize tumors to chemotherapy and immune-checkpoint blockade[15,33,34]. Our results of the modulated cellular pH in the presence of U-104 is in agreement with its function as a CA inhibitor. In melanoma, breast cancer, glioblastoma and colorectal tumors, U-104 exhibits enhanced anti-tumor effects in combination with therapeutics of conventional chemotherapy or immunotherapy[11,15,34]. It is plausible to propose that the utilization of U-104 can improve the outcome of the TSCC immunotherapies. Therefore, by exploring the genome-wide modifications in U-104-treated tumor cells and determining its requirement on CA9/CA12, our work not only provides a great value for the deeper understanding of the anti-tumor effects mediated by U-104, but also builds up fundamental knowledge for its potentially expanded applications in the anti-tumor therapy.
Supplementary data
Supplementary data are available at J. Univ. Sci. Tech. China online.

- 中国科学技术大学学报的其它文章
- A navigational system for investigating multi-sensory integration in Caenorhabditis elegans
- Regulatory role of phosphorylation in NLRP3 inflammasome activation
- Impact of COVID-19 pandemic on stock market via sparse principal component analysis
- Pricing strategies of laborer-sharing platform in two transaction modes
- The stable subgroups of Sn acting on M0,n
- Cycle lengths in graphs of chromatic number five and six