
A navigational system for investigating multi-sensory integration in Caenorhabditis elegans
2021-12-04 08:54ZhaoBingzhenLuoLinjiaoWenQuan
中国科学技术大学学报 2021年5期
Zhao Bingzhen, Luo Linjiao, Wen Quan*
1. Division of Life Sciences and Medicine, University of Science and Technology of China, Hefei 230027, China;2. Department of Physics, Nanjing University, Nanjing 210093, China
Abstract: Animals use different sensory cues to guide their behaviors. How a nervous system performs multi-sensory integration remains an open question in neuroscience. Here, we study how the nematode Caenorhabditis elegans integrates temperature and salt stimuli, two environmental cues that are essential for survival. We report the development of a navigational system that allows stable, linear, and orthogonal temperature gradient and salt gradient to be simultaneously presented to an animal. By combining this setup with a tracking and calcium imaging system, we analyze the behavioral strategies of C. elegans and investigate the functions of two cilia sensory neurons—AFD and ASER—that attend the behavior. Our work opens a new window into interrogating the neural mechanisms for multi-sensory integration in a compact nervous system.
Keywords: behavioral system; temperature gradient; salt gradient; multi-sensory integration
1 Introduction
Animals are continuously bombarded by information from the external world. The integration of sensory information is essential for decision making. Where and how a brain processes multiple sensory signals have been extensively investigated. In mammals, several brain regions are known to be involved in the multi-sensory integration (MSI)[1-4], especially the superior colliculus (SC). Meredith and Stein[2]first demonstrated that SC neurons could combine visual, tactile, and auditory cues. They also identified three empirical principles that are thought to be conserved across all vertebrates. The first principle is called the temporal rule[2,3,5], namely the inter-stimulus interval (ISI) between two sensory inputs is a key determinant of the magnitude of a neuronal response. The temporal rule in the optic tectum ofXenopustadpole, a brain region that is homologous with the mammalian SC, has been shown to arise from synaptic inhibition[5]. The second principle is called the spatial rule[2,6]: MSI depends on the overlap between the spatial receptive fields of two sensory stimuli[6]. The third principle is called the inverse effectiveness[2,7-10]: the enhancement of the multi-sensory response is inversely related to the size of uni-sensory responses.
In invertebrates, specialized brain regions that process multiple sensory cues have also been identified. Visual and chemosensory signals are integrated in the mushroom body ofDrosophilato regulate courtship[11]. The same brain region in buttery can modulate an animal’s color preference in different odor contexts[12]. Like vertebrates, an insect can enhance its sensitivity to multiple sensory cues. An auditory neuron, AN2, in cricket (Gryllusbimaculatus) can detect airow and ultrasonic call from a bat, and AN2 significantly increases its firing rate when the two mechanosensory stimuli are simultaneously present[13].
Many previous works have focused on how a single neuron integrates crossmodal stimuli. The three empirical principles, derived from single neuron recording and behaviors, must emerge from sensorimotor transformation across the entire nervous system. Nevertheless, how MSI is performed in the context of a neural circuit is much less understood. With a connectome at synaptic resolution[14]and powerful genetics,Caenorhabditiselegansoffers a unique opportunity to investigate neural circuit mechanisms for multi-sensory integration.C.eleganscan perceive many environmental cues, including odor[15], chemicals[16,17], temperature[18,19], mechanosensory inputs[20]and light[21]. The functions of sensory neurons required for perception have been well characterized[21-24]and the behavioral strategies for uni-sensory responses have also been well studied[23,25-28].
Temperature and salt are two important sensory cues for animals’ survival. Hedgecock and Russell[18]first reported thatC.eleganscould remember the temperature in its past cultivation condition: when navigating on a plate with a temperature gradient, animals would migrate towards their cultivated temperature, called thermotaxis. Likewise,C.eleganscan remember the salt (NaCl) concentration in its previously cultivated environment, called chemotaxis[17,29]. The neural circuits underlying thermotaxis and chemotaxis have been extensively studied. Neurons specifically required for thermotaxis[23,28,30]and chemotaxis[17,31]have been identified by cell ablation studies, making the two behavior paradigms ideal for investigating MSI. Here, we built a navigational system that could produce a spatially stable linear temperature gradient and salt gradient on a 2-dimensional arena. When the two gradients were simultaneously present and orthogonal to each other,C.eleganswould move in the quadrant defined by the axes of the two spatial gradients. In the meantime, we monitored calcium activity in cilia sensory neurons AFD and ASER, which encode a dynamic change of temperature and salt concentration, respectively. While theC.elegansconnectome suggests the presence of chemical synapses between ASER and AFD, we did not find evidence for cross-talk between the two sensory neurons: AFD responded only to an increase of the temperature; ASER responded only to a decrease of salt concentration. Our results suggest that the integration of the two sensory signals is the computed downstream of sensory neurons.
2 Materials and methods
2.1 Experimental setup
We developed a behavioral system to produce stable, linear temperature and chemical gradients in orthogonal directions. The base of the arena is a light, heat-conductive aluminum plate, 140 mm×90 mm×5 mm in size. To generate a thermal gradient, we cooled one side of the arena and heated the opposite side. A large 70 mm×60 mm×1 mm sapphire glass, which possesses excellent thermal conductivity and optical transparency, was embedded in the center of the arena. An agar pad, on which worms moved, was placed on the sapphire glass. The whole device was placed under a tracking microscope that allows imaging neural activities and animal behaviors simultaneously. To reduce the heat exchange, the aluminum plate was insulated from its surroundings by nylon and wrapped by a thin film (Figure 1(a))[32,33].

Figure 1. Schematic diagram and tests of the behavioral system. (a)The behavioral system.① water pump;②water drain and fans;③relay;④PID temperature controller;⑤heat insulation(nylon);⑥liquid-cooled water block;⑦ arena;⑧aluminum plate;⑨PI heating membrane;⑩water pipe.(b) The method of producing a linear chemical gradient.We poured hot agar with 60 mmol/L NaCl into a customized plate (70 mm×60 mm×5 mm) with one side elevated. After the agar solidified, we laid the plate at and added additional agar with 90 mmol/L NaCl.The whole plate was then placed in a 16 ℃ incubator for 16-23 h before being used for experiments. (c) Chemical gradient test. We added methylene blue to the low salt concentration part of the agar.Next,we captured agar images 16-23 hours after solidification. A converted grayscale image was used to infer the chemical concentration:the smaller the pixel value,the lower the chemical concentration. 10 regions along the gradient were calculated. Each data point represents mean ± SD. (d) Temperature gradient test. The surface temperature was measured by a thermometer 10 min to 40 min after the behavioral system was turned on. On the x-axis, 0 represents the center of the arena. Five positions along the temperature gradient were tested.At each position,we measured temperatures of 3 points perpendicular to the gradient. Each data point represents mean ±SD.
2.2 Cooling system
Water cycling was used to cool down one side of the aluminum plate. The system consists of a water drain, a water pump, two fans, and a liquid-cooled water block, connected by water tubes. Pure water or refrigerant was used to avoid water pipe blockage. We used a thermoelectric cooler (TEC) to transfer heat from the aluminum plate to the water cycling system. Thermal silica was used to tightly couple the TEC with the aluminum plate and the liquid-cooled water block. A PID controller (TLG-5411), which receives feedback from a temperature sensor (PT100, Thermal resistance) mounted on the plate, modulated the TEC to change the actual temperature. The proportional (P), integral (I), and derivative(D) parameters were tuned to reduce fluctuations and achieve an accurate temperature control. In our cooling system,P=0.1,I=300,D=30. The target temperature was 16 ℃,while the actual temperature was 16 ℃±0.5 ℃ (Figure 1(a)).
2.3 Heating system
The heating system used a PI heating membrane ( 10 mm×60 mm , 12 V) to increase the temperature. The membrane was attached to the opposite side of the aluminum plate. Like cooling,we used the same closed-loop feedback system to achieve an accurate temperature control. In the heating system,P=0.2,I=300,D=40.The target temperature was 24 ℃,while the actual temperature was 24 ℃±0.2 ℃ (Figure 1(a)).
2.4 Chemical gradient
We built an agar plate with an approximate linear NaCl concentration gradient, ranging from 60 mmol/L to 90 mmol/L. We briey describe the procedure as follows (Figure 1(b))[17]:
① Prepare a 70 mm×60 mm×5 mm plate and melted agar with 60 mmol/L or 90 mmol/L NaCl. Sorbitol needs to be added to the 60 mmol/L (NaCl) agar to balance the osmotic pressure.
② Elevate one side and fill half of the plate with 60 mmol/L (NaCl) melted agar, which would solidify into a triangular wedge.
③ Lay the plate flat and fill the other half of the plate with 90 mmol/L(NaCl) agar.
④ Place the agar plate in the 16 ℃ incubator overnight and let the NaCl diffuse.
2.5 Testing the behavioral system
To visualize the establishment of chemical gradients in our method, we added a small molecule (methylene blue) with blue color into the melted agar and monitored its spatial color distribution 16-23 hours after the agar was solidified (Figure 1(c)). To test whether an approximate linear temperature gradient was established on the agar plate, we selected and measured temperatures at five positions along the gradient direction (Figure 1(d)).
3 Experimental procedure
3.1 Worm strains and cultivation
Wild-type (N2) and transgenic worms—those expressing GCaMP6::wCherry fusion protein in ASER and AFD neurons—were cultivated at 16 ℃ on agar plates with the nematode growth medium (NGM) and OP50 bacterial food.The composition of NGM was: 2.5 g/L Tryptone, 15 g/L Agar, 1 mmol/L CaCl2, 1 mmol/L MgSO4, 25 mmol/L KPO4(pH 6.0), 5 g/L cholesterol, as well as 50 mmol/L NaCl. All worms used for experiments were well-fed and synchronized adult hermaphrodites (4 days old).
3.2 Behavioral protocol and recording
Before each experiment, we removed bacteria fromC.elegansby washing it three times in NGM, and then placed the animal on an agar pad, 60 mm×40 mm in size. The animal’s initial position was at a temperature 18 ℃ or 80 mmol/L NaCl. We considered three experimental conditions:the presence of a temperature gradient, a salt gradient, or the orthogonal temperature and salt gradients(Figure 2(a)). We carried out all experiments in 20 ℃ room temperature on a Nikon inverted microscope (Ti-U) under a 10×objective with the dark-field illumination. We tracked and recorded each worm’s behavior for 10-15 min[17](we stopped an experiment if a worm ran to the edge of the agar) using the CoLBeRT system[34]. Behavioral sequences were captured by a Basler CMOS camera (aca2000-340kmNIR, Germany). Imaging data were processed and analyzed by MATLAB (MathWorks, Inc Natick, MA, USA).

Figure 2. Worm trajectories under 3 experimental conditions. (a)Schematics of experimental procedures.(b,c)Worm trajectories.Each column represents one experimental condition. The orange and blue arrows represent the temperature and salt gradient direction, separately. We defined a preferred direction in radian as that towards animals’ cultivated condition:[-π,π] in thermotaxis,[-π, 0] in chemotaxis, and [-π, 0] in the combination of thermotaxis and chemotaxis. The pie charts show the proportion of worms in their preferred direction. x2 test was used to calculate whether worms’ preference was statistically significant: ****p<0.0001; ***p<0.001; **p<0.01; *p<0.05. In (b), n=13, 18, and 15; in (c),n=16, 24, and 19.
In all figure legends, thennumbers denote the numbers of different animals for each experiment and represent both independent biological and technical replication.
3.3 Calcium imaging
We expressed the GCaMP6::wCherry fusion protein in AFD and ASER sensory neurons by specific promoters. Green and red emission signals were collected by a 10x objective(Nikon Plan Apo, WD=4 mm; NA=0.45, Japan) at 33 fps with an exposure time of 30 ms;they were separated by a dichroic mirror, relayed by an optical splitter (OptoSplit II, Cairn-Research, UK), and simultaneously projected onto one-half of a sCMOS sensor (Andor Zyla 4.2, UK). The calcium dynamics were analyzed by MATLAB (MathWorks Inc, Natick, MA, USA) and calculated as the ratio of GCaMP6 to wCherryuorescence emission intensities.
4 Results
4.1 Worm trajectories in three experimental conditions
We recorded tracks of two nematode strains, expressing GCaMP6::wCherry fusion protein in ASER and AFD,respectively.An angle in radians from[-π,π] was used to describe worms’ preferred direction (Figure 2(b,c)). During thermotaxis, worms were more likely to migrate down the gradient to their accustomed temperature (16 ℃). Similarly, during chemotaxis, worms preferred to move towards the region with 60 mmol/L NaCl, a concentration that was close to their cultivated condition (Figure 2(b,c)). We calculated the proportion of worms in their preferred region at the end of an experiment, and tested statistically (Figure 2(b,c)) whether experimental conditions their accustomed condition.
The above results were consistent with previous studies[17,19,28,35]onC.eleganstaxis behaviors. When both temperature and salt gradients were present in orthogonal directions (Figure 2(a)), a significant proportion of worms moved towards the preferred direction(Figure 2(b,c))ranging from [-π/2,0], suggesting thatC.eleganswere integrating the two sensory cues during navigation.
4.2 ASER was activated only when worms were moving down the salt concentration gradient
ASER was reported as an essential neuron for salt chemotaxis. Here, we monitored, in a freely behaving animal, ASER’s calcium dynamics under 3 experimental conditions. During chemotaxis, ASER was activated when worms moved down the salt gradient (Figure 3(d-f)). However, ASER’s calcium activity did not significantly increase when worms went up or down the temperature gradient (Figure 3(a-c)); theuorescent signals were bleaching over time (Figure 3(b,c)). In the experimental condition with orthogonal temperature and salt gradients, ASER was only activated when worms were moving down the salt gradient (Figure 3(g-j)). Although ASER was reported to be a cold sensor[36], we did not find that temperature and salt stimuli were integrated by ASER in our behavioral paradigm.

Figure 3. Calcium signals in ASER under 3 experimental conditions. (a, d) Calcium dynamics of ASER when a single worm moved on a temperature gradient or a salt gradient. Black line: a representative ASER motion trajectory; colored plot on the trajectory: ratiometric calcium signal at each point. The color bar on the right represents ΔR/R0. The red square marks the starting point of the trajectory. The orange/blue arrow indicates the direction of the temperature/salt gradient. (b, e) A representative temporal sequence of ASER calcium activity. The red/black bar indicates an increase or decrease of temperature respectively; the blue/black bar indicates a decrease or increase of salt concentration respectively. (c, f) Correlation analysis between a change of calcium signal 〈dR/dt 〉 and the worm head velocity 〈vx〉 or 〈vy〉. 〈·〉 indicates an average over a 4.5 s time window. Note that vx=(dT/dt)/T and vy=(dC/dt) /C, where T and C is the spatial gradient of temperature and salt respectively. A small p-value indicates a significant correlation between ASER calcium activity and temporal uctuation of sensory stimulus. (g-j) Orthogonal temperature and salt gradients were present. (g) Calcium dynamics of ASER when a single animal moved on agar with orthogonal temperature and salt gradients. (h) A representative temporal sequence of ASER calcium activity when sensing both temperature and salt changes. The red/black bar indicates an increase or decrease of temperature respectively; the blue/black bar indicates a decrease or increase of salt concentration respectively. (i-j) Correlation analysis between ASER calcium signal and worm velocity. n=3 in each experimental condition. Each trajectory was from a single animal. The red arrows in (a, d, g) indicate the worm’s moving direction. In (c, f, j), ****p<0.0001, ***p<0.001, **p<0.01, *p<0.05; T test was used in bar figures.
4.3 AFD was only activated when worms were moving up the temperature gradient
AFD is a key sensory neuron in thermotaxis. We found that AFD was activated when worms went up the temperature gradient, but not when worms went down the gradient(Figure 4(a-c, g-i)). Our results are consistent with previous studies, namely AFD encodes an increase of temperature change[19,37,38]. AFD did not respond to a change of salt concentration (Figure 4(d-f,h,j)). Taken together, the integration of temperature and salt is likely to be the implemented downstream of ASER and AFD.
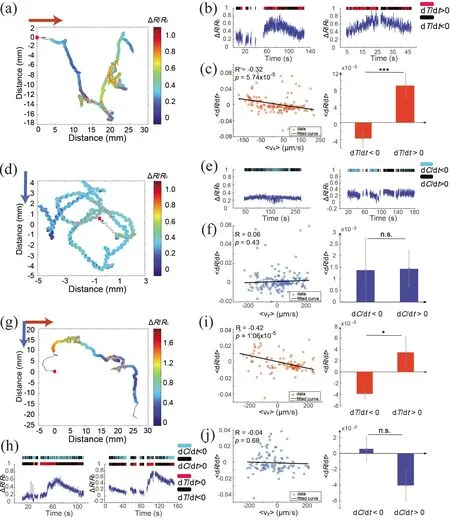
Figure 4. Calcium signals in AFD under 3 experimental conditions. (a, d) Calcium dynamics of AFD when a single worm moved on a temperature gradient or a salt gradient. Black line: a representative AFD motion trajectory; colored plot on the trajectory: ratiometric calcium signal at each point. The color bar on the right represents ΔR/R0. The red square marks the starting point of the trajectory. The orange/blue arrow indicates the direction of the temperature/salt gradient. (b,e)A representative temporal sequence of AFD calcium activity. The red/black bar indicates an increase or decrease of temperature respectively; the blue/black bar indicates a decrease or increase of salt concentration respectively. (c, f) Correlation analysis between a change of calcium signal 〈dR/dt 〉 and the worm head velocity〈vx〉 or 〈vy〉. 〈·〉 indicates an average over a 3 s time window. A small p-value indicates a significant correlation between AFD calcium activity and temporal uctuation of sensory stimulus. (g-j) Orthogonal temperature and salt gradients were present. (g) Calcium dynamics of AFD when a single animal moved on agar with orthogonal temperature and salt gradients. (h) A representative temporal sequence of AFD calcium activity when sensing both temperature and salt changes. The red/black bar indicates an increase or decrease of temperature respectively; the blue/black bar indicates a decrease or increase of salt concentration respectively. (i-j) Correlation analysis between AFD calcium signal and worm velocity. n=3 in each experimental condition. Each trajectory was from a single animal.The red arrows in (a, d, g) indicate the worm’s moving direction. In (c, f, j), ****p<0.0001, ***p<0.001, **p<0.01, *p<0.05; T test was used in bar figures.
5 Discussion
With the development of a navigational and calcium imaging system, we could monitor calcium activities in sparsely labeled neurons whileC.eleganswas engaged in thermotaxis, chemotaxis, or multi-sensory integration. This approach allows the relationship between sensory inputs, neural dynamics, and behaviors to be carefully investigated in the same setting. It is convenient to replace the temperature or the salt gradient with other sensory modalities.
How the sensory neurons inC.elegansencode the temperature[18,19,28]and salt[16,17,31,39-41]have been well characterized; the cellular and molecular mechanisms for signal transduction have also been extensively investigated[19,23,31,42-44]. However, the neuronal circuitry for sensory processing remains poorly understood. The neuronal loss-of-function assays in a single sensory stimulus experiment could be confounding: when a given cell type is killed or optogenetically inhibited, it is sometimes not clear whether the observed behavioral phenotype results from a disruption in the representation of sensory information or in the process of sensory information. If a loss-of-function experiment leads to a modification of behaviors during the multi-sensory integration but not during the uni-sensory experiment, we can conclude that this neuron is more likely to participate in the sensory processing. Studying multi-sensory integration therefore will shed new light on the principles of sensorimotor transformation inC.elegans.
Our calcium imaging experiments are consistent with previous studies on AFD[19,23,28]and ASER[16,17,40]. Although AFD and ASER are synaptically connected[14], we did not find the cross-talk between the two neurons. Our results therefore suggest that the multi-sensory integration is carried out by a downstream circuit. Broadly speaking, there are two possible scenarios.
In one scenario, sensory information is processed through feedforward connections across layers, and we would observe correlations between sensory inputs and interneuron activities across different layers. External inputs affect behaviors through a direct or indirect modulation of premotor interneuron activities.
However, calcium imaging in freely behaving animals revealed that both first- and second-layer interneuron activities were highly correlated with the animal’s spontaneous behaviors[17,45-47], such as forward, reversal, or head movements-instead of sensory inputs. These observations suggest a different scenario in which the process of sensory information is interwoven with animal’s behavioral states, thereby imposing a great challenge for understanding the computational algorithms for sensorimotor transformation. It is possible that the brain’s internal states and sensory processing can be decoupled when analyzing population neural activity[48,49]. We hope that future work on whole-brain functional imaging during multi-sensory integration could provide new insights in this direction.

- 中国科学技术大学学报的其它文章
- Regulatory role of phosphorylation in NLRP3 inflammasome activation
- Carbonic anhydrase inhibitor U-104 inhibits tumor progression through CA9 and CA12 in tongue squamous cell carcinoma
- Impact of COVID-19 pandemic on stock market via sparse principal component analysis
- Pricing strategies of laborer-sharing platform in two transaction modes
- The stable subgroups of Sn acting on M0,n
- Cycle lengths in graphs of chromatic number five and six