Hydromechanical behavior of unsaturated expansive clay under repetitive loading
Ahmed M. Al-Mhbshi, Mosleh A. Al-Shmrni, Mohmmd F. Abbs
a Bugshan Research Chair in Expansive Soils, Department of Civil Engineering, King Saud University, Riyadh,11421, Saudi Arabia
b Civil Engineering Department, Prince Sattam bin Abdulaziz University, Al-Kharj,11942, Saudi Arabia
c Soil Mechanics and Geotechnical Engineering Research Institute, Housing and Building National Research Center (HBRC), Giza,11511, Egypt
Keywords:Expansive clay Repetitive loading Suction Hydromechanical behavior Load-collapse curve
ABSTRACT Compacted layers of expansive soils are used in different engineering projects, such as subgrades,engineered clay barriers,and buffers for radioactive waste disposal.These layers are exposed to a variety of stresses and wetting conditions during field serviceability. Coupling between hydraulic and mechanical repeated loading provides insight understanding to the induced progressive deformation of expansive clay. This study was conducted to investigate the hydromechanical behavior of unsaturated compacted expansive clay under repeated loading-unloading (RLU) conditions. Two series of onedimensional (1D) oedometer tests were conducted under controlled matric suction up to 1500 kPa using the axis translation technique (Fredlund soil-water characteristic curve device, SWC-150). The first test series was carried out at different levels of controlled matric suction for non-repeated loading-unloading (NRLU) cycles. RLU cycles were applied in the second test series at different repetitivestress levels and under different levels of matric suction. The results indicated increasing axial wetting strain εa(s), axial swell pressure σs(s), compression index Cc(s), and swell index Cs(s) with suction reduction.The estimated load-collapse(LC)curves obtained from NRLU series(LCN)and RLU series(LCR)indicated increasing yield stress σy(s) with increasing suction. This is attributed to the developed apparent cohesion between soil particles, which in turn rigidifies the material response. Applying repetitive loading induced a notable reduction of compression index Cc(s) at the same level of suction,whereas swell index Cs(s) seems to be independent of repetitive loading. Finally, repetitive loading exceeding initial yield stresses results in plastic hardening and, hence, enlargement of yield stress locus(i.e. LCR curve).
1. Introduction
Expansive soils undergo appreciable swell and shrinkage because of changes in their water content.These soils are naturally spread worldwide and used as compacted materials in different engineering projects, such as subgrades, backfill, engineered clay barriers, and buffers for radioactive waste disposal. In this regard,there is a variety of stresses and wetting conditions that these soils may experience in the field. Parking and storage facilities, waste disposal, filling and emptying of oil tanks, and fluctuations of groundwater table are examples where soils may experience repeated mechanical loading-unloading cycles. Besides mechanical loading-unloading cycles, expansive soils are subjected to varying wetting conditions, either with a seasonal variation or during their function as engineered barriers which induce variations in soil suction.
In Saudi Arabia, expansive soils cover vast areas, especially in the eastern zones where the main oil-industrial activities exist and the largest oil tanks are located. Furthermore, expansive soil barriers have been experienced and approved by authorities in several infrastructure projects(Dafalla et al., 2013; Dafalla, 2015). Besides,these areas are characterized as semi-arid zones and subjected to suction variations during drying-wetting cycles. Hence, the behavior of such soils under repeated loading-unloading (RLU)cycles for different suction levels are required to mimic the applied field conditions of mechanical or hydraulic variations or either the companying effect of both of them.Assessment of hydromechanical behavior for these materials under such conditions assists in providing accurate modeling-interpretation and avoiding different damages of infrastructures or earth embankments founded on expansive soils. In Saudi Arabia, reported damages of infrastructures varied from uplifting-distortion with minor cracks to major displacement, tilt, misalignment, and disintegration of structural units (Al-Shamrani et al., 2010; Dafalla and Shamrani,2012).
Several studies have investigated the hydromechanical behavior of expansive soils (Cuisinier and Masrouri, 2004; 2005; Romero et al., 2005; Hoffmann et al., 2007; Monroy et al., 2007;Nowamooz and Masrouri, 2009; Tang et al., 2011; Abbas, 2016;Bendahganea et al.,2017;Zhang et al.,2020).The companion effect of mechanical and suction stresses becomes more sophisticated with experienced volume changes (swell/shrinkage) in expansive soils.Additionally,several constitutive models have been proposed to describe the behavior of unsaturated expansive soils. Key parameters of these models need to be determined experimentally,yet the values of these parameters are rarely examined under different loading conditions. Alonso et al. (1987, 1990) described the elasto-plastic behavior of unsaturated soils by introducing the Barcelona basic model (BBM). This model was later extended by Gens and Alonso (1992) and Alonso et al. (1999) to accommodate the behavior of expansive soils considering microstructure and macrostructure levels (as shown in Fig.1) and referred to as Barcelona expansive model (BExM). The main feature of these two models is the capability to describe the elasto-plastic behavior by identifying the locus of yield points that separate elastic behavior from plastic behavior. Gens and Alonso (1992) and subsequently Alonso et al.(1999,2005)proposed the load-collapse(LC)curve to represent the yield locus,for the case of oedometer tests(i.e. onedimensional (1D) loading condition), either in axial stress versus suction(σa-s)or mean stress versus suction(p-s)plane(see Fig.1).Gens and Alonso(1992)and Alonso et al.(1999)postulated that the LC curve uniquely represents both loading- and wetting-induced yield points.
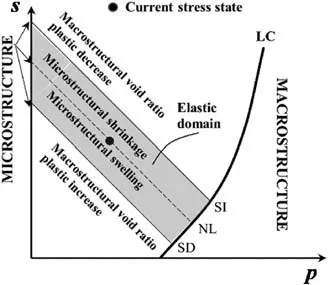
Fig.1. Graphical summary of the double structure elasto-plastic model for expansive soils (SI: suction increase line; NL: Neutral line; and SD: suction decrease line) (after Alonso et al.,1999).
Loading under constant suction(LCS) testing has been used for investigating the effect of suction on stress-induced yield points(i.e.locus of LC curve).Furthermore,the slopes of post-yield loading and unloading, obtained from LCS testing, define the compression and swell indices,Cc(s)and Cs(s),respectively,for plots in the axial stress versus void ratio (σa-e) plane. Most studies concluded that the yield stress, σy(s), increased with increasing applied suction(Alonso et al., 1990; 1999; Maatouk et al., 1995; Cui and Delage,1996; Nowamooz and Masrouri, 2009; Monroy, 2006; Monroy et al., 2008; 2015; Abbas, 2016). The effect of suction level on compression and swell indices, Cc(s) and Cs(s), respectively, has been examined by numerous researchers.Monroy(2006),Monroy et al. (2008, 2015), and Abbas (2016) reported that increasing suction led to a reduction in the swell index indicating that swelling during unloading was inhibited by suction. Regarding the effect of applied suction on the slope of post-yield loading curve, most reported studies (Alonso et al., 1990; 1999; 2005; Cui and Delage,1996; Chen and Ng, 2005; Slatter et al., 2006; Nowamooz and Masrouri, 2009; Derfouf et al., 2020) showed that increasing suction hardened the material. By contrast, Wheeler and Sivakumar(1995), Monroy (2005), and Monroy et al. (2008) found that the slope of the post-yield loading curve increased with increasing suction. Marcial and Delage (2003), Wang et al. (2013), and Abbas(2016) showed that changes in Cc(s) were non-monotonic with respect to suction.
Several studies focused on the hydromechanical behavior of non-expansive soils, taking into account the effect of RLU cycles(Tang et al.,2011;Butterfield,2011;Suddeepong et al.,2014;Torres-Suarez et al., 2014), where hysteric loops during unloadingreloading were indicated. Tang et al. (2011) investigated such behavior of crushed argillite and showed behavior dependency on grain size distribution;finer samples exhibited stiffer compression behavior and higher swell potential. Suddeepong et al. (2014) carried out a series of RLU oedometer tests on remolded and undisturbed clay samples(inorganic with high plasticity,CH).The study indicated a linear increase in cumulative plastic deformation with increasing repeated cycles up to a certain value,and then no further increases.
To the authors’knowledge,studies on volume change behavior of expansive soils under RLU cycles are limited (Deng et al., 2011;Wang et al., 2012; Cui et al., 2013; Habibbeygi and Nikraz, 2018).Wang et al. (2012) studied the behavior of treated expansive soil but under dynamic cyclic loading.Furthermore,there have been no such studies to date about the impact of RLU cycles on the hydromechanical behavior of expansive clay,including the determination of LC curve or compression and swell indices, Cc(s) and Cs(s),respectively. Habibbeygi and Nikraz (2018) evaluated the compressibility characteristics of soft clay with high initial water content, i.e. at saturation and under the effect of RLU cycles. The results showed a slight increase in compression and swell indices after the first cycle.Deng et al.(2011)observed that the swell index was similar before and after applying repetitive loading. Cui et al.(2013) presented the results of a series of oedometer tests for stiff clays with high plasticity under RLU cycles and found hysteric loops during unloading-reloading cycles.The study also provided a new mechanism to explain the response to RLU cycles based on the values of applied stresses and swell pressure. When the applied stress exceeds swell pressure (σs), the mechanical effect during reloading induces notable volume changes because of the collapse of large pores, whereas during unloading, the physico-chemical effect is dominant and induces considerable swell.
It is evident that studies conducted on expansive soils under RLU cycles are rare and, more importantly, coupling these mechanical RLU cycles with suction variation in unsaturated expansive soils is still unavailable in literature up to date. In this study,two series of 1D oedometer under suction-control tests were conducted using the axis translation technique. The first series was carried out at different levels of suction for non-repeated loading-unloading (NRLU) cycles. RLU cycles were applied in the second test series at different repeated-stress levels and under different levels of suction. Axial wetting strain εa(s), axial swell pressure σs(s), yield stress σy(s), compression index Cc(s), and swell index Cs(s) obtained from both NRLU and RLU series were studied and compared.
2. Material and methods
2.1. Material used
The material used in this study is an expansive clay sourced from Al-Qatif,which is located on the Arabian Gulf coast in Eastern Saudi Arabia,in a semi-arid climate zone.This city houses the main oil industries and largest oil tanks in Saudi Arabia, with the accompanying need for expansive soils as hydraulic barriers(Dafalla, 2015). Expansive clay layers, either natural or artificially encountered,in this region may be subject to RLU in an unsaturated state.
Al-Qatif clay is characterized as high-plasticity clay because of considerable amounts of montmorillonite and palygorskite, which are typical swelling minerals (i.e. Abduljauwad and Al-Sulaimani,1993; Azam et al., 1998; Azam, 2003; Al-Mahbashi, 2014; Al-Mahbashi et al., 2015; Al-Mahbashi and Elkady, 2017). The percentages of montmorillonite and palygorskite combined, for this clay, range from 8% to 56% (Rafi, 1988). Table 1 summarizes the geotechnical characterization results for this expansive clay. According to the expansion index shown in Table 1,this expansive clay is classified as of high expansion potential as per ASTM D4829-03(2003).
2.2. Procedure and testing program
2.2.1. Sample preparation
A standard Proctor compaction test has been executed on a selected highly expansive soil and results are presented in Table 1.For the present study, all specimens were prepared by mixing dry soil with the optimum moisture content obtained from the compaction curve, and stored in a humid room for 24 h to ensure moisture homogeneity. The specimens were statically compacted,in stainless-steel rings with 50 mm in diameter and 20 mm in height, to their maximum dry unit weight (Table 1) using a handoperated jack.
2.2.2. Devices and techniques
To conduct the oedometer tests under suction-control conditions, the axis translation technique was applied using Fredlund’s soil-water characteristics curve (SWC-150) device developed by GCTS testing system(Tempe,Arizona,USA).The device can control matric suction up to 1500 kPa with the capability of applying different normal stresses on tested specimens.This device includes three main components: pressure cell, control panel, and frame load. The pressure cell has a high air-entry value (HAEV) ceramic disk as shown in Fig.2.This disk separates the air phase inside the cell and the water phase in the compartment beneath the disk.The water beneath the HAEV ceramic disk is connected to two-scaled burettes fixed on the control panel. The control panel includes knobs with pressure dial gages to control suction application. Theframe load is provided with a pneumatic loader to apply normal stresses through a shaft rod connected to the top of the soil specimen inside the pressure cell.The deformation of tested specimens is continually monitored and recorded using a linear variable differential transducer (LVDT) connected to a data logger.
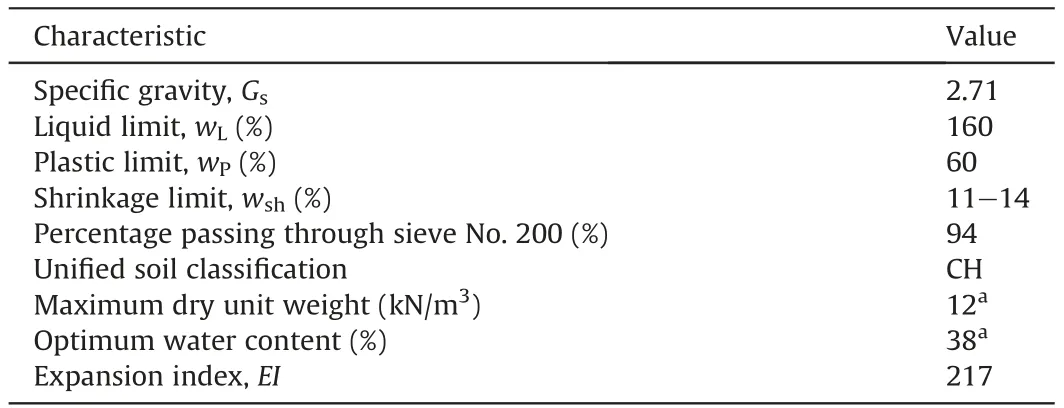
Table 1 Characteristics of tested expansive clay.
It should be mentioned that oedometer tests under initial suction (2000 kPa) and zero suction, i.e. saturated condition, were carried out using a conventional oedometer device. For initial suction, loading was sequentially performed in small increments(load increment ratio, LIR ≈0.1), to maintain the as-compacted suction constant as proposed by Cui and Delage (1996), and the specimen inside the cell was covered by plastic wrap to prevent moisture variation during testing. Equilibrium state was judged as when there was no monotonic change in axial deformation. The testing at zero suction was conducted by inundating the specimen with distilled water to saturate under free swell condition and then loaded gradually on the oedometer cell.
2.2.3. Suction equalization process
Suction equalization process is to ensure a specimen equalized under a predetermined level of suction. The initial suction of a compacted specimen has been measured using the contact filter paper technique, following the standard procedures described in ASTM D5298-16 (2016), as approximately 2000 kPa. The process steps are as follows:install a compacted soil specimen on top of the saturated HAEV ceramic disk and impose suction by applying air pressure inside the pressure cell. Water starts to desorb/absorb through the ceramic disk from/to the soil specimen.The desorbed/absorbed water is traced using the scaled burettes.During testing,air bubbles may escape through the ceramic disk or inside expelled water and accumulate on the compartment beneath the ceramic disk. Accumulated air bubbles beneath the HAEV ceramic disk are periodically removed by flushing the system through the connected burettes on the control panel.The actual desorbed/absorbed water is obtained by applying a correction to water values traced. The suction equalization of the tested specimen is achieved when there are no changes in the traced water-level (on scaled burettes) per day and a continuous deformation rate profile is obtained.The time to equilibrium for this stage varied from 3 d to 18 d,depending on the target suction value. Once equilibrium is achieved, the tested specimen is loaded gradually in increments following two approaches: NRLU and RLU.
2.2.4. NRLU testing
In this series of tests, specimens were equalized (i.e. water content) under a predetermined level of suction as mentioned in the preceding section. Following equalization, tested specimens were gradually loaded in increments up to the maximum axial stress of 1000 kPa (conventional loading) with LIR equal to unity.Afterward,tested specimens were unloaded with a decrement ratio of 3.Fig.3a shows the NRLU tests,and Fig.3b shows the increments of loading-unloading for this series of tests.The equilibrium state for each loading/unloading increment is considered to be achieved by the same criterion as for the suction equalization stage (i.e. no changes in deformation and water content for a day). Table 2 summarizes the NRLU tests using identical specimens equalized at different levels of suction. Each test in the NRLU series is distinguished by an ID that represents the target suction applied in the suction equalization stage.For instance,NRLU_S600 refers to a specimen tested under a target suction of 600 kPa and subjected to NRLU.
2.2.5. RLU testing
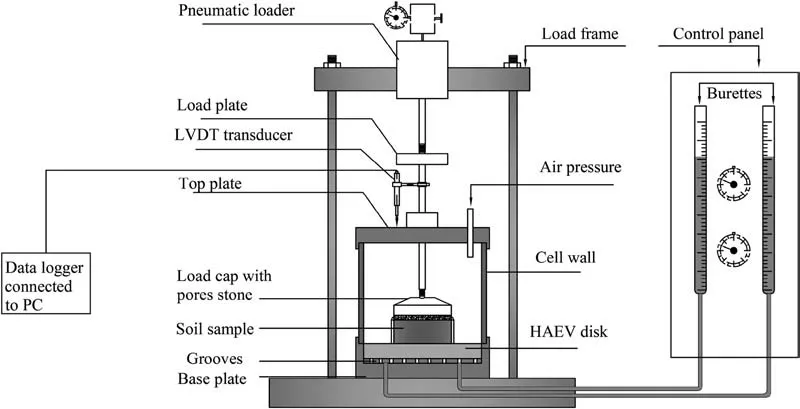
Fig. 2. Schematic diagram of Fredlund SWC-150 device.
The second series consists of tests with RLU.This series is similar in procedure to the preceding one(NRLU);however,four RLU cycles were applied to the specimen after suction equalization.Each RLU cycle starts from a rebound stress of 12.5 kPa, and then the load gradually increases up to a certain value of repeated stress and then drops down to the rebound stress,as shown in Fig.4a.Afterward,a conventional loading-unloading stage starts up to the maximum axial stress of 1000 kPa as described in the NRLU series.Several RLU tests have been executed under different levels of suction and different repeated-stress levels. Table 2 summarizes the executed RLU tests, distinguished by a specimen ID that indicates target suction applied and repeated stress. For instance, RLU200_S1400 refers to a specimen tested under a target suction of 1400 kPa and subjected to repeated stress of 200 kPa(see Fig. 4b).
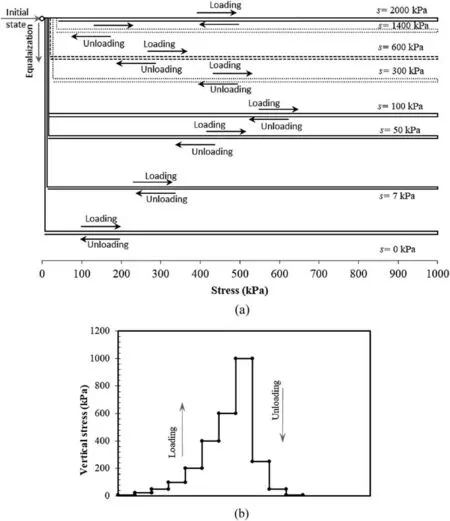
Fig. 3. (a) Schematic diagram of NRLU series and (b) typical loading-unloading diagram.
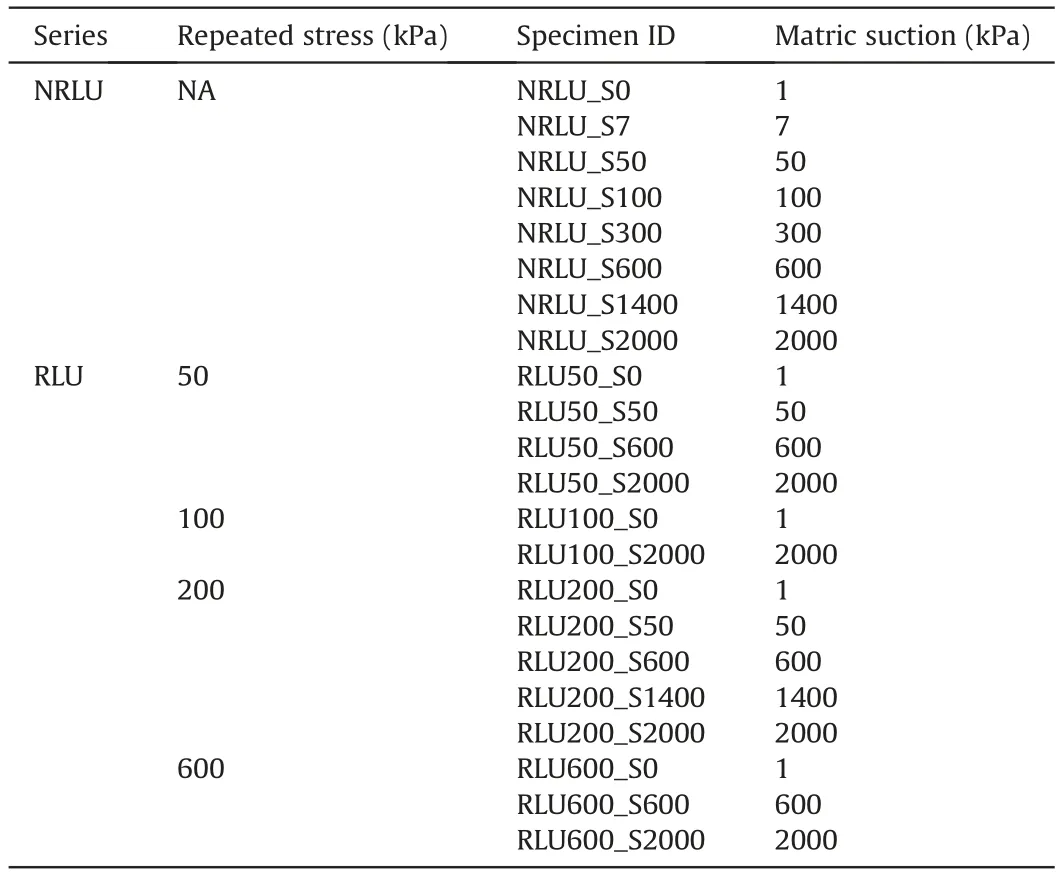
Table 2 Summary of testing program conditions.
The periods of RLU testing varied depending on the level of applied suction and repeated load. Time ranges of 24-28 d, 35-51 d, and 44-57 d have been recorded for cyclic stresses of C50,C200,and C600,respectively.For one cycle of repeated loading,the elapsed time varies from 4 d to 10 d.
3. Results and discussion
3.1. Volume change behavior under NRLU conditions
Fig. 5a shows a typical curve for NRLU testing under specific suction values (s). The parameters obtained from such a curve under applied suction (suction-equalized void ratio ese, rebound equalized void ratio ere,axial swell pressure σs(s),yield stress σy(s),compression index Cc(s),and swell index Cs(s))are indicated.Fig.5b and c presents the actual curves for NRLU under specific suction values (s). In what follows, variations of such parameters under applied suction are demonstrated and interpreted.
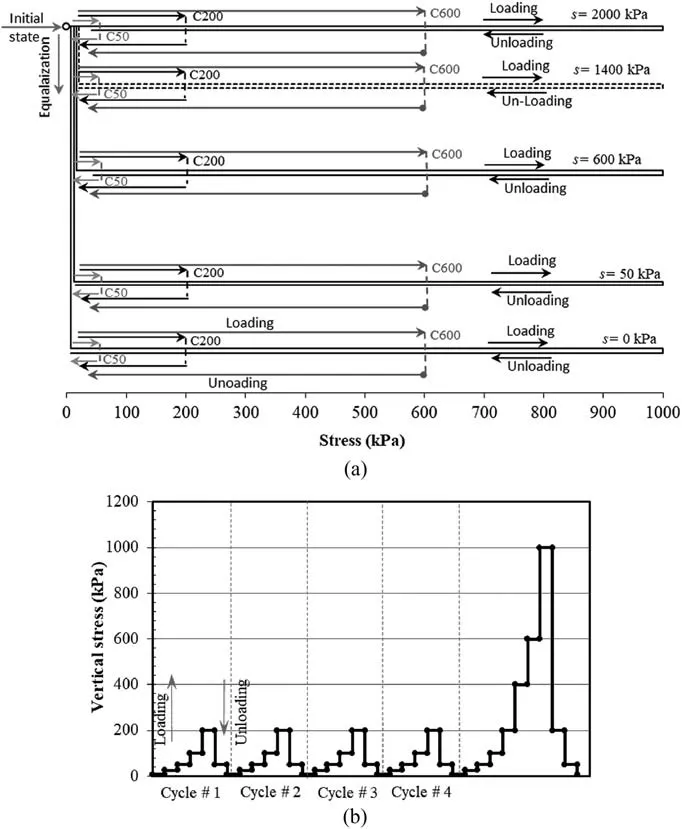
Fig. 4. (a) Schematic diagram of RLU cycles and (b) typical loading-unloading diagram.
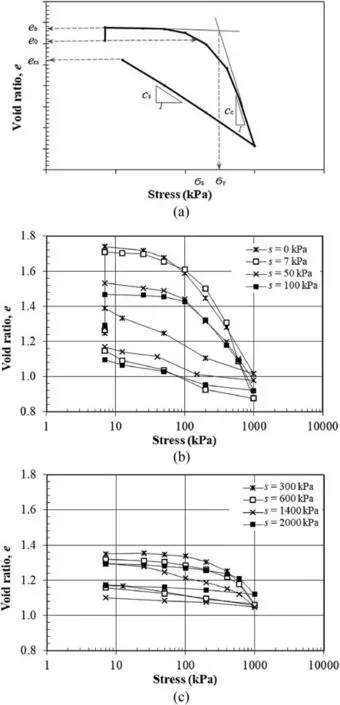
Fig. 5. NRLU compression curves: (a) Typical curve with main characteristics, (b)Curves under suction from 0 kPa to 100 kPa,and(c)Curves under suction from 300 kPa to 2000 kPa.
Fig.6a depicts the variation of axial strain at the end of suction equalization,i.e.εa(s),with applied suction under an axial stress of 7 kPa. Results show that εa(s) increases with the decrement of applied suction. Fig. 6b shows the variation of suction equalized void ratio (ese) and rebound equalized void ratio (ere), defined in Fig. 5a, with applied suction. The gap between the two curves increases with the reduction of suction.This can be attributed to the plastic swell initiated at low suction values, which increases with suction reduction. This observation agrees with the BExM hypothesis that a specimen exhibits plastic swell with suction reduction when crossing the suction decrease (SD)line (Fig.1).
Fig. 7a shows the variation of axial swell pressure under a particular suction level, σs(s). It is defined as the axial stress required to return the specimen to its original state (void ratio or height) before swell because of suction reduction (see Fig. 5a).Fig. 7a indicates that σs(s) increases with suction reduction. The ascending trend is attributed to the increased water absorption at lower suctions and subsequent increase of stress required to expel the absorbed water to return the tested specimen to its initial state prior to suction equalization.
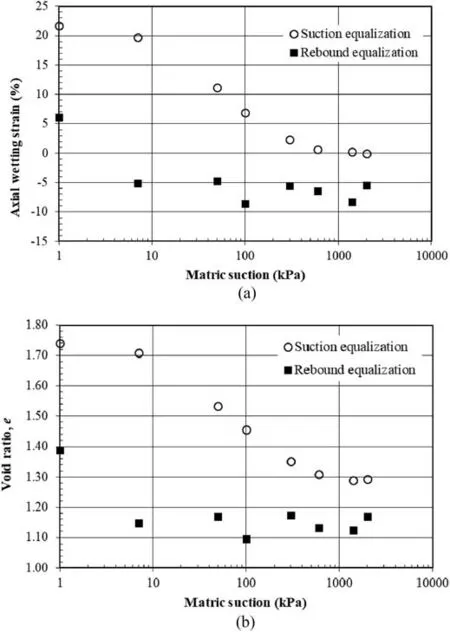
Fig. 6. Variations of (a) axial swell strain and (b) void ratio with applied suction.
Fig. 7b depicts the variations in compression and swell indices,Cc(s) and Cs(s), with applied suction. As the applied suction level reduces, both Cc(s) and Cs(s) increase. The observed trend in variation of Cc(s) with suction reduction agreed with most reported studies (Romero et al., 2003; Chen and Ng, 2005; Slatter et al.,2006; Nowamooz and Masrouri, 2009; Derfouf et al., 2020). The elastic behavior of examined specimens,i.e.Cs(s),showed the same trend as the plastic behavior,agreeing with the results of Hoffmann et al. (2007), Monroy (2006), Monroy et al. (2008 and 2015), and Abbas(2016),but was contrary to the findings of Alonso et al.(1990,1999, 2005), Cuisinier and Masrouri (2004, 2005), Chen and Ng(2005), Nowamooz and Masrouri (2009), and recently Zhang et al. (2020), which showed that elastic behavior is independent of applied suction level.
The LC curve developed within the BExM is established as the locus of yield stress at considered suction levels, σy(s), based on Casagrande’s method, as illustrated in Fig. 5a. Fig. 8 depicts the variation of σy(s)with suction(i.e.LC curve for NRLU testing,LCN).It is observed that increasing suction resulted in increasing yield stress, σy(s), as documented by numerous researchers (e.g. Alonso et al.,1999; Nowamooz and Masrouri, 2009; Monroy et al., 2015;Abbas, 2016).
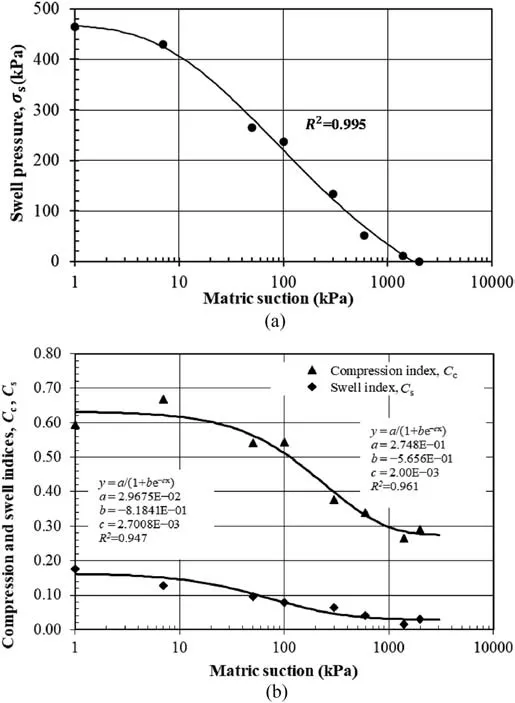
Fig.7. Variation of(a)axial swell pressure and(b)compression and swell indices with applied suction (NRLU testing).
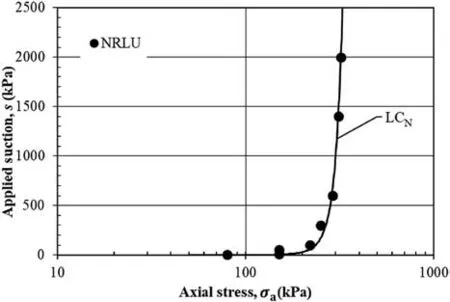
Fig. 8. LC curve for NRLU testing (LCN).
The observed elasto-plastic behaviors of tested specimens under different suction levels can be attributed to apparent cohesion between soil particles that developed with the increase of suction,which in turn rigidifies the material.As suction increases,the void ratio decreases (i.e. density increases) and consequently decreases both Cc(s)and Cs(s)and increases the yield stress,σy(s)(see Fig.6b).The same interpretation was introduced by several researchers(i.e.Sheng et al., 2008; Nowamooz and Masrouri, 2009). Moreover,suction reduction from its compacted state down to 400 kPa has little impact on the void ratio and, hence, little impact on other parameters, i.e. σy(s), Cc(s), and Cs(s). As a practical application, it can be concluded that moderate reduction of suction (simulated humidity variations)from its compacted state produces no notable alteration of soil state and is safe for most design applications.
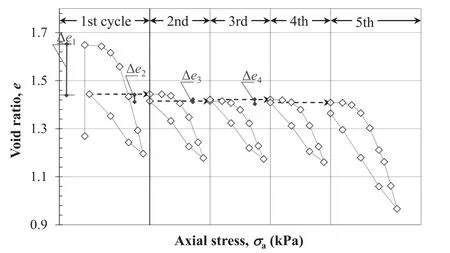
Fig. 9. Typical graph for RLU testing.
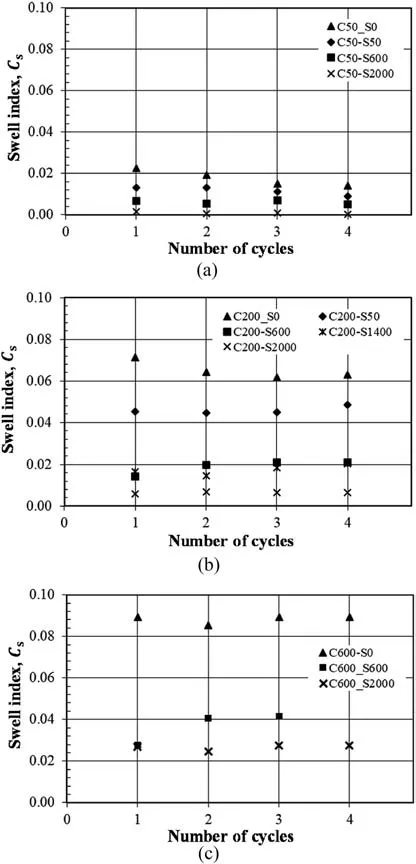
Fig.10. Evolution of Cs(s)with RLU cycles for repeated stress of(a)50 kPa,(b)200 kPa,and (c) 600 kPa.
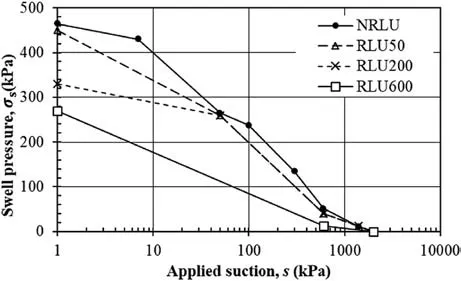
Fig.11. Variation of axial swell pressure with applied suction for NRLU and RLU series.
3.2. Volume change behavior under RLU conditions
The behavior of examined specimens under RLU conditions is introduced in this section. Fig. 9 depicts a typical graph showing RLU testing under specific suction values (s). As aforementioned,tested specimens under RLU series are subjected to four RLU cycles,and then followed by the final conventional loading-unloading cycle to evaluate the impact of RLU on axial swell pressure, yield stress, compression index, and swell index. The evolution of swell index with repeated cycles is also introduced.
Fig.10 introduces the evolution of Cs(s)with repeated cycles.The swell index is almost constant across the number of cycles applied,except for specimens equalized under zero suction,i.e.Cs(0),where it shows a descending trend.Additionally,applied suction increases with the reduction of the swell index,as observed in NRLU testing.Furthermore, specimens subjected to the same suction under different applied repeated stresses showed that as the applied repeated stress increases, the values of Cs(s) increase. This can be attributed to the increase of specimen’s dry density (as void ratio decreases) with the increased repeated stress value.
Fig. 11 shows the variation of axial swell pressure, σs(s), with suction for specimens subjected to repeated stress of different values, i.e. 50 kPa, 200 kPa, and 600 kPa. It can be deduced from Fig.11 that as repeated stress increases,σs(s)decreases for the same applied suction,following the same trend of variation with suction reduction,i.e.σs(s)increases with suction reduction.Moreover,for small repeated stress values, little reduction of σs(s) is detected compared with that of high repeated stress.The suction equalized void ratio (ese) is reduced slightly under the application of small repeated stress,in contrast to high repeated stress,which results in a large reduction of ese. The higher the value of ese, the higher the stress required to return a tested specimen to its initial state prior to suction equalization.
Fig.12 exhibits the variation of compression index,as a function of applied suction for considered levels of repeated stress. For comparison, the data are presented with the best-fit curves of the NRLU series.Applying RLU cycles resulted in a reduced compression index for the same applied suction, and that reduction is proportional to the value of applied repeated stress.Conversely,RLU cycles have almost no effect on the swell index,which is in agreement with the findings of Deng et al.(2011).The current investigation disagrees with that of Habibbeygi and Nikraz (2018), who noted increases in both compression and swell indices at saturation,i.e.Cc(0)and Cs(0),after the application of RLU.This can be attributed to the differences in sample preparation,and the resultant microstructure,as well as to the applied suction levels during testing.
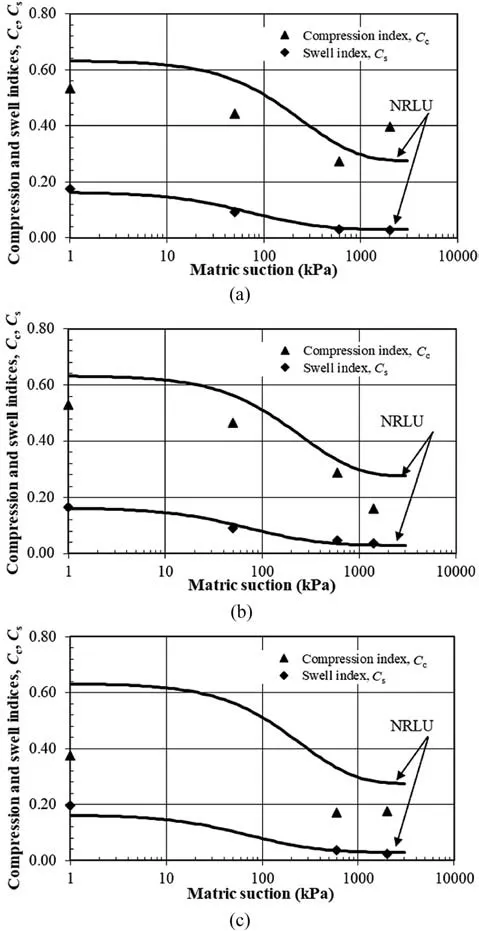
Fig. 12. Impact of RLU cycles on Cc(s) and Cs(s) for repeated stress of (a) 50 kPa, (b)200 kPa, and (c) 600 kPa.
The impact of RLU cycles on the locus of yield stress at a specified suction level, i.e. LC curve, is examined for different repeated stresses,as depicted in Fig.13.It can be seen that the loci of σy(s)for RLU50 and RLU200 series lie on the LC curve obtained from NRLU testing (LCN), when applied repeated stress is within the initial elastic zone, defined in the BExM model, as obtained from NRLU testing. However, as repeated stress exceeds this elastic zone, an enlargement of the LC curve occurred, i.e. LCRLU600. This enlargement is due to plastic hardening when a specimen is subjected to stress (either load or suction) greater than the past stress history that it has been subjected to, as per BExM (i.e. Alonso et al.,1999,2011; Vassallo et al., 2007;Zhang and Lytton, 2009; Monroy et al.,2015).
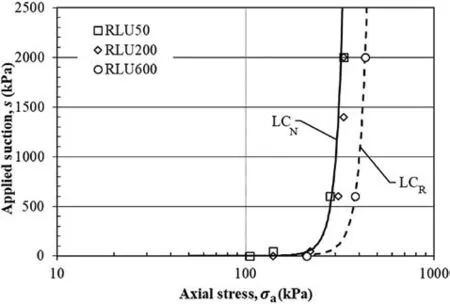
Fig.13. Yield stress and estimated LC curves under repetitive loading.
To interpret the loading induced elasto-plastic behavior of tested specimens, void ratio hysteresis (Δe), defined as the difference between suction equalized void ratio (ese) and rebound void ratio (ere), is introduced in Fig. 9. Fig.14 depicts its evolution with RLU cycles. Void ratio hysteresis represents a specimen’s plastic hardening as a response to RLU cycles.For small repeated stresses,i.e.RLU50 and RLU200,the RLU cycles do not affect the specimen’s elasto-plastic behavior regardless of the level of matric suction.Void ratio hysteresis is almost zero for all RLU50 cycles and small for most RLU200 cycles, especially at high suction values where repeated stresses are located away from the LC curve.However,as repeated stress increases, void ratio hysteresis increases, and the series with a lower level of matric suction exhibited higher hysteresis because of their proximity to the yielding curve.Specifically,for higher repeated stress, i.e. RLU600, Δe decreases with progressive cycles,with most of the reduction after the first cycle.This reduction is more pronounced when the applied suction is small.This means that tested specimens behave elastically under small repeated stress;however,they exhibit plastic hardening for higher repeated stresses. This behavior can be interpreted in view of the BExM concept;subjecting a specimen to repeated stress lower than the yield stress, i.e. inside the elastic zone, results in an almost elastic response. However, once the repeated stress increases over σy(s), the specimen shows plastic hardening at initial cycles followed by elastic behavior because of the enlargement of the yield stress locus, i.e. LCRcurve, as shown in Fig.13.
4. Conclusions
This study aimed to understand the hydromechanical behavior of unsaturated compacted expansive clay,particularly the LC curve and compression and swell indices, Cc(s) and Cs(s), under the coupling effect of repeated mechanical loading and suction variations. Two series of suction-controlled 1D oedometer tests were conducted. The first series was carried out at different levels of matric suction for NRLU cycles, whereas RLU cycles, for different repeated-stress levels and under different levels of matric suction,were executed in the second series. The main findings can be summarized as follows:
(1) With the reduction of suction level, increases of swell pressure, axial swell strain, compression index, and swell index were observed. Furthermore, plastic swell was observed for specimens subjected to small values of suction,which agrees with the BExM hypothesis.
(2) The obtained LC curves indicated increased yield stress with increased suction due to apparent cohesion between soil particles, which in turn rigidified the material.
(3) RLU cycles at zero suction induced a notable reduction in the swell index, Cs(0), with the main reduction observed after the first cycle.Conversely,the swell index at different suction levels, Cs(s), showed marginal variations with cycles of RLU.
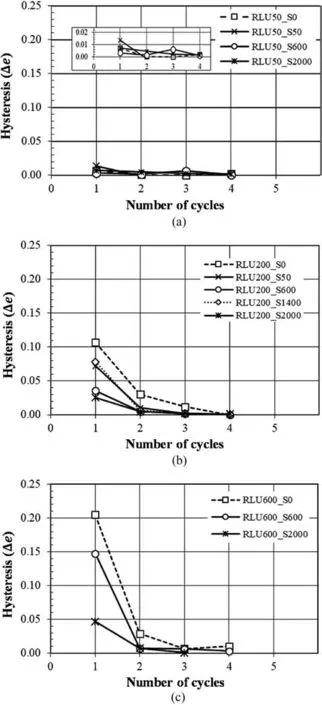
Fig. 14. Evolution of void ratio hysteresis with RLU cycles for repeated stress of (a)50 kPa, (b) 200 kPa, and (c) 600 kPa.
(4) For the same level of applied suction, reductions of swell pressure and compression index were observed for specimens subjected to RLU cycles;this reduction is proportional to further increases of repetitive stress (i.e. 200 kPa and 600 kPa).
(5) The locus of yield stress at applied suction levels,σy(s),i.e.LC curve, revealed that σy(s) for specimens subjected to RLU within the elastic zone is almost located on the LC curve obtained under NRLU conditions (LCN). However, as applied RLU increased beyond the elastic zone,an enlargement in the LC curve occurred (LCR). This reveals that tested specimens behaved elastically within the elastic zone and exhibited plastic hardening for the case of higher repeated stress.
Data availability
Data used to support the findings of this study are available from the corresponding author upon request.
Declaration of competing interest
The authors declare that they have no known competing financial interests or personal relationships that could have appeared to influence the work reported in this paper.
Acknowledgments
The authors are grateful to the Deanship of Scientific Research,King Saud University, for funding this research through the Vice Deanship of Scientific Research Chairs Program.Technical supports provided by Researcher Supports and Services Unit(RSSU) at King Saud University are highly appreciated.
List of symbols
P Mean stress
σaAxial stress
S Suction
σy(s) Yield stress at specified suction level
Cc(s) Compression index at specified suction level
Cs(s) Swell index at specified suction level
E Void ratio
εa(s) Axial wetting strain at specified suction level
σsSwell pressure
σs(s) Swell pressure at specified suction level
eseSuction-equalization void ratio
ereRebound-equalization void ratio
 Journal of Rock Mechanics and Geotechnical Engineering2021年5期
- Journal of Rock Mechanics and Geotechnical Engineering的其它文章
- Surface characteristics analysis of fractures induced by supercritical CO2 and water through three-dimensional scanning and scanning electron micrography
- Prediction of fracture and dilatancy in granite using acoustic emission signal cloud
- Hysteresis in the ultrasonic parameters of saturated sandstone during freezing and thawing and correlations with unfrozen water content
- Coupled Eulerian-Lagrangian simulation of a modified direct shear apparatus for the measurement of residual shear strengths
- A novel true triaxial test system for microwave-induced fracturing of hard rocks
- Laboratory large-scale pullout investigation of a new reinforcement of composite geosynthetic strip
