Coupled Eulerian-Lagrangian simulation of a modified direct shear apparatus for the measurement of residual shear strengths
Luke Ttnell, Ashley P. Dyson, Ali Tolooiyn,*
a GHD Group Pty. Ltd., Traralgon, VIC, 3844, Australia
b School of Engineering, University of Tasmania, Hobart, TAS, 7001, Australia
Keywords:Coupled Eulerian-Lagrangian (CEL)simulation Residual shear strength Multi-stage Direct shear (DS)Organic content Cohesive soil
ABSTRACT The simulation of large-strain geotechnical laboratory tests with conventional Lagrangian finite element method (FEM) techniques is often problematic due to excessive mesh distortion. The multiple reversal direct shear (MRDS) test can be used to measure the residual shear strength of soils in a laboratory setting. However, modelling and simulation generally require advanced numerical methods to accommodate the large shear strains concentrated in the shear plane.In reality,when the standard direct shear(DS)apparatus is used,the MRDS method is prone to two major sources of measurement error:load cap tilting and specimen loss. These sources of error make it difficult or even impossible to correctly determine the residual shear strength. This paper presents a modified DS apparatus and multi-reversal multi-stage test method, simulated using the coupled Eulerian-Lagrangian (CEL) method in a finite element environment.The method was successful in evaluating equipment and preventing both load cap tilting and specimen loss, while modelling large-deformation behaviour that is not readily simulated with the conventional FEM or arbitrary Lagrangian-Eulerian (ALE) analysis. Thereafter, a modified DS apparatus was created for the purpose of analysing mixtures of organic materials found in an Australian clay. The results obtained from the modified DS CEL model in combination with laboratory tests show a great improvement in the measured residual shear strength profiles compared to those from the standard apparatus. The modified DS setup ensures that accurate material residual shear strengths are calculated, a factor that is vital to ensure appropriate soil behaviour is simulated for numerical analyses of large-scale geotechnical projects.
1. Introduction
Effective shear strength parameters (effective cohesion c′and friction angle φ′) are vital in the assessment of slope stability,bearing capacity and soil-pile interactions. Peak shear strength parameters are commonly measured in a soil laboratory using the direct shear(DS)or triaxial apparatus(Jewell and Wroth,1987;Gan et al.,1988). However, the DS apparatus can also be used to determine residual shear strength parameters. Although a number of practical limitations exist in accurately deriving residual shear strength parameters from DS tests, two significant limiting factors in determining the cohesion and friction angle are load cap tilting and specimen loss. Despite the potential for miscalculation due to these two features, they are seldom accommodated in both the laboratory and numerical simulation. In addition to these factors,modelling and simulation of DS tests are often prone to numerical convergence issues due to significant deformations and displacements, requiring advanced numerical techniques to accommodate large-strain behaviour(S¸erbulea et al.,2013).Grid-based numerical methods such as the finite difference method present a range of challenges when modelling systems involving large deformation arge deformation (Cividini and Gioda, 1992; Doherty and Fahey,2011; Royo and Melentijevic, 2014). Alternatively, meshless methods such as the discrete element method(Lobo-Guerrero and Vallejo, 2005; Wang and Gutierrez, 2010), smoothed particle hydrodynamics (Lobo-Guerrero and Vallejo, 2005; Lemiale et al.,2016), and the material point method (Sołowski et al., 2014) have been developed to overcome common limitations of finite elements for simulation of large-strain geotechnical tests. Although these methods are beneficial when simulating large deformation behaviour, they also exhibit their own set of drawbacks, most commonly related to computational cost, with associated limitations in model size/resolution (Augarde and Heaney, 2009). As an alternative, the coupled Eulerian-Lagrangian (CEL) method is a numerical approach providing finite element method (FEM) functionality,without the large computation cost of meshless methods.CEL has been used to simulate a wide variety of large-scale geotechnical applications, including pile installation (Hamann et al., 2015), simulation of strip footings (Qiu et al., 2011), and cone penetration tests (Fallah et al., 2016). For this reason, in this research, the CEL method is used for simulation of DS testing to provide FEM functionality while also accommodating for largestrain behaviour.
The multiple reversal DS(MRDS)test is most frequently used to measure the drained residual strength of materials such as(but not limited to) clays and clayshales, however, the method has several limitations. The test is performed by reversing the shear direction until a minimum shear strength is measured. Each reversal of the shear box results in a horizontal displacement that is usually less than 25 mm.As such,the specimen is not subjected to continuous shear deformation in one direction as compared with ring shear tests. Therefore, the complete orientation of the material particles parallel to the direction of shear may not be obtained. Residual shear strength parameters measured using residual DS tests often exhibit higher values than those determined by ring shear tests.The disparity between the two methods is reduced as the fraction of clay particles observed within the specimen increases(Akis et al.,2020a).Skempton(1985)noted that a shear displacement between 1 in and 2 in(2.54-5.08 cm)is required to measure residual shear strength parameters of remoulded clay samples without a presheared plane of failure. Akis et al. (2020b) observed that high shearing rates can lead to an overestimation of residual shear strength parameters when conducting MRDS tests, while Tika and Hutchinson (1999) observed that faster rates can also lead to an underestimation in shear strength.The residual state is not reached until large-strain deformation has taken place.This can be achieved by multiple shearing cycles of a sample in the DS apparatus(Mesri and Huvaj-Sarihan,2012;Cabalar et al.,2013),known as the MRDS.In the MRDS test, the shear plane is formed during the initial run,with further reversals and re-runs continuing to alter the shear surface, reducing the shear strength to residual. The MRDS technique,when implemented with the standard DS apparatus,is prone to producing unreliable results and measurement error due to issues which arise when conducting multiple reversals.
This research addresses the simulation of DS residual behaviour,as well as the limitations of load-cap tilting and specimen loss with the following procedure: (1) an initial large-strain FEM model is simulated using the CEL technique to determine the efficacy of a modified MDRS apparatus and a procedure limiting sample loss and load cap tilting;(2)a modified MDRS apparatus is constructed and used to test cohesive and non-cohesive materials, minimising the impacts of load cap tilting and specimen loss; and (3) a set of organic clay and coal materials are examined with the modified MRDS, with analysis of the modified MRDS derived friction angles with respect to the organic content yielding a relationship between the two quantities.The results of these tests provide further insight into the behaviour of soils prevalent within the large open-pit mines of the Latrobe Valley, Australia, as these shear strength parameters are required inputs for numerical slope stability models.With FEM becoming the prevalent method for assessing slope stability in the Latrobe Valley (Dyson and Tolooiyan, 2019a, b;Ghadrdan et al., 2020a, b), the accuracy of shear strength parameters with large-strain advanced FEMs such as CEL, confirmed by laboratory tests,is of paramount importance in maintaining stable large open-pit mine slopes.
2. Direct shear test challenges
Skempton (1985) noted that the residual shear strength of clay is one of the most important characteristics in assessing the stability of reactivated landslides. Hvorslev (1939) noted that measurement of residual strengths often requires large displacements,seriously impacting the suitability of various types of shearing apparatus.Residual strength parameters of soils under large-strain deformation can be difficult to measure using standard DS equipment. This is largely due to the shortcomings of the standard apparatus and testing method. Standard testing can result in accumulated specimen loss due to the exposed shear plane(Toyota et al., 2009), occurring via the gap which exists between the two halves of the shear box.As the test progresses,this gap can become larger,resulting in excessive specimen loss(Stark and Vettel,1992;Suzuki et al.,2007).The specimen loss after many reversals in a DS box can also lead to load cap tilting, producing a non-uniform distribution of normal stresses on the shear plane (Nakao and Fityus,2008).
As a DS test runs, the gap between the two halves of the shear box tends to increase (Suzuki et al., 2007). The type of soil, the normal stress applied over the sample, and the internal surface roughness of the DS box are all factors contributing to the extent of specimen loss. Specimen loss results in constantly changing shear surface and specimen height. As the shear surface changes, the measured shear stress differs from the true residual shear stress.As such, an intermediate estimate between the peak and residual shear strengths becomes an increasingly large source of error as the shear strain increases. A diagram of the standard DS device is presented in Fig.1.
The multiple reversal multiple stage DS(MRMSDS)test involves the examination of a single specimen at three or more normal stress conditions, with multiple reversals at each normal stress stage. This minimises the amount of sample required, as only a single specimen is necessary (Suzuki et al., 2007), eliminating the variability caused by differences between multiple specimens,as in the standard DS test(Hormdee et al.,2012).Although only a single specimen is necessary for performing MRMSDS tests, several specimens can also be considered,as with the standard DS device,thereby minimising the chance of obtaining erroneous results due to the selection of samples containing significant defects.
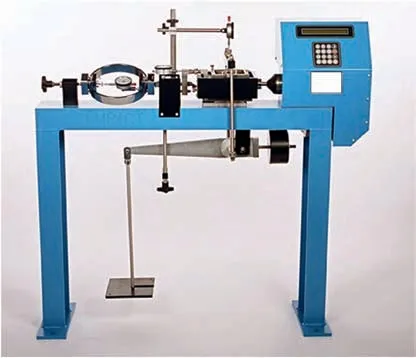
Fig.1. Standard direct shear apparatus (Impact Test, 2021).
ASTM D3080/D3080M-11 (2011) details the standard testing procedure for the measurement of peak shear strength parameters in a DS box apparatus for soils under consolidated drained (CD)conditions. The standard DS apparatus provides a means of relatively fast measurement of the peak shear strength of soils under CD conditions, as drainage paths are short due to the thin specimen height.The speed of the test is often calculated based on ASTM D3080/D3080M-11(2011),and performed slowly enough to allow for the dissipation of excess pore water pressures. This usually allows for a faster shear rate than achievable with standard CD triaxial testing, due to the longer drainage path in the triaxial specimen.At the beginning of the test,the two halves of the shear box are separated by a gap of approximately 1-2 mm, to ensure that no errors are caused by friction between the two halves of the box,should they be in contact.As the test progresses,it is common for this gap to gradually increase.This is possible as the top half of the shear box is not vertically or transversally fixed. While the specimen is sheared,soil particles can be forced through this small gap.As soil is pushed out behind the specimen,it escapes the inside of the shear box and falls into the water bath beneath. This specimen loss makes it impossible to accurately calculate the volume or height of the specimen to determine the vertical strain. It can also create an irregular shear stress vs. strain profile, resulting in an unreliable residual shear strength estimate. At fast enough shear rates, it is possible that the material loss may to some extent influence the pore pressure behaviour.
As an example, an undisturbed, highly overconsolidated silty clay is presented, classified as CH using the unified soil classification system (USCS), with a liquid limit of 54%, plasticity index of 29%, and saturated moisture content of 31%. Test specimens were consolidated at the appropriate pressure for 24 h, sheared in the forward direction,reversed at the same rate,then sheared again to obtain the next section of the curve.Only forward shear runs have been recorded in Fig.2,as recommended by Head(1994).It can be seen that with the standard test procedure, the test conducted at the normal stress of 100 kPa gives a good (flat) residual shear strength estimate of approximately 46 kPa.However,both the tests conducted at the normal stresses of 200 kPa and 400 kPa show behaviour resulting from the large amount of specimen loss presented after one to two runs.Often,graphs of standard MRDS tests show a sudden change in shear strength,as is observed in this case.The normal stresses of 200 kPa and 400 kPa(Fig.2)do not plateau to a converged state after several reversals of the DS test. This is particularly noticeable for the second reversal at thenormal stress of 200 kPa, where a drop in shear stress is observed due to specimen loss. For this reason, the two of the curves (200 kPa and 400 kPa)are not suitable for use in determining the residual shear strength of this soil specimen.
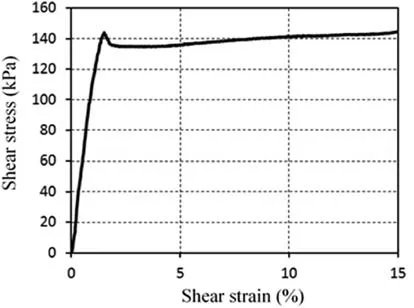
Fig. 3. Increasing shear stress caused by load cap tilting.
Load cap tilting frequently occurs during standard DS testing.It can exacerbate specimen loss by increasing the normal stress on one side of the specimen,squeezing it through the gaps of the shear box. As the load cap tilts, the once entirely vertical normal stress begins to gain a horizontal component.The horizontal component of the normal stress adds to the measured shear stress and results in the stress vs.strain graph displaying an increase in strength over time in each run, as shown in Fig. 3.
The normal load is usually applied to the load cap via a thin distributed load;generally via a rounded bolt,or ball-bearing at the end of a bolt, which rests in a concave depression in the load cap.The load cap has the same base area as the test specimen. The authors have used a 60 mm by 60 mm square load cap with a rounded bolt type thin distributed load.The load gives the load cap near full range of motion around the joint. Load cap tilting and its effects tend to become more pronounced at higher normal stresses.
The benefit of MRMSDS testing is that only one specimen is required. The specimen is consolidated at the first normal stress and then sheared for three or more runs. Once the first stage is complete and the shear box returns to the original position, the specimen is consolidated again at the next normal stress for 24 h,then sheared for a further three or more runs. The process is repeated until at least three residual shear strength values are obtained. An MRMSDS is unable to determine the peak shear strength parameters,as only one of the normal stress conditions is conducted with a fresh specimen. Using just one specimen to obtain residual shear strength parameters is beneficial,as no errors are caused by specimen variation as with a standard MRDS test,for which three separate specimens are required. In cases where a number of samples are used, it is recommended that the friction angle can be defined as a function of relative density.
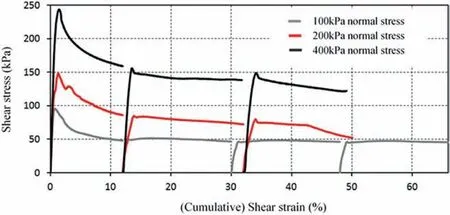
Fig. 2. Standard MRDS test result displaying decrease in shear strength due to sample loss.
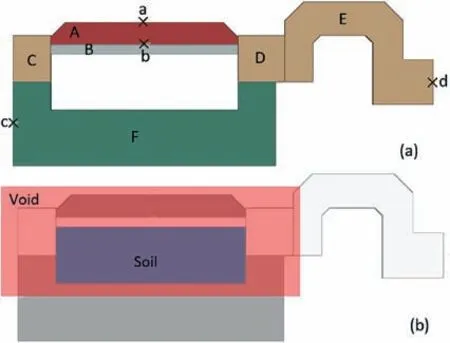
Fig. 4. Geometry of the CEL model: (a) Lagrangian parts and (b) Eulerian domain.
The modifications in this research enable a standard DS apparatus to be altered with ease to obtain high-quality results from MRDS and/or MRMSDS testing,by removing or minimising factors which are the common causes of errors.Ideally,two modifications are required to prevent excessive tilting of the load cap and hold the two halves of the shear box together to stop specimen loss.
3. Coupled Eulerian-Lagrangian direct shear test model
Numerical analysis was performed prior to the physical DS modification,allowing for examination of sample loss and load cap tilting beahviour,preceding the physical development process.The specimen undergoes shear strains as high as 15% (20% in some equipment) in a standard DS test and 45%-60% in an MRDS test.This magnitude of strain, concentrated around the shear plane, is too high to be considered by traditional Lagrangian FEM analysis,causing serious mesh distortion during the calculation process.Hence, an advanced FEM technique is required to model highly focused large strain. In general, two Eulerian methods of analysis can be coupled with traditional Lagrangian techniques to extend the capability of the FEM models for very large strain analysis.Arbitrary Lagrangian-Eulerian (ALE) adaptive meshing is a technique that combines features of Lagrangian and Eulerian analyses within the same mesh. ALE adaptive meshing is typically used to control element distortion in Lagrangian analysis, and can often maintain a high-quality mesh under severe deformation(Susila and Hryciw, 2003; Tolooiyan and Gavin, 2011; Dassault-Systèmes,2012). Preliminary FEM analysis of DS and MRDS tests by the authors revealed that the ALE technique is not capable of solving the mesh distortion for simulation of the extensive strains in a shear box. The ALE technique does not alter the elements and connectivity of the mesh,limiting the capability of the method to maintain a high-quality mesh due to the extreme deformation. The CEL technique is a robust method for large-strain deformation analysis(Benson, 1992; Peery and Carroll, 2000; Benson and Okazawa,2004). CEL allows Eulerian and Lagrangian bodies within the same model to interact and typically offers better interpretation of contact conditions than pure Eulerian analysis. In general, CEL is used to model the interactions between a solid body and a yielding or fluid material, such as a drill penetrating a soil (Dassault-Systèmes, 2012). In CEL analysis, the solver splits each computation time increment into two steps: a traditional Lagrangian step and an Eulerian step.The traditional Lagrangian formulation is used for the initial step. The deformed mesh calculated from the first step is then mapped back to the original mesh for the Eulerian(second) step. While elements in traditional Lagrangian or ALE analysis are designated a single material, elements in CEL can be intermittently or continuously assigned a single or multiple materials, and/or void space.
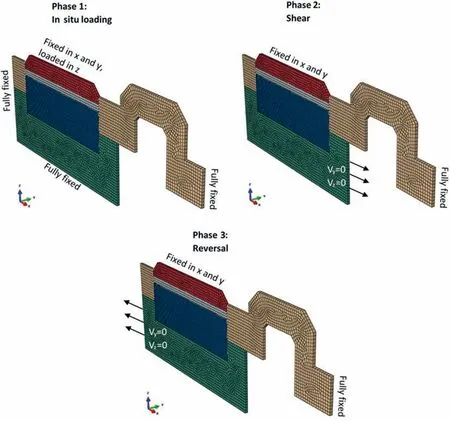
Fig. 5. 3D geometry of the CEL model for each simulation stage: in situ, shear and reversal.
CEL analysis was considered using the Abaqus/Explicit 6.12 FEM software package for analysis of a 60 mm by 60 mm sample in a DS box. The plane-strain geometry of the Lagrangian model parts is shown in Fig. 4a. The Lagrangian setup consists of six parts (A-F).Parts C, D and E are analytically connected together and cannot move or rotate independently.Although the FEM analysis simulates a fully drained condition, pore water pressure dissipation is not a concern for the material considered in this particular analysis(due to the loading rate, in accordance with ASTM D3080/D3080M-11,2011). A porous stone (Part B) is modelled to simulate the realistic tilting of the load cap (Part A). Since the stiffness of steel is much higher than the soil,all Lagrangian parts are constrained with rigid bodies. Rigid body constraints allow the motion of the Lagrangian part to be constrained to the motion of a specified reference point (Points a-d). Hence, the relative positions of the elements with respect to the associated reference point in the Lagrangian parts remain constant throughout the analysis. This results in a decreased cost of analysis as the stress-strain matrices are not calculated for those elements within the Lagrangian parts.The Eulerian domain of the CEL model is shown in Fig.4b.Initially,all elements located inside the box are assigned as soil, with all other elements occupied by void space.The soil material can move within the Eulerian domain to fill elements initially occupied by void space if they can escape through gaps between the Lagrangian parts, as is the case with the MRDS test, in reality. Large shear strains(a maximum of 20%in some cases due to tilting and sample loss)were used as the stopping criterion.The walls of the shear box passing over each other constituted strains of 20%.
Although a two-dimensional (2D) plane-strain model is sufficient for simulation of the DS test, the Abaqus CEL environment does not allow for 2D analysis, hence a three-dimensional (3D)model is employed.A 3D model with only a single element width in the transverse direction is used to create a quasi-2D model, as shown in Fig. 5, with boundary conditions shown for each of the three model phases: in situ, shear and reversal. A sensitivity analysis was performed by further refining the mesh,to ensure that an appropriate mesh dependency did not affect the accuracy of simulation.Similarly,a sensitivity analysis was performed to ensure no strain-localisation mesh dependency effects. The 3D Eulerian linear 8-node reduced integration Abaqus EC3D8R elements areused within the Eulerian domain, while Lagrangian parts were meshed using linear 8-node reduced integration Abaqus C3D8R elements. Reduced integration of lower order elements has the potential to simplify computations but also lead to inaccuracies.Eulerian and Lagrangian 8-node reduced integration elements were selected to minimise computational requirements when simulating multi-reversal tests for models with and without a shear box cap and load-cap tilting. To ensure the accuracy of reduced integration elements, an initial full integration model was used,simulating DS behaviour prior to multiple reversals of the direct shear apparatus. As the results of these simulations were comparable to reduced order simulations, the remainder of the simulations were modelled as such.

Table 1 Soil model parameters.
It is noted that zero-velocity boundary conditions (for the Eulerian domain) and zero displacement boundary conditions (for Lagrangian parts) are applied to both sides of the model (i.e.orthogonal to the model orientation).As the model simulates a DS test performed under drained conditions, pore water pressures were deemed an unnecessary addition to the model.
The linear elastic perfectly plastic model with Mohr-Coulomb(MC) failure criterion and the Drucker-Prager (DP) nonassociative plastic model are two of the most frequently implemented models for describing the behaviour of soils, as they often fit well with experimental data from laboratory tests including DS,triaxial compression and triaxial extension(Wojciechowski,2018).Of course,when combined with the linear elastic model,neither of these two failure criteria could simulate the nonlinear softening/hardening behaviour of the material before it reaches to critical state(perfectly plastic).However,for this particular case,while the simulation of nonlinear behaviour prior to the plastic state is not one of the objectives, both the linear elastic perfectly plastic MC model and the DP non-associative plastic model are equally applicable in describing the stress/strain behaviour in detail to simulate the effects of load cap tilting and specimen loss on standard and modified DS tests. Because the MC failure criterion was not available in the employed version of Abaqus/Explicit, the soil constitutive behaviour was modelled using the DP non-associative plastic model with model parameters shown in Table 1.Parameters provided in Table 1 reflect typical values for an arbitrary cohesionless sandy material. Using Eq. (1), the DP friction angle(β = 38.06°) can be determined from the MC friction angle(φ = 28°).
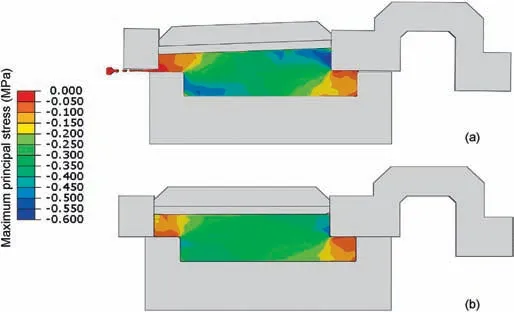
Fig. 6. Plate tilting and sample loss at the end of one-cycle DS test using (a) standard DS box and (b) modified DS box.
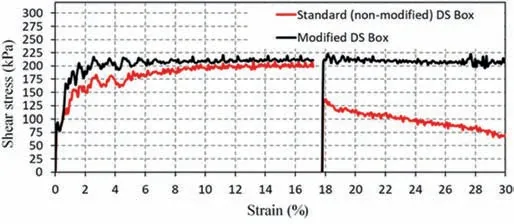
Fig. 7. Shear stress profile measured from simulation of two-cycle MRDS test.

Initially, an MRDS test using the standard DS box without modification is simulated. Part F is vertically fixed while the prescribed horizontal displacement is applied to point c, as shown in Fig.4b.During the test,Part CDE is free to rotate around point d and is allowed to separate from Part F up to a maximum of 2 mm. The horizontal resistance force, which represents the applied shear stress in the DS test,is measured at point d.Part A can rotate around point a, while a vertical load corresponding to a 400 kPa vertical normal stress on the soil specimen is applied.The linear DP failure criterion could be written as

where τ is the shear stress; and p is the stress invariant equal to 2σn/3,in which σnis the normal stress.Based on Eq.(2),a residual shear strength of τ = 212 kPa is expected at point d, where p =266 kPa,β = 38°, and d = 0 kPa.
All interfaces between parts are considered as frictionless,except for the soil-box and soil-porous stone interfaces which are modelled using the Abaqus penalty friction formulation.In the case of the soil-steel frictional behaviour,the stiffness method was used to implement a tangential contact interaction definition with a penalty friction formulation and a friction coefficient of 0.2. This parameter was chosen as the interface friction angle between smooth steel and soils which has been extensively researched and reported in the range of 20%-30%of the soil internal friction angle(Tolooiyan and Gavin, 2011). The interface friction angle was calibrated and tested, with the interface friction angle deemed to be 20% of the soil friction angle.
For the second analysis, the modifications to the shear box are applied.Part CDE is fixed against rotation around Point d such that no gap can develop between Part CDE and Part F. Part A is fixed against rotation about Point a, and no plate tilting may occur.
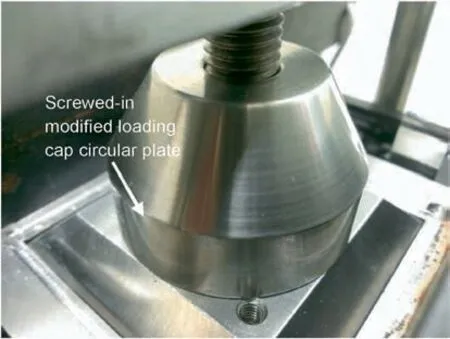
Fig. 8. Modified loading cap on top of standard DS loading cap.
The simulation consists of three stages: an in situ phase where the shear box is loaded, an initial shearing phase and a shear reversal stage. Each stage is conducted using Abaqus automatic dynamic explicit analysis to perform a large number of small-time increments efficiently.For the incrementation,a global stable time period estimator determines the stability limit as each step proceeds, adaptively determining the maximum frequency of the model. The improved dt method option is used to estimate the stable time increment for 3D continuum elements.
Fig.6 shows the maximum principal stress of the soil specimen and DS box at the end of the first cycle,confirming that the applied modifications prevent tilting of the load cap, inhibiting specimen loss.Fig.7 shows the measured shear stress profile for two cycles of an MRDS test,confirming that the standard setup of a DS box is not capable of measuring the residual shear strength of soil, while the results for the modified shear box are close to the expected values.With an unsteady trend, the standard DS test produces a lower observed shear strength than the modified apparatus(Fig.7)due to the sample loss and load cap tilting as shown in Fig. 6. The reduction in the shear strength measured by the standard DS test is mainly due to the fact that the shear stress cannot be fully mobilised during the test. To achieve a steady result, the shear stress must be mobilised at the shear plane generated in-between the two halves of the specimen. However, due to the sample loss and load cap tilting, the shear plane alters continuously while avoiding the shear stress mobilisation.Furthermore,the sample loss within the standard apparatus leads to the formation of voids within the specimen, with the corresponding volume change resulting in a reduction in the shear strength. With the modified DS apparatus,sample loss and load cap tilting do not occur,hence the appropriate shear strength can be accurately measured when the shear stress is fully mobilised at a steady shear plane.
The model presented in this research is semi-3D (a single element in thickness) as the Abaqus CEL environment requires models to be 3D in nature.For this reason,the model is not suitable for comparing levels of specimen loss with those observed in a laboratory setting. Instead, the objective of the simulation is to identify the processes leading to specimen loss and load cap tilting,while assessing the design of a modified shear box setup in mitigating both specimen loss and load cap tilting.With the numerical model indicating that the modified DS test prevents load cap tilting and specimen loss, allowing for accurate calculation of residual shear strengths,a physical modified DS apparatus was constructed,as detailed in the following sections.
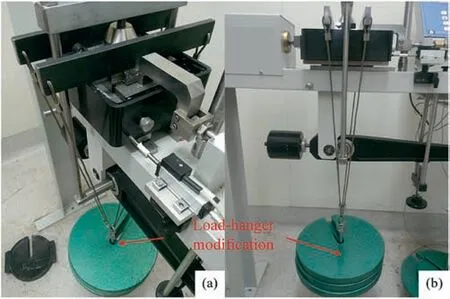
Fig. 9. Load hanger modification: (a) 3D view and (b) Side view.
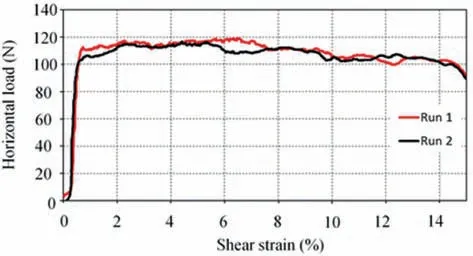
Fig.10. Correction curve for load hanger modification (FR = 115 N).
4. Development of a modified direct shear apparatus
4.1. Prevention of load cap tilting
To prevent excessive tilting of the load cap from occurring, the surface area in which the bolt is in contact with the load cap was increased by the addition of a circular plate,which can be screwed onto the existing bolt,as shown in Fig.8.This modified loading cap(MLC)allows lateral movement of the load cap,yet greatly inhibits rotational movement (tilting).
4.2. Prevention of specimen loss
As shown by the model results, holding the two halves of the shear box together inhibits specimen loss from occurring.Although in the performed numerical analysis, the interface between the two box halves is assumed to be frictionless, in reality,the downwards force applied to the top half of the shear box to keep the two halves held together introduces a significant frictional force between the two halves. To enable the soil shear strength to be measured whilst the two halves of the shear box are in contact,the friction which is created solely between these two halves must be known.
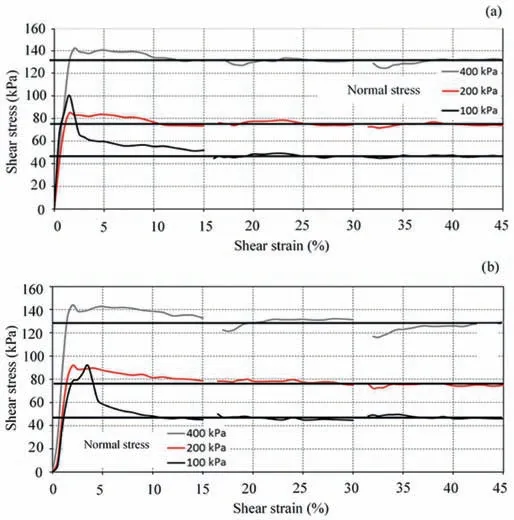
Fig.11. Modified MRMSDS results for an undisturbed,over-consolidated,cohesive silty clay: (a) Test 1 and (b) Test 2.
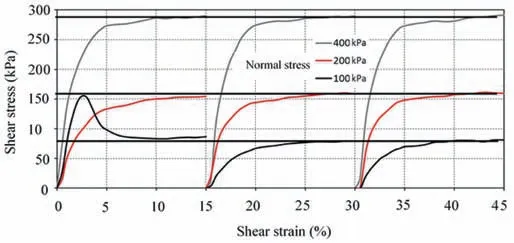
Fig.12. Modified MRMSDS results for a non-cohesive quartz sand.
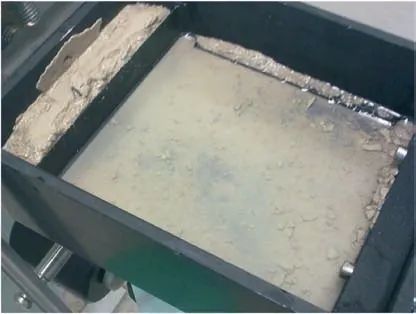
Fig.13. Specimen loss from the standard DS test in the water bath.
The test setup for the modified test is the same as the standard shear test (ASTM D3080/D3080M-11, 2011), with an additional alteration consisting of a vertical load applied directly on the upper half of the shear box, preventing a gap occurring between the two halvesof the shearbox.The magnitudeof the loadshouldbesufficient to prevent a gap occurring but not too large to add excessive frictional resistance during the test. The load is applied by two metal bars resting on top of either side of the standard 60 mm square shear box.Each bar has a single length of wire attached to each end,to form a loop.A small platform for weights to rest is attached and hangs at the low point of the loops formed by the two wires.The small platform is free to move along the wire loops.This setup is referred to as the‘load hanger’ and is shown in Fig. 9a and b. The load hanger applies a downward force on the top half of the shear box and,depending on the amount of weight applied,prohibits vertical movement.
4.3. Correction factor and adjustment due to modifications
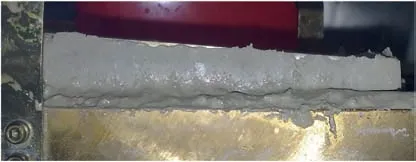
Fig.14. Specimen showing uneven vertical deformation after two reversals in standard DS apparatus at normal stress of 400 kPa.
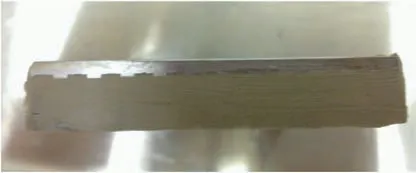
Fig. 15. Top half of sheared specimen with MLC showing no uneven vertical deformation after large-strain deformation.
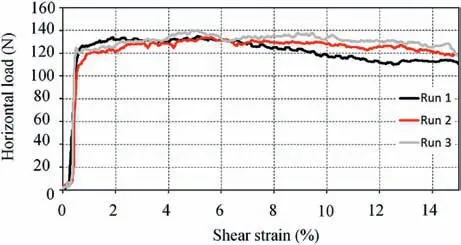
Fig.16. Correction curve for load hanger modification (FR = 130 N).
To adjust the results obtained by this method, the frictional force between the two shear box halves(FR)must be known for the specific weight connected to the load hanger.FRwas determined by performing the modified DS test under standard test conditions with no specimen. The same shear rate as the full MRMSDS test(0.01 mm/min) was adopted and the test was conducted with a water bath of distilled water.From this test,a correction curve was obtained. No lubrication was used in both the FRadjustment and the soil shear test runs. For this specific setup, with a total load hanger mass (load hanger setup + weights placed on hanger) of 35 kg, a frictional force of approximately 115 N was observed between the two shear box halves in water(see Fig.10).This frictional force (adjustment value) was then deducted from the shear force measured during the modified MRMSDS test. No adjustment is required for the standard DS test as an additional vertical load is applied only to the MRMSDS setup. The standard setup given in Fig. 1 shows a residual shear strength of 46 kPa after several reversals of the apparatus. The adjustment factor is deducted from the original MRMSDS results to achieve the curves given in Fig.10.A particularly steep initial gradient is observed in Fig.10,attributed to the heavily overconsolidated nature of the test material. The accuracy of the adjustment factor was confirmed by comparing the shear strength parameters obtained to the standard DS test method with 100 kPa normal stress on the same soil sample.Both methods exhibited residual shear strengths of approximately 46 kPa(Figs.1 and 10).
5. Results and discussion
The improvement in the quality of results obtained using the modified DS apparatus in MRMSDS testing, compared to those obtained via MRDS testing with standard equipment,was shown to be significant.Two MRMSDS tests conducted on undisturbed,overconsolidated,silty-clay specimens(the same material as used in the standard MRDS test) are shown in Fig. 11a and b. The vertical deformation of the samples was monitored and considered to have achieved their target states after 24 h without creep, as per ASTM D3080/D3080M-11 (2011). The pre-consolidation pressure was 1000 kPa. Near flat residual curves are observed for all three runs for each loading stage. The similarity in behaviour between each run is shown in Fig.12 and signifies the accurate performance of the modified DS setup on a non-cohesive soil (quartz sand).
The increasing shear strength displayed in Fig.11b at 400 kPa is likely due to the shape of the failure plane.At the conclusion of the test, the specimen was inspected, and the shear surface was observed as not entirely flat, with a slightly curved surface in the centre. The structure of the specimen is the likely cause of this formation.
No visible specimen loss occurred during the use of the modified DS apparatus, while specimen loss occurred during all standard MRDS testing,as shown in Fig.13.Inspection of the specimens after testing in the modified DS apparatus indicated the successful implementation of the MLC.Specimens tested with the standard DS apparatus generally produced an uneven vertical deformation at either end due to load cap tilting, after only two reversals (see Fig. 14). Contrastingly, this was not the case with the modified apparatus, with specimens displaying no notable uneven vertical deformation, even after 14 reversals, as shown in Fig.15.
It is recommended that no lubricant,such as petroleum jelly,is used between the two halves of the shear box in either the calibration or testing phase.Most lubricants will be worn away as the test progresses and multiple reverses are conducted,resulting in a constantly changing friction coefficient, making correction of results a complex task. The two halves of the shear box should be thoroughly cleaned and dried before each successive test,such that no residue remains on the surface. It is also recommended that a new adjustment curve using the freshly cleaned shear box is obtained for each test conducted, due to the possibility of residue or film left on the surface after cleaning. The authors conducted several adjustment curve tests for the same clean shear box prior to each MRMSDS test,observing a slight variation in frictional forcewith one group of three adjustments indicating a frictional force of approximately 130 N(Fig.16),while the other group of adjustments produced an approximate frictional force of 115 N (Fig.10).
6. Direct shear testing of organic materials
The aforementioned laboratory and numerical analyses describe the DS regime prior to the consideration of the effect of organic content on material shear strength.Coal fibres within organic coal/clay mixtures may exacerbate sample loss, minimising the likelihood of calculating a precise residual shear strength. For this reason,it is important to remedy the effects of load cap tilting and sample loss prior to the analysis of organic material.As it has been shown that the MRMSDS mitigates the influence of sample loss and load cap tilting,the results of MRMSDS tests on organic material are considered herein.
The Latrobe Valley Depression is an onshore extension of the Gippsland Sedimentary Basin in Victoria,Australia(Gloe,1974).Thedepression covers an area of 800 km2(Holdgate et al.,1995)and in some locations is 700 m thick,up to two-thirds of which consists of Victorian Brown Coal (VBC) (Tolooiyan et al., 2014). VBC is a lightweight organic coal with a water content up to 65% of its volume(Tolooiyan et al., 2020). The permeability of VBC was observed by Tolooiyan et al.(2020)to be 7.6×10⁻³m/d,while Rosengren(1961)noted permeabilities as low as 6.64 × 10⁻⁴m/d, declaring that fractures have a significant influence on permeability. Joints are commonly visible in Latrobe Valley mine batters due to the brittle nature of VBC, which exhibits micro-fracture and cracking in addition to large-scale jointing (Tolooiyan et al., 2019). Latrobe Valley sediments consist of brown coal seams,clays,silts,sands and gravels,with non-coal interseam layers underlying all the main coal seams(Newcomb et al.,2000).The relatively low shear strength of interseam clays found at the base of the coal seams is one of the major factors governing the stability of Victoria’s brown coal openpit mine slopes(Newcomb et al.,2000).As the transition between coal and interseam layers can exhibit sharp or gradual changes(Holdgate et al., 1995), the variation of brown coal content in interseam clay is of particular interest for ensuring the stability of Latrobe Valley brown coal mines. It is assumed that an increase in the coal content of interseam clay leads to an increase in the residual shear strength,as the shear strength of brown coal is greater than interseam clay.

Table 2 Atterberg limits of the organic materials.
Interseam clay was excavated from the Loy Yang mine (one of three large open-pit coal mines in the region) with several tests performed to evaluate the clay composition. X-ray diffraction test was conducted to determine the main constituents of the clay.The clay was concluded to consist primarily of kaolinite (42.7%) and quartz (51.1%). Furthermore, Atterberg limits were conducted as part of this research, with results provided in Table 2, while hydrometer testing as per AS standard AS 1289.3.6.3-03 (2003)determined a clay fraction of 45%, resulting in a classification of CI (inorganic clay of low/medium plasticity)silty clay according to AS 1726-1993(1993).Of particular note is the increases in both the liquid and plastic limits with respect to organic content,while the plasticity index was determined to be negatively correlated with organic content.
The organic content of the interseam clay and brown coal samples was determined by specimen combustion, in accordancewith test method C in ASTM D2974-00 (2000) (Table 2), with the organic content of three clay-coal mixed samples also presented.The liquid and plastic limits for interseam clay (Specimen ID: O1)and clay-coal mixes(Specimen ID:O2,O3 and O4)were measured according to AS 1289.3.1.1-09 (2009) and AS 1289.3.2.1-09 (2009),respectively.Accurate measurement of the liquid and plastic limits of brown coal using the Atterberg limit tests was not possible due to the sensitivity to changes in water content when approaching the liquid limit, with the material behaviour resembling a non-Newtonian fluid. For the plastic limit, the brown coal displays behaviour similar to fine sand, exhibiting non-plastic behaviour.

Table 3 Residual strength parameters from organic mix tests.
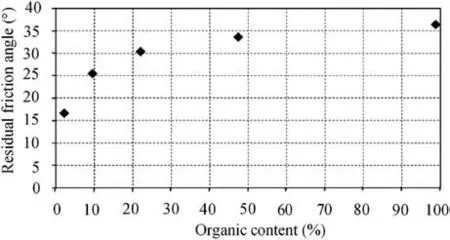
Fig.17. Residual friction angle vs. organic content of the specimen.
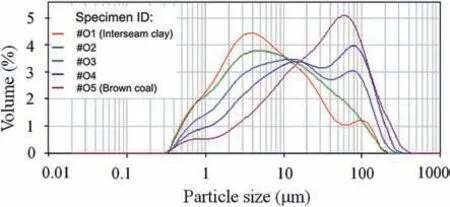
Fig.18. Laser diffraction particle size distributions for clay, brown coal and clay-coal mixed samples.
6.1. Mixing process
Soil mixtures were constructed by mixing organic content with an inorganic soil. Although the organic matter is different, the mineralogy of the non-organic fraction is the same(Franklin et al.,1973). To create the clay-coal mix samples (O2, O3 and O4), dried interseam clay and coal were separately powdered and passed through a 300 μm sieve. The powder was then mixed for varying ratios (see ‘organic content’ in Table 2) and passed through the sieve again to facilitate thorough mixing. Drying brown coal at temperatures greater than 35°C can release the organic compound butylated hydroxytoluene, affecting the chemical nature of the brown coal surface(Swann et al.,1973).For this reason,the brown coal was air-dried prior to mixing, to prevent changes to the coalwater interactions upon remoulding (Swann et al., 1973), with a moisture content of 14% rather than 0%.
6.2. Remoulding
Powdered samples were mixed with water, forming a paste at approximately the liquid limit,as recommended by Burland(1990).Sample O5 was mixed at a water content based on the liquid limit linear trend.The paste was cured for 24 h prior to being placed into the MRMSDS shear box. Filter paper was placed at the boundaries between the steel drainage plates and the soil sample, to prevent the soil paste from being squeezed through the gaps of the shear box during pre-consolidation. The steel plates were placed with their smooth sides facing the specimen to allow the filter paper to perform effectively.
The shear box containing the unconsolidated specimen was placed in the water bath without water. A pre-consolidation pressure of 1500 kPa representing the typical pre-consolidation pressure at Latrobe Valley mines was then applied incrementally. The initial increments were sufficiently small(approximately 25 kPa)to prevent the soil paste from being squeezed out.
The results from the MRMSDS test (Table 3) show that an increase in organic content correlates with a significant increase in the measured effective residual friction angle and a decrease in the measured cohesion. As noted in previous literature, the peak friction angle and unconfined compressive strength of a cohesive soil decrease with the increasing value of organic content(Franklin et al., 1973; Thiyyakkandi and Annex, 2011). The residual friction angle vs. organic content in Fig.17 shows that the relationship is nonlinear in appearance.
The increase in residual shear strength can be explained by the difference in particle size distribution between interseam clay and brown coal. As the average particle size of a soil sample increases,inter-particle contact pressure and edge-to-edge interlocking also increase, resulting in an increase in residual shear strength(Terzaghi et al., 1996). The particle size distribution of interseam clay, brown coal and each of the clay-coal mixes was measured using laser diffraction analysis.Three results were obtained for each sample,and from these results,an average particle size distribution was obtained. The average particle size distribution of each of the three results is displayed in Fig.18. It shows that the average particle size of the interseam clay is approximately 4 μm.The average size of the coal particles is approximately 15 times that of the interseam clay(60 μm).
7. Conclusions
A modified DS device has been designed,modelled numerically to simulate the behaviour, and constructed successfully for MRMSDS testing to obtain high-quality residual shear strength parameters in a practical setting for organic mixtures of clay and VBC. The results of DS tests continue to be an important factor in determining the shear strength parameters necessary for slope stability analysis for the open-pit mines of the Latrobe Valley region.CEL numerical simulation was performed to accommodate for the large-strain behaviour of the multiple reversal DS process.The method was capable of simulating the multiple reversals that are necessary to determine the residual shear strength parameters.Although both conventional FEM and ALE methods were incapable of simulating the DS process due to excessive mesh distortion,CEL successfully modelled the multiple-reversal procedure. Numerical models of scenarios reducing load cap tilting and sample loss were simulated prior to construction of a MRMSDS device to assess the efficacy of potential equipment designs.
Perfectly flat residual curves cannot always be expected in any test due to the nature and variability of soil specimens. The modifications can be easily incorporated into any soil laboratory’s DS testing apparatus,enabling more accurate measurement of residual shear strength in MRDS or MRMSDS tests with minimal additional cost or effort.It should be noted that in the cases where significant dilatancy is observed, the parallel guided upper frame cannot lift perpendicular to the shearing direction, potentially leading to an overestimation of the shear strength parameters. In this research,initial numerical simulation was limited to an arbitrary nondilatant, sandy material. As such, further investigation of the impacts of dilatant materials on residual DS testing is well suited to CEL simulation. However, as minimal dilation is observed with DS testing of the materials in this research, the effect on the research conducted in this work was considered to be negligible.
When performing the MRMSDS test on VBC, the addition of organic content to a fine-grained cohesive soil (interseam clay)resulted in a linear increase in the liquid and plastic limits, as the organic particles have a higher water adsorptive capacity than clay.It also resulted in a significant increase in the effective residual friction angle, also measured in the multi-reversal, multi-stage DS test.This increase in residual shear strength can be attributed to the larger average particle size of brown coal.Therefore,interseam clay with the lowest organic content is the weakest material in relation to permanent batter slope stability analysis of Latrobe Valley openpit coal mines. As such, this study provides important results for further understanding the behaviour of materials necessary to the ongoing stability of the mines in the region,while also providing a suitable apparatus and testing regime for all materials susceptible to sample loss and load cap tilting.
Declaration of competing interest
The authors declare that they have no known competing financial interests or personal relationships that could have appeared to influence the work reported in this paper.
Acknowledgments
Financial support for this research has been provided by the Earth Resources Regulation of the Victorian State Government Department of State Development, Business and Innovation,Australia.The assistance of AGL Loy Yang and GHD Australia is also acknowledged for their support and help with sample collection.The assistance of Rajaram Kamilla, a postgraduate student at Federation University Australia, for sample preparation is also gratefully acknowledged. The authors would also like to acknowledge support from the Monash University Postgraduate Publications Award.
 Journal of Rock Mechanics and Geotechnical Engineering2021年5期
- Journal of Rock Mechanics and Geotechnical Engineering的其它文章
- Surface characteristics analysis of fractures induced by supercritical CO2 and water through three-dimensional scanning and scanning electron micrography
- Prediction of fracture and dilatancy in granite using acoustic emission signal cloud
- Hysteresis in the ultrasonic parameters of saturated sandstone during freezing and thawing and correlations with unfrozen water content
- A novel true triaxial test system for microwave-induced fracturing of hard rocks
- Hydromechanical behavior of unsaturated expansive clay under repetitive loading
- Laboratory large-scale pullout investigation of a new reinforcement of composite geosynthetic strip
