Prediction of fracture and dilatancy in granite using acoustic emission signal cloud
Dongjie Xue, Ln Lu, Lie Go, Lele Lu, Cheng Chen
a School of Mechanics and Civil Engineering, China University of Mining and Technology, Beijing,100083, China
b State Key Laboratory of Coal Mine Disaster Dynamics and Control, Chongqing University, Chongqing, 400030, China
c Key Laboratory of Safety and High-efficiency Coal Mining, Anhui University of Science and Technology, Huainan, 232001, China
Keywords:Fracture network Acoustic emission (AE)Spatial correlation Dilatancy Damage Fracture angle
ABSTRACT The invisibility of fracture network evolution in the rock under triaxial compression seriously restricts the correlation modeling between dilatancy behavior and fracture interconnectivity. The key to solving such a challenge is strongly dependent on the accurate modeling of the spatial correlation in fracture network, which could be indirectly re-constructed by the acoustic emission (AE) signal cloud. Considering the interaction of local fractures, a cube cluster approach is established to describe the spatial correlation.The evolutional cube clusters effectively present the geometric characteristics induced by the increasing dilatancy of fracture. Two descriptors (i.e. three-axis length sum and pore fraction) are introduced to correlate cluster model with dilatancy behavior. Most fitting results support the linear correlation between two descriptors and volumetric strain, which verifies the sensitiveness of the cube cluster model to dilatancy. More importantly, by the statistical analysis of cluster structure, the cluster model shows the potential of calculating fracture angle. Moreover, a comparison between dilatancybased damage and porosity-based damage is made not to prove the best but provide an AE-based prediction of local damage evolution. Finally, four classical models for calculating fracture angle are compared. The deviations prove the huge difficulty of describing the development of the fracture network uniquely dependent on a fracture angle. The proximity of measured angle and cluster-based angle supports the effectiveness of predication by the cube cluster approach.
1. Introduction
The real-time monitoring technology of acoustic emission (AE)(Grosse and Ohtsu, 2008; Cheon et al., 2011; Gholizadeh et al.,2015) has been widely used to investigate the damage evolution(Baud et al.,2004)or fracture connection(Lei et al.,2000;Biancolini et al.,2006)in various rocks.However,the three-dimensional(3D)spatial distribution of AE events shows strong randomness and complexity in describing the evolution of rock failure (Shah and Labuz, 1995). Commonly, the scatter plot is used to qualitatively illustrate the 3D distribution(Hirata et al.,1987;Baud et al.,2004).Additionally, a quantitative analysis is still urgently needed (Hsu et al., 1977; Grosse et al., 1997) and one of the most important ways is to describe the spatial correlation(Li et al.,2010).In the AE signal cloud, the spatial correlation is the basis to investigate the interaction of fracture connection (Biancolini et al., 2006), propagation(Lysak,1996),and dilatancy(Alkan et al.,2007).Indeed,the statistical description of spatial distribution and the accurate modeling of the spatial correlation of randomly distributed AE signals have equal importance in quantitatively analyzing the fracturing process.In the brittle failure,some abrupt phenomena or behaviors,i.e.surge of AE events(Mansurov,1994)or occurrence of stress drop(Kurz et al.,2006;Lockner et al.,1992),will occur,which are mainly induced by the connection completion of fracture network separating the entire sample into several blocks.Although the brittle failure presents the instantaneity, the initialization,locally clustering and full connection of fracture network sequentially occur corresponding to the transition of local-to-whole connection. To analyze such spatial correlation of AE signal cloud may promote the investigation of the mechanism of rapidly progressive failure.
Earlier, Vere-Jones (1977) noticed the critical transition of the failure process and proposed a concept of AE-based critical parameters as a precursor of predicting the brittle failure, which needs a subtle description of short-range correlation of fracture network. Due to the strong correlation between critical behavior and completeness of fracture connection, two key parameters, i.e.growing correlation length and increasing sensitivity, were suggested (Jaumé and Sykes, 1999). However, such analysis did not strictly distinguish the difference between spatial distribution and correlation. Due to the invisibility of the connecting process of a fracture network in rock,establishment of spatial correlation of AE signal may provide a direct observation. Then, Frohlich and Davis(1990) and Davis and Frohlich (1991) proposed the single-link cluster (SLC) to investigate the spatial correlation. Based on the SLC,Zöller et al.(2001)and Tyupkin and Di Giovambattista(2005)made a deep analysis of the earthquakes. Also, Li et al. (2010)coupled the SLC with the AE monitoring technology on a laboratory scale. Recently, Zhang et al. (2017) made a fractal analysis of spatial AE events based on SLC model.Scientifically,the SLC seems to be a long-range correlation model dependent on the point-topoint link of AE events.
In the theoretical view, the critical description of catastrophic behaviors could be effectively illustrated by the percolation model of fracture network(Chelidze and Kolesnikov,1984;Renshaw et al.,2017; Ren et al., 2017). In the brittle failure, the fast fracture connection often refers to the extreme growth of correlation length. Many remarkable contributions have been made to illustrate such critical behavior before failure by the percolation model.Guarino et al. (1998) defined a normalized pressure to investigate the localization of AE events by percolation modeling of cumulated energy. Alkan (2009) and Xue et al. (2018) separately made the normalized stress- and strain-based percolation models to investigate the dilatancy-induced connection of the fracture network.Then,Sakhaee-Pour and Agrawal(2018)integrated AE data into the percolation model.Recently,Xue et al.(2020a,b,2021)established an AE-based cluster damage model. Unlike the SLC model, a percolation model can provide a solution to describe the shortrange correlation.
Although there is a significant development of SLC for interpreting the large-scale failure, there are still great challenges to investigate the short-range correlation on a local scale. The main reason is that the post-generation of fracture is seriously dependent on pre-ones, indicating the effect of local dependence. Such dependence on a local scale could not be accurately described by a completely random model. Aiming at solving such challenges, our work intends to introduce a cube cluster approach to analyze the dilatancy-induced fracture connection, while it will not undertake an exhaustive comparison of the SLC method.
2. Materials and methods
2.1. Sample preparation and AE signal collection
Generally,generation of AE in the hard rock is much easier to be measured than that in the soft rock.The granite as a hard rock is an ideal medium to collect AE signals during rock failure. Here, the rock cores were sampled from a deep granite stratum and then processed into standard cylinders with the same diameter of 50 mm and height of 100 mm.Three cases with confining pressures of 5 MPa, 20 MPa and 30 MPa are considered for the conventional triaxial compression tests.After the designed value of the confining pressure is approached, the axial force is applied until granite failure. To obtain the complete stress-strain curve, the control mode is changed from the stress-to strain-feedback when approaching the peak stress, which is easily realized by the MTS 815 rock testing system.Besides,eight AE sensors are fixed outside the steel chamber to monitor AE events. The sensor frequency is 150 kHz, and the sampling frequency is 40 MHz. Moreover, the threshold of sound intensity is set as 45 dB and all AE signals above the threshold will be recorded by the PCI-2 AE system(Fig.1a).
2.2. A cube cluster approach
If the AE sensors could perfectly capture each signal,the location cloud could comprehensively represent the 3D fracture network.The outside shape of the cloud could be similar to the macrogeometry of the fracture network. However, its inner connection,especially in a local region, could not be subtly observed. Indeed,there is a huge problem of over-dependence on spatial distribution but ignoring the performance of spatial correlation.The topological connection inside the AE signal cloud is a crucial factor for the investigation of the mutual influence.An ideal solution is to build a proper model of spatial correlation and its representativeness relies on an appropriate scale to measure the connectivity of the fracture network.It indicates that there will be a critical transition of shortto-long connections and seeking a critical scale to investigate connectivity is extremely important (Fig.1b).
Determination of criticality seriously depends on the connecting level of the fracture network. Considering the broken effect of the complete sample into pieces, the failure is intrinsically a progressive connection of fracture network, i.e. a local-to-whole connection. After the peak stress, the fracture network across the whole sample scale instantaneously forms and it will immediately split the entire sample.Based on this phenomenon,the peak state can be taken as a critical transition of increment-to-decrement of deviatoric stress,which corresponds to the transformation from local to the whole connection of fracture network.Thus,there is a necessity of determining the critical scale, on which there is a one-to-one map of the transition between the local-to-whole connection of fracture network in topology and change of increment-todecrement of deviatoric stress at peak stress.
Considering the local interaction,the 3D cube is introduced as a measuring tool to investigate the spatial correlation. Unlike the point-by-point connection by links,the cube is used to cover a local range of AE signals and all internal signals together influence the cube damage. Various cubes will generate and they may be connected by the surface, line or point. Here, the surface-to-surface contact is mainly considered to establish the cube cluster.
The first challenge is the quantitative evaluation of the critical connectivity of the fracture network at peak stress(Fig.2a).Due to the difficulty of calculating the connectivity,a replaceable variable is needed. To cover the same AE signal cloud, cubes with different sizes may be adopted to form the one-to-one mapping-based cluster volume.If considering the complete damage of cube cluster,all cubes will be void and the cube size will uniquely match a pore fraction φ, which is defined as the volume ratio of cube cluster to the cylinder by(Jarvis et al., 2017):

where n and δ are the cube number and length,respectively;and r and h are the cylinder radius and height, respectively.
The second challenge is the accurate recognition of the connection completeness of the fracture network (Fig. 2b). If the cube size is very large, only a few of cube clusters cover all AE signals and they must be interconnected.On the contrary,too small cubes will never link with others at all.Accordingly,the first task is to identify the cube contact of surface-to-surface. Then, various cube clusters will be formed and the largest cluster (LC) will dominate the clustering behavior progressively. Thus, the second task is the accurate determination of LC in all cube clusters (AC).Only one cube size corresponds to the critical transition of local-towhole connection. Therefore, the third task is the judgment of LC approaching the outside boundary of the granite cylinder.
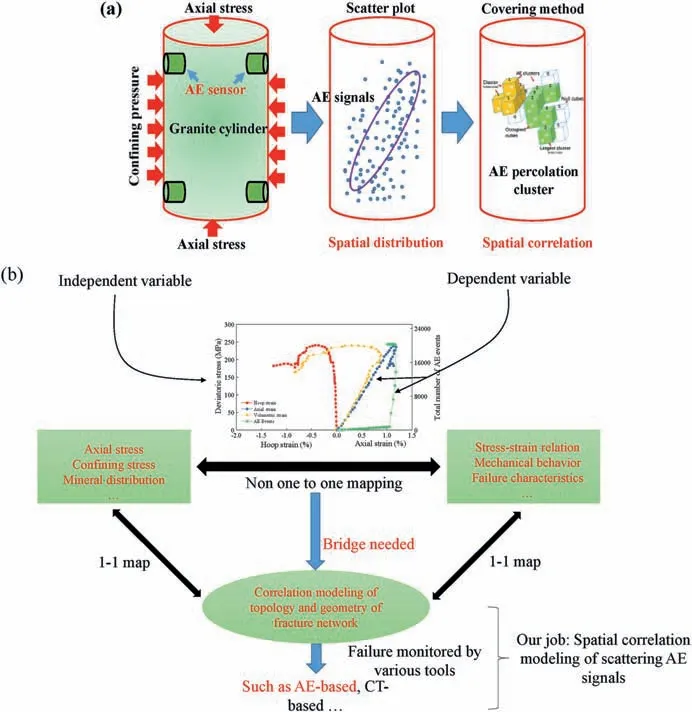
Fig.1. Schematic illustration of(a)two descriptive methods based on spatial distribution and correlation of AE signal cloud and(b)the original thinking of spatial correlation model.
As a classical algorithm for analyzing clustering behavior,the HK algorithm(Hoshen and Kopelman,1976)is introduced to recognize various cube clusters. By a series of operation including the cube establishment, cube marking, cube union and cluster labeling, the first two tasks of contact recognition and the LC searching could be determined precisely. After the LC determination, the length and width of the LC in the radial direction could be easily determined.
The third challenge is the accurate determination of the criticality of the local-to-whole connection (Fig. 2c). The criticality corresponds to the critical cube with critical length.If the cube size is less than the critical value,the critical connection will be delayed.On the contrary, it will prematurely occur not at the present peak stress.Hence,the critical cube length is unique.Given any two limit states of a very large cube and a very small cube, both limit connectivity can be determined.Then by the dichotomy of cube length,the criticality could be uniquely determined.After using the critical cube to cover all AE signals, the corresponding cube cluster is established and termed the AE percolation cluster(APC)due to the originality of covering strategy from the percolation model(Stauffer and Aharony, 2014). Unlike the traditional modeling of spatial correlation by point-to-point link(Frohlich and Davis,1990;Davis and Frohlich, 1991), the APC focuses on the local range of spatial correlation. Hence, the advantage of the APC model is the introduction of the volumetric factor into the spatial correlation description.
Fig.3 shows the convergence process of determining the critical pore fraction by the dichotomy of cube length.Many intermediate states are needed to narrow the searching range. To make a clear presentation,the abscissa values are marked by the log calculation of cube length divided by sample diameter.Two fractions of LC and AC at various cube scales are calculated and compared. The difference between the two evolutional curves is very little,which shows the rationality of LC instead of AC being consistent with the classical view of the percolation model (Stauffer and Aharony, 2014).Three critical cube lengths under confining pressures of 5 MPa, 20 MPa and 30 MPa are calculated as 2 mm, 2.54 mm and 2.3 mm,respectively. On the curves, six states are selected to help understand the convergence process. With the enlarging cube cluster,there is a decreasing trend of cube number but with a growing pore fraction.Thus the influence of cube number on the cluster volume is weakening compared with that of the cube size. Besides, three LCs are entirely different in geometry structure. However, the geometry of LC and AC tends to be similar.
2.3. Decomposition of cube cluster
Description of the complex structure of the 3D fracture network is full of challenges. The complexities in cluster geometry and topology both exist. It should be noted that the cube cluster is intrinsically an AE-based characterization of the fracture network.Indeed,the structure of the cube cluster is better than the fracture network in the hierarchy.Hence,a layer-by-layer observation could be made for the composition of a complex cluster. To comprehensively observe the 3D cube cluster,an isometric view could be made in three orthogonal directions(X,Yand Z)in Fig.4a.Three groups of orthogonal layer clusters form the same 3D cube cluster.
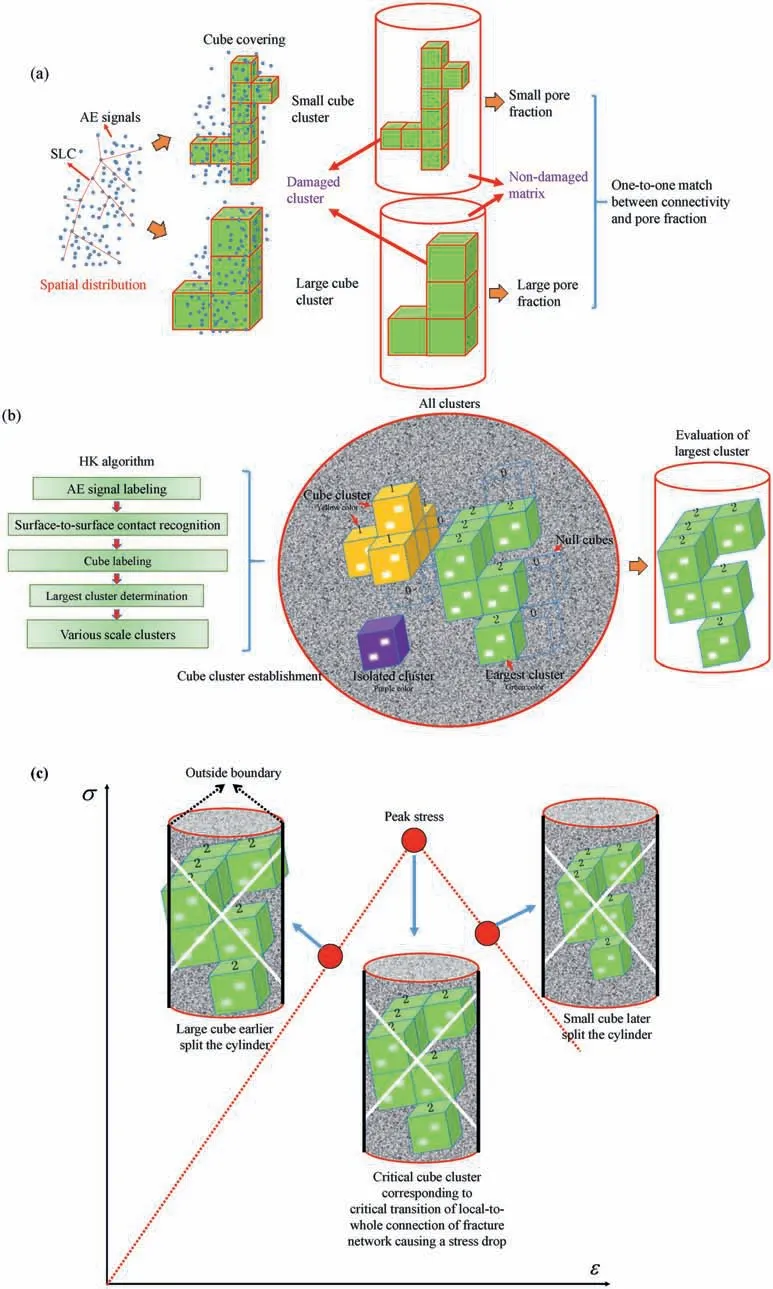
Fig. 2. Modeling process of cube cluster of spatial correlation referring to three steps of (a) establishing the cube covering method, (b) determining the largest cluster, and (c)recognizing critical cube cluster.
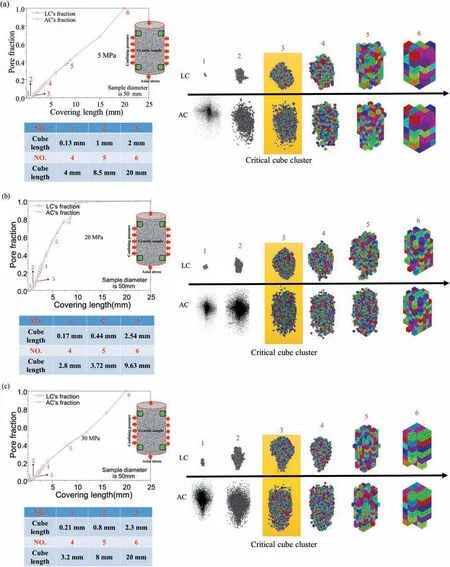
Fig. 3. Determination of the critical length for covering cubes under confining pressures of (a) 5 MPa, (b) 20 MPa and (c) 30 MPa. In each sub-figure, the convergence process of critical size by pore fraction with the log description of arbitrary covering length,the comparison of the largest cluster(LC)and all clusters(AC),and the evolutional cube lengths are shown.
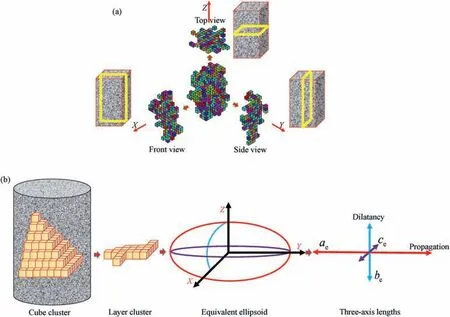
Fig. 4. Cube cluster decomposition by (a) isometric view and (b) description of layer cluster by the equivalent ellipsoid.
However, accurate description of the two-dimensional (2D)layer cluster is still difficult.To solve such a problem,the 2D model needs to be simplified.In Fig.4b,an equivalent ellipsoid is proposed to describe the orthogonal anisotropy by its three-axis lengths,i.e.major, intermediate and minor lengths labeled byae, beand ce,respectively.
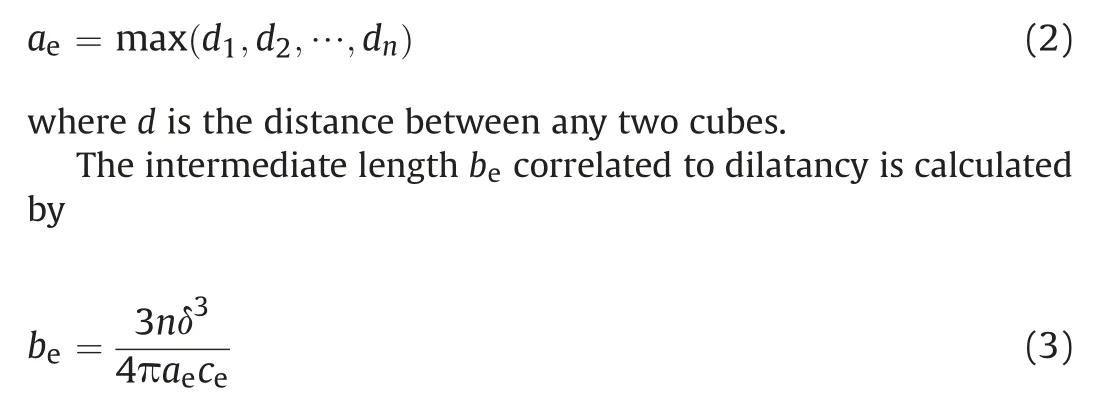
There is an equivalent volume of layer-cluster with its correspondent ellipsoid. By accumulating all cubes, the total volume could be easily calculated by the product of cube number and cube volume.The minor length ceis regarded as the critical cube length δ. To determine the major length ae, its direction is assumed to be consistent with the two farthest covering cubes. It is coincident with the fracture propagation because there is a high probability of AE signals generated at the fracture front.Thus the major length aeis defined as
Each layer cluster has a unique centroid cube. In a fixed direction, a series of centroids connects each other, forming the curved axis.Hence,the major,intermediate and minor lengths are used to describe 2D layer-cluster and three orthogonal curved axes are adopted to describe 3D cube cluster. Correspondingly, three coordinates of xc, ycand zcare defined as

where x, y and z are the covering cube’s coordinates.
3. Results
3.1. Evolution of cube cluster
After the test, three groups of complete stress-strain curves under three confining pressures of 5 MPa,20 MPa and 30 MPa are obtained in Fig.5.By collecting the AE data,the total number of AE events is also determined. In a burst signal waveform, when its envelope is detected and the waveform exceeds the preset threshold voltage for a certain period of time,a rectangular pulse is formed,which is called an event.The total number of events in an AE process is the sum of all these events. There is nearly no clear ductile deformation even under a high confining pressure of 30 MPa.Hence,the brittleness of granite is very clear,but it mainly shows an unstable mode II failure (Wawersik, 1968), which indicates that in the post-failure, the axial strain rebounds. Such reason is extremely complex, and at present, there is no common consensus yet. Besides, the stress drops are dramatically obvious,which are mainly induced by the completeness of fracture connection.Compared with the volumetric strain curve,the initial nonlinearity of the axial stress-strain curve before peak stress corresponds to the onset of dilatancy.Unlike the smooth transition of nonlinearity for three stress-strain curves, the correlation between accumulating AE events and axial strain is completely different. The most significant feature is the sharp increment of accumulating AE events.
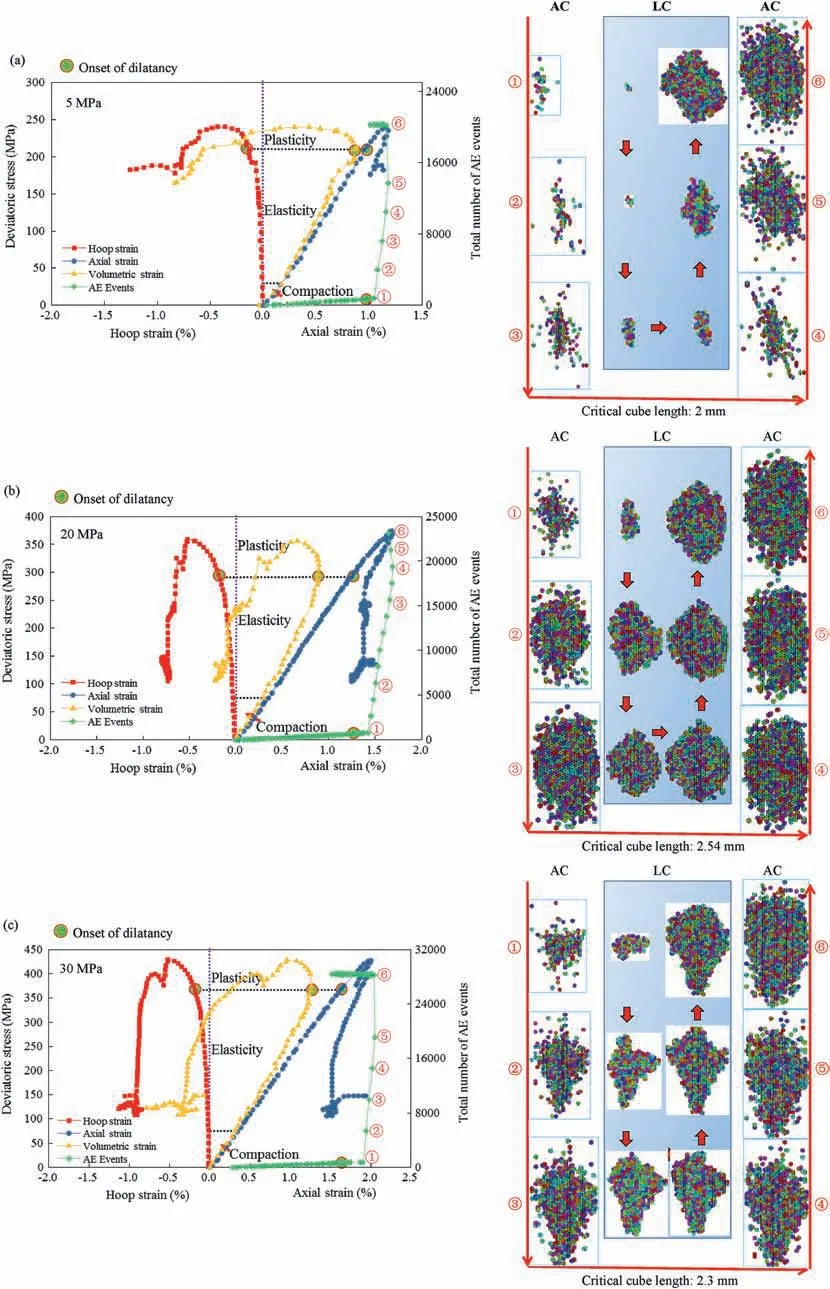
Fig.5. Three complete stress-strain curves under confining pressure of(a)5 MPa,(b)20 MPa and(c)30 MPa with the geometric evolution of largest cluster(LC)and all clusters(AC).
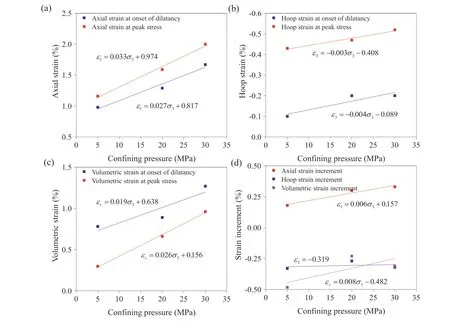
Fig. 6. Linear correlation of (a) axial, (b) hoop and (c) volumetric strains with the increasing confining pressure at the onset of dilatancy and peak stress and (d) their increments correlated to the confining pressure.
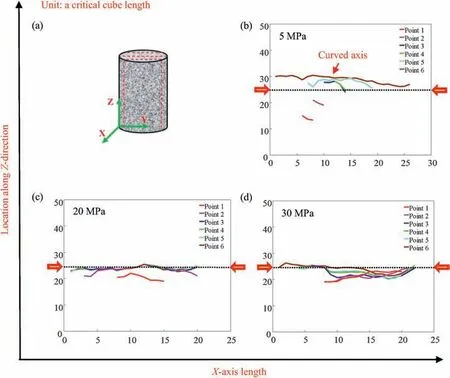
Fig. 7. Evolutional centroid axes along X-direction. (a) Indicates the sketch of layer clusters and (b-d) correspond to three confining pressures of 5 MPa, 20 MPa and 30 MPa,respectively.
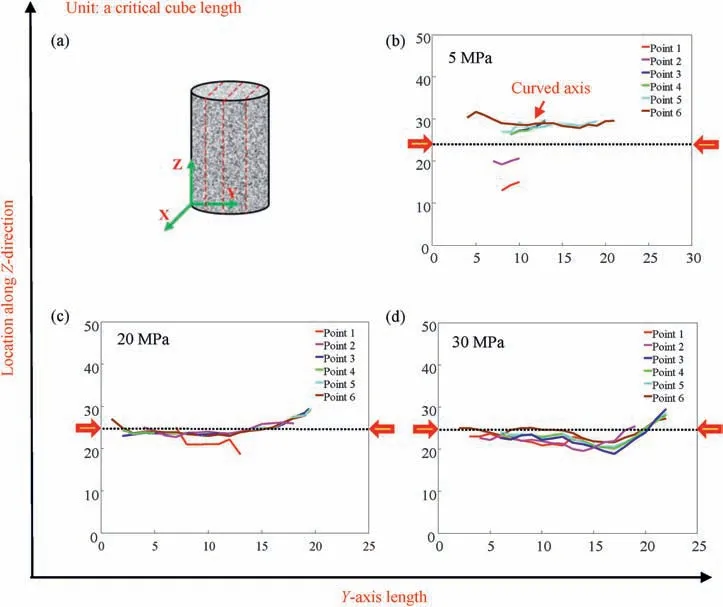
Fig. 8. Evolutional centroid axes along Y-direction. (a) Indicates the sketch of layer clusters and (b-d) correspond to three confining pressures of 5 MPa, 20 MPa and 30 MPa,respectively.
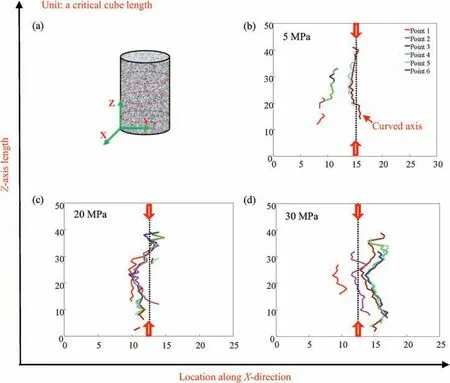
Fig. 9. Evolutional centroid axes along Z-direction. (a) Indicates the sketch of layer clusters and (b-d) correspond to three confining pressures of 5 MPa, 20 MPa and 30 MPa,respectively.
At the linearly elastic stage, few AE signals are monitored and captured,which shows that the fracture propagation may cease or develop on a very small scale.Such subtle fractures cause very weak AE signals, which could not be effectively monitored. However,once the dilatancy occurs, the number of AE events increases significantly. On the macro-level, this phenomenon is induced by the increasing dilatancy.Conversely,on the small-scale,the causing factors of this phenomenon include fracture propagation and dilatancy referring to its openness.After peak stress,the number of AE events drops greatly.Hence,the main interval of fast-increasing AE events is from the onset of dilatancy to the peak stress.
Correspondingly, the correlation of axial, hoop and volumetric strains and their increments with the increasing confining pressure are also obtained in Fig.6.Two states at the onset of dilatancy and peak stress are especially focused on.There is a positive correlation of axial, hoop and volumetric strains with the confining pressure.However,referring to the strain increment,the linear relation fails in describing the hoop and volumetric strains except for the axial strain. It is deduced from two very small square roots indicating improper fitting. To some extent, such deviation is influenced by the unpredictability of the random distribution of the fracture network.In other words,the linearity is appropriate to investigate the triaxial behaviors of various samples under different confining pressures. However, the huge deviation shows that for a detailed sample with a fixed confining pressure, the evolution of triaxial behaviors needs to be assessed in another way.The nonlinearity is strongly correlated to plasticity,but the limited growth of plasticity also promotes the difficulty to establish a proper model. Adopting the AE signals to reveal the evolution of the fracture network may be an effective choice. The AE curves present a common characteristic of jumping accumulation, which satisfies the definition of critical transition in the percolation model(Sahimi,1993).Thus the cube cluster modeling considering the criticality is greatly helpful to reveal such transition behavior.
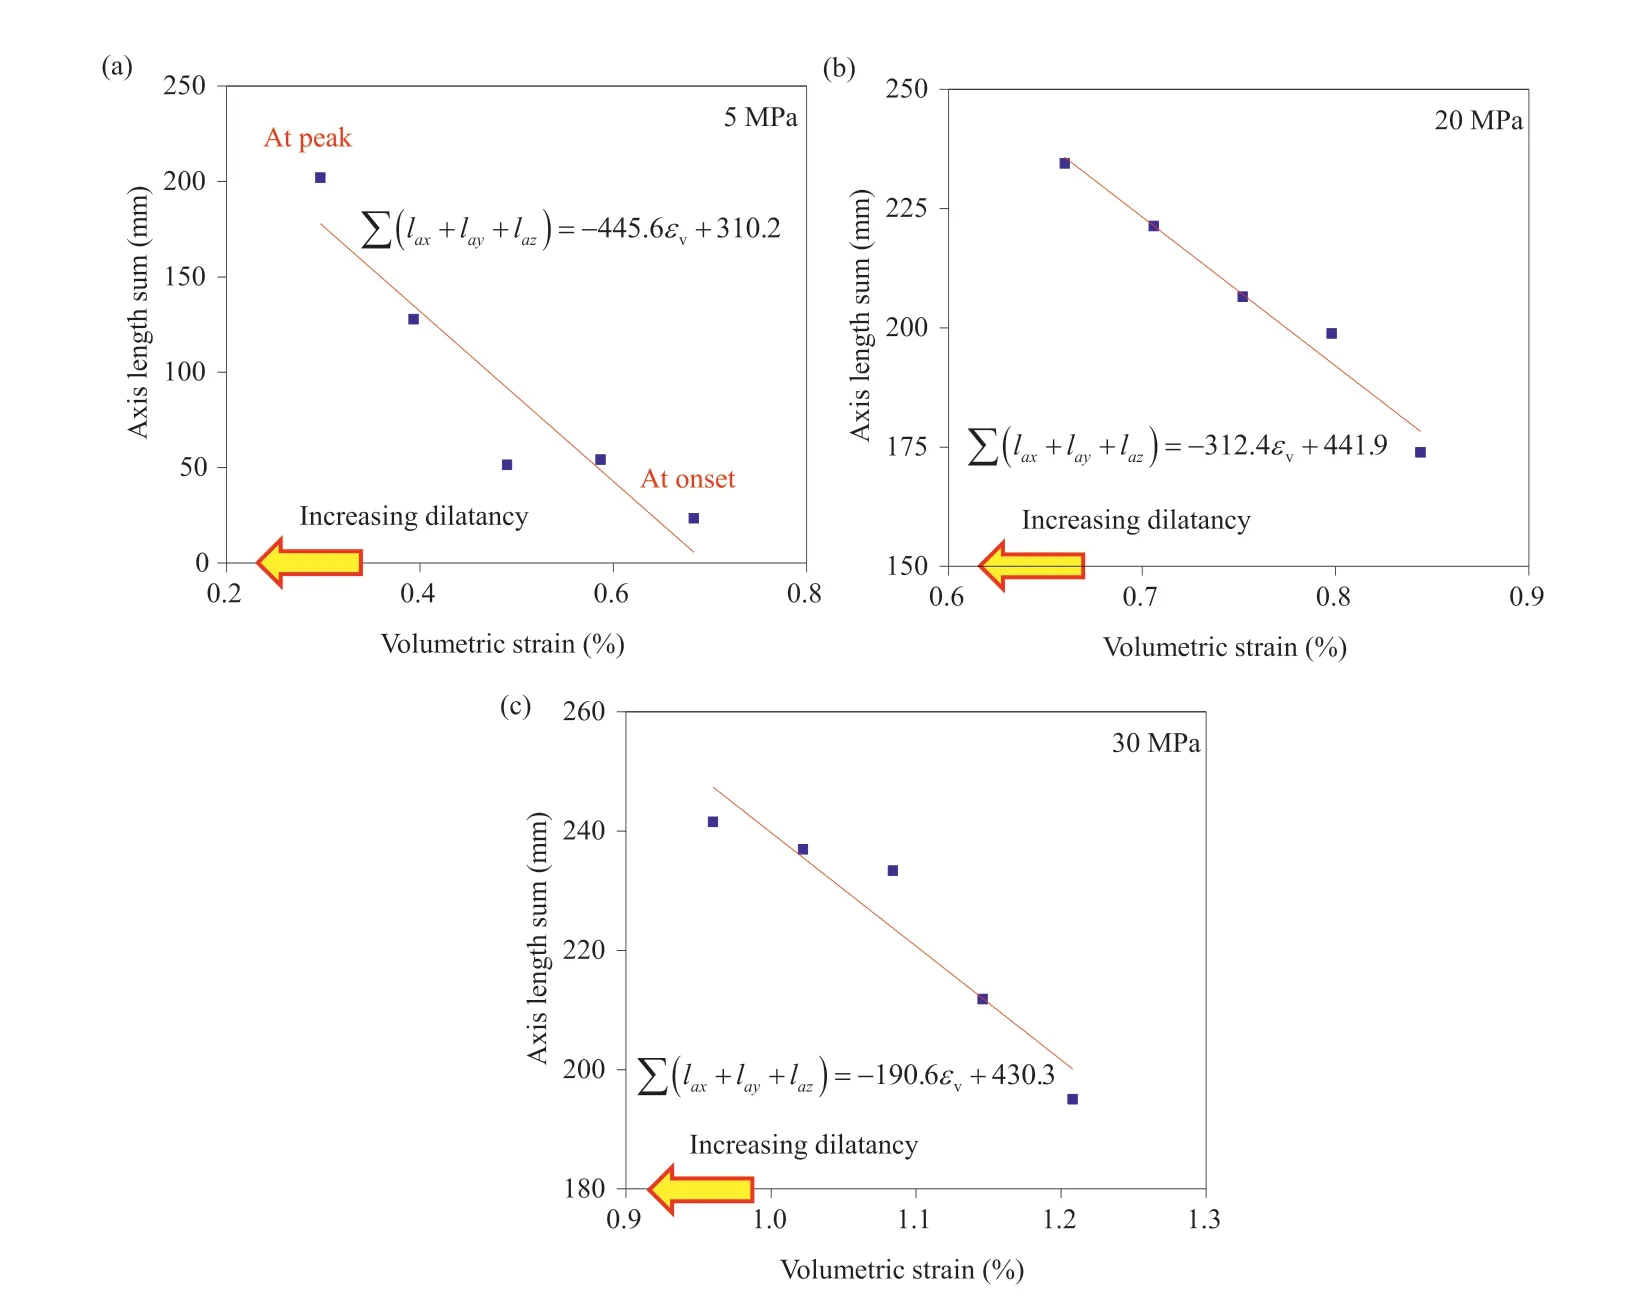
Fig.10. Relationship between axis length sum and volumetric strain under confining pressures of (a) 5 MPa, (b) 20 MPa, and (c) 30 MPa.
To illustrate the rapid evolution, six states on AE curves are selected to model the cube clusters based on the distributed AE signals.At the critical cube scale, three groups of cube clusters are modeled and visualized in Fig. 5. There is an obvious growth in cluster volume and cube number. Meanwhile, at six states, the geometric difference exists between LC and AC, but which is weakening with the enlarging cluster. Such evolution of subtleties in cluster shape and volume is helpful to investigate the failure process. However, a more quantitative description needs to be made.
3.2. Relationship between dilatancy and cube cluster
Naturally, the sample dilatancy is influenced by external deviatoric stress.The direct carrier of dilatancy is the inner fracture network. Such intrinsic correlation provides a possibility of establishing a relationship between AE-based cube cluster and dilating deformation. According to Eq. (4), each centroid of layer cluster is uniquely determined,and by connection,three orthogonal axes are obtained in Figs. 7-9. All the axes are curved and some of them seriously deviate from the central line.The curvature indicates the variability of distributed centroids of layer clusters, which reflects the asymmetry of the geometric shape of the cube cluster.
Besides,the extension of curved axes at two ends is also obvious,suggesting the continuous growth of the cube cluster. The curvature, deviation and extension of curved axes may all influence the dilatancy. Here,the curvature is not estimated but the attention is mainly focused on the location deviation and axis length extension.Considering the evolution of three groups of curved axes along X-,Y- and Z-direction, there are two basic classifications including overlapped axes (Fig. 7c and d, 8c, d and 9c) and non-overlapped axes (Figs. 7b, 8b and 9b, d). The overlap means that the postgeneration of axes seriously depends on the pre-ones, which mainly corresponds to the propagation of original fractures.On the contrary, the non-overlap indicates the dominance of new fractures, which will cause a huge deviation in location. Under small confining pressure of 5 MPa, three groups of axes are all nonoverlapped, but under a high confining pressure of 20 MPa and 30 MPa, most axes are overlapped. It indicates the obvious constraint effect of high confining pressure on new fracture generation.
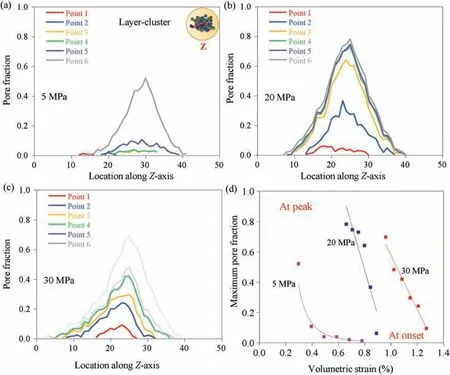
Fig.11. Evolution of pore fraction distribution along Z-axis under confining pressures of(a)5 MPa,(b)20 MPa and(c)30 MPa,and(d)correlation of maximum pore fraction with the volumetric strain. The unit for the horizontal axis in (a)-(c) is in critical cube length.
Moreover, the dramatic increment of the three-axis length shows the growing cube cluster in three directions.Fig.10 shows a negatively linear correlation between the axis length sum and volumetric strain. The onset of dilatancy corresponds to a maximum positive volumetric strain. Then, the compressive deformation rebounds. Hence, there is a positive relationship of enhancing dilatancy with the increasing axis length sum.
Similar to the definition of 3D pore fraction in Eq. (1), the 2D layer cluster-based pore fraction could also be calculated. Fig. 11 shows the evolution of 2D pore fraction distribution along the Zaxis for three samples. In certain states, the distribution curve shows imperfect symmetry with a large pore fraction at the central position. Besides, there is an obvious increment of pore fraction from initial to peak state corresponding to points 1 and 6 marked on the AE curves in Fig.5.Considering the maximum pore fraction,there is a transition of nonlinear to linear dependence on volumetric strain from confining pressure of 5 MPa to 20 MPa and 30 MPa.
To summarize,both two descriptors of axis length sum and pore fraction show a strong dependence on the volumetric strain.Most descriptions support the linear correlation,and with the increasing dilatancy, two descriptors increase dramatically. Such strong dependence effectively proves a close correlation between the AEbased cube cluster and the dilatancy behavior.
3.3. Relationship between fracture angle and cube cluster
The prediction of fracture angle is always a challenge due to the ineffective assumption of the plane surface instead of the real arched fracture. Generally, the fracture angle is measured after triaxial compression and taken as a constant. However, fracture generation is an evolutional process, which indicates a changing fracture angle needed to be evaluated. The AE monitoring technology as a real-time tool to indirectly and effectively observe the evolutional fractures provides feasibility to predict the fracture angle evolution. To our knowledge, few efforts have been effectively made for such estimation based on the AE signal cloud.One of the most important reasons is the lacking analysis of spatial correlation, which can properly reveal the dependence of postgeneration on pre-ones.
In the equivalent model of the ellipsoid, the propagation and dilatancy of the layer cluster are described by the major and intermediate axes, respectively. The major axis is potentially consistent with the fracture direction and all major axes can statistically demonstrate an average of fracture angles. Based on the above hypothesis,each layer cluster will have its fracture direction,and in the isometric view, three fracture angles could be calculated.
Taking the cylinder sample into a geological scale, the fracture angle will become the dip angle in the side view along the X-and Yaxis and the strike in the top view along Z-axis(Fig.12).Further,the fracture directions of all layer clusters are calculated and plotted together in the rose diagram (Fig.13). In the side view, there is a dominant direction especially under the high confining pressure of 20 MPa and 30 MPa,while in the top view, two crossed directions exist, indicating the conjugate effect under deviatoric stress(Barton,1976; Klein et al., 2001).
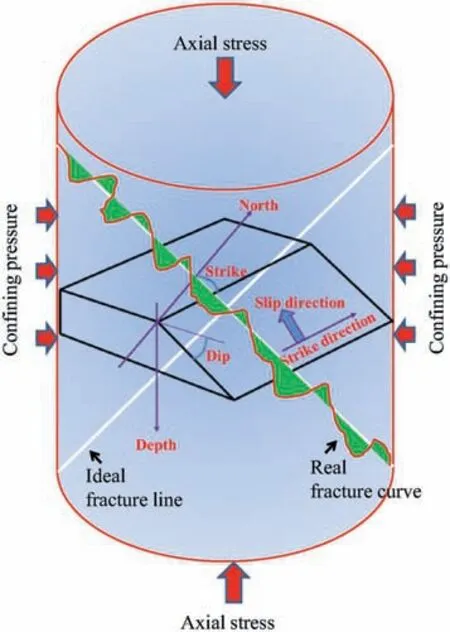
Fig.12. Comparative illustration of sample scale failure and geological fracture.
There is a common correlation of fracture angle θ dependent on the internal friction angle φ,i.e.θ = 45。+φ/2.Hence,the fracture angle larger than 45°indicates a proper range of 45°-90°for the statistics. Averagely, three groups of dip angles under confining pressure of 5 MPa,20 MPa and 30 MPa are calculated as 72.8°and 75.1°, 75.9°and 77.2°, 74.3°and 78.8°, respectively (Fig.14a). The differences between the two conjugated fracture angles are calculated as 2.3°,1.3°and 4.5°,respectively.The small differences indicate the symmetry of two shear fractures. Correspondingly, in top view, two-strike angles (Kwan, 2004)are determined as 45.4°and 123.5°,42°and 131.8°,48.8°and 136.6°,respectively for three samples (Fig.14b). Also, three fracture angle differences are calculated as 78.1°, 89.8°and 87.8°, respectively, which are close to 90°verifying the shear conjugate effect. Such a result proves the effectiveness of the AE-based cube cluster model to predict the fracture angle.
The evolution of fracture angle corresponds to the continuous propagation of the fracture network.Considering such dependence,the increment of volumetric strain is adopted to describe the correlation. Fig.15 shows a properly linear relationship between two dip angles of conjugated fracture surfaces and enhanced increment of volumetric strain. The linearity may provide a possibility of predicting the statistical fracture angle by volumetric strain increment.
4. Discussions
4.1. Application of cube cluster to damage definition
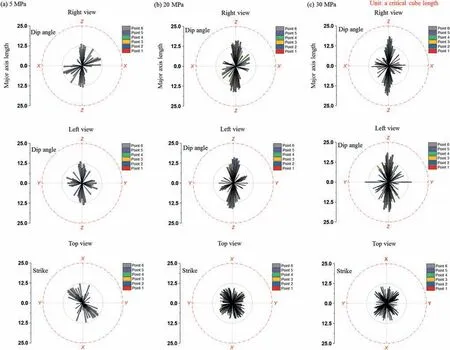
Fig.13. Isometric view of inclination distribution of layer cluster to calculate dip angle or strike by rose diagram for three samples under confining pressures of (a) 3 MPa, (b)20 MPa, and (c) 30 MPa.
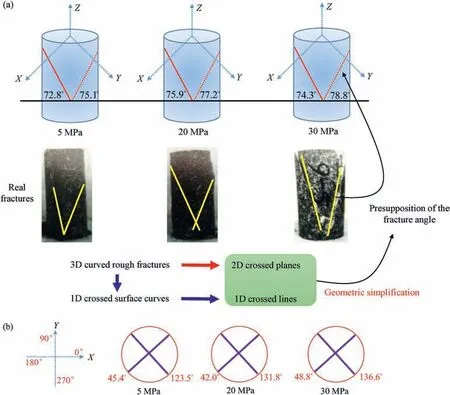
Fig.14. Fracture angle calculation based on cube cluster including (a) two dip angles in the side view and (b) two strikes in the top view.
The damage is conventionally defined based on a representative volume element (RVE). To evaluate the evolution of multi-scale damage, a lower-scale RVE is needed. However, there is no standard for the size determination of sub-scale RVE. Therefore,there is a general consideration of the average meaning of some descriptors, i.e. the unit area or volume loss of continuous matrix caused by the fracture generation. Such consideration is mainly based on the statistical average which means the sub-scale RVE can be regarded as a very small volume,even reduced to an ideal point.However,considering a physical rock,there is a strong necessity of determining the RVE size.Indeed,lack of the standard for the subscale RVE size determination seriously limits the investigation into the correlation of multi-scale RVEs. Here, the critical cube with uniqueness on strictly calculating cube length provides a choice to determine the proper sub-scale RVE.
The cross-sectional area A in Fig. 16 includes two parts of the solid area Amand void area Ap:

Both the mineral matrix and void will dilate simultaneously when the damage occurs.Correspondingly,the initial areas Aimand Aipwill increase to Armand Arp, where the subscripts i and r represent the initial and arbitrary states, respectively. In essence,the enlarging dilatancy is mainly caused by the increasing 2D void area, which is influenced by the expansion and connection of fracture networks. It means that the spherical stress-induced dilatancy is often ignored for the mineral matrix, thus the area Armis considered to be equal to Aim.On the contrary,the deviatoric stress dominates the main increment of the void area from Aipto Arp.Therefore,the new generation of the area Anpplays a key role in developing damage to the mineral matrix. Considering the deterioration of effective area Am, the damage D is defined by (Huang et al., 2002):

At the initial state, there is no increment of void area Aip, thus the damage is 0. However, most failures are caused by a complete connection of some local fracture networks. It means the distribution of local damages is non-uniform and the macro-damage of the whole sample is always less than 1. Considering the damagecorrelated porosity φ, a void ratio e is often used to investigate the compactness with a definition of the void area Aipdivided by matrix area Aimobeying
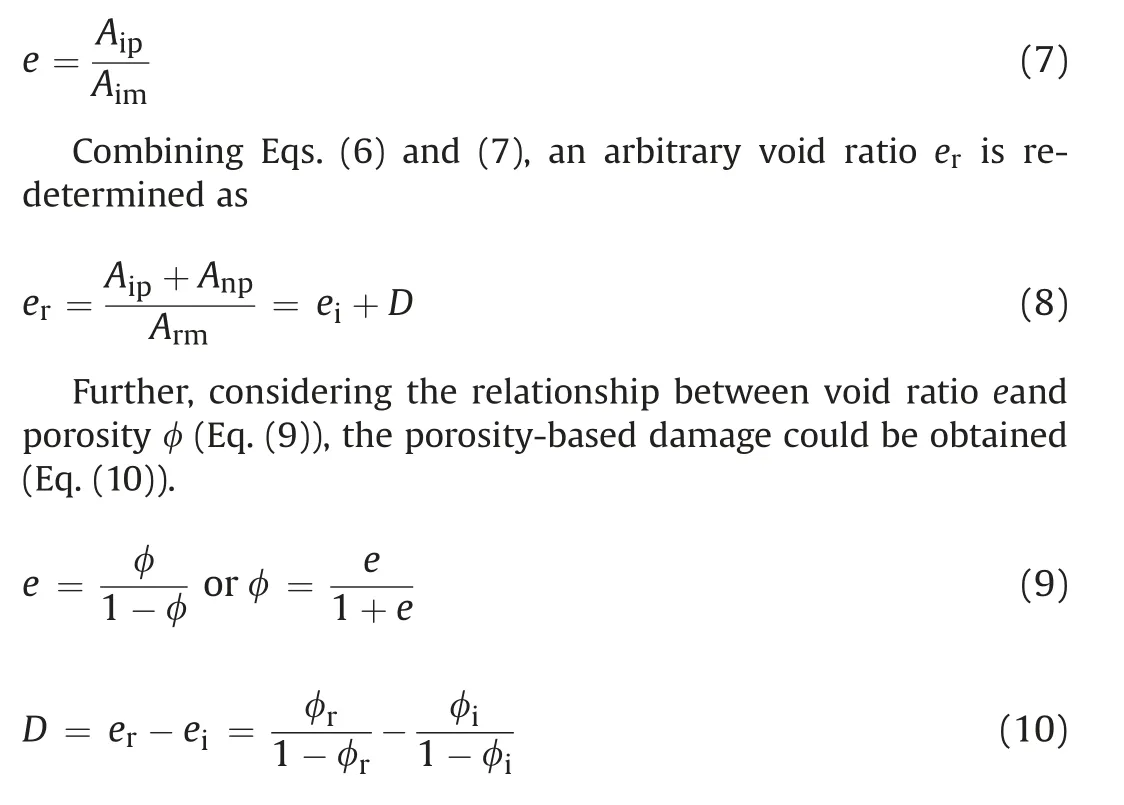
where φiand φrare the initial and arbitrary porosities,respectively.
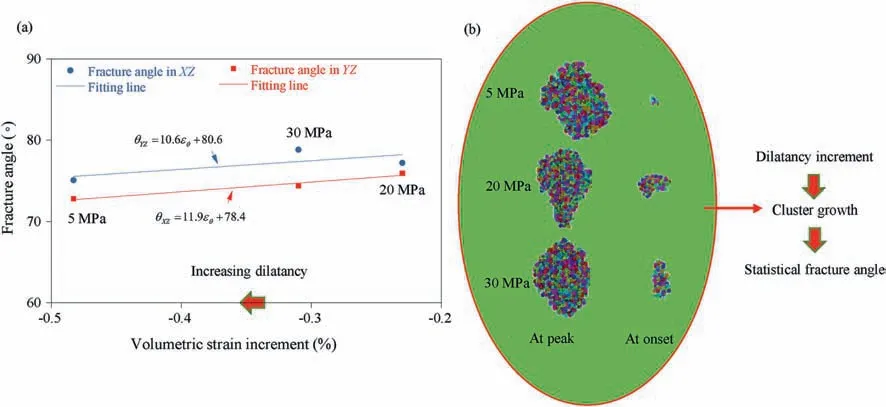
Fig.15. Illustration of(a)linear relationship between two dip angles and increment of volumetric strain and(b)evolution of cube clusters at confining pressures of 5 MPa,20 MPa and 30 MPa.
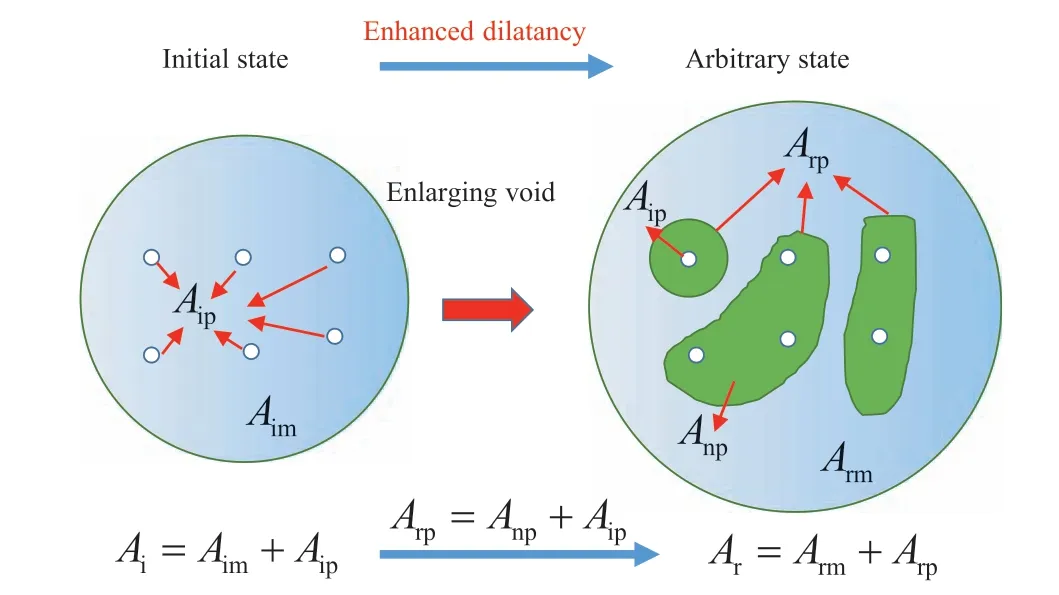
Fig.16. Schematic illustration of the damaged area.
To describe the dilatancy-induced damage evolution,Shao et al.(2006) proposed a damage driving force Fcdependent on the equivalent strain εceqdefined by
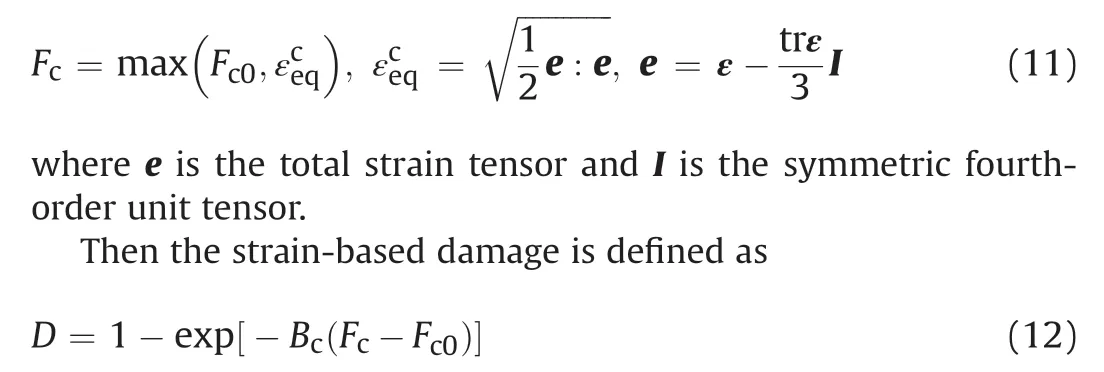
where Bccontrols the damage evolution rate and Fc0defines the initial damage threshold.
Here,the damage driving force is considered to be influenced by the dilatancy.Taking the volumetric strain increment Δεθ instead of equivalent strain εceq, the damage in Eq. (12) will be re-defined as

It is not an easy task to accurately determine the evolutional damage of a sample under triaxial compression. The greatest challenge is also an invisible fracture connection. Hence, the volumetric strain could be used to macroscopically represent the statistical damage, which is inappropriate to describe the local damage evolution. Hence, the comparison between dilatancybased and porosity-based damages does not aim at determining the best but providing an additional method to investigate the damage evolution.Unlike the statistical observation of whole-scale damage, the AE monitoring technology could be used to real-time reveal more local damages.
Fig.17 shows the comparison of damage evolution of the whole sample between two methods. The evolution of dilatancy-based damage shows a linear correlation with the increment of volumetric strain. On the contrary, the porosity-based damage nonlinearly increases with the volumetric strain increment. However,at the onset of dilatancy and peak stress, the initial and final damages tend to be consistent.Under confining pressure of 5 MPa,the damage difference between the two methods is large(Fig.17a),but when the confining pressure reaches 20 MPa and 30 MPa(Fig.17c), it quickly reduces. The non-negligible deviation of evolutional damage verifies the complexity of determining the failure process. Besides, there is a linear dependence of final damage on volumetric strain increment, which shows better sensitivity than the confining pressure. Three final damages corresponding to the confining pressures of 5 MPa,50 MPa and 30 MPa are calculated as 0.12,0.37 and 0.28,respectively.All are less than 0.4,which proves the deduction of the whole scale damage of rock samples less than 1.
Fig.18 shows the evolution of damage distribution along the Zaxis for three samples.Here,the layer damage refers to the porosity definition in Eq. (10). The central part of the sample is more damaged than the top and bottom. Besides, the increment of evolutional damage could be revealed by the color difference.It is hard to find a correlation of evolutional damage with the confining pressure. Nevertheless, the cube cluster model is effective in describing the whole scale damage as well as the local damage.
4.2. Verification of cube cluster to calculate fracture angle
The measurement of fracture angle faces many challenges such as the bendability of curved fracture and the interlaced fracture network. Due to its importance in rock engineering, it still makes sense to find out more options on calculation. Under triaxial compression, the fracture angle can be regarded as a dip angle descriptor.Taking the curved fracture as a smooth plane,there are many remarkable predictions of the fracture angle (e.g. Coulomb,1776; Mohr, 1882; Hoek, 1998; Hoek and Brown, 2019). Coulomb(1776) earlier proposed a definition of
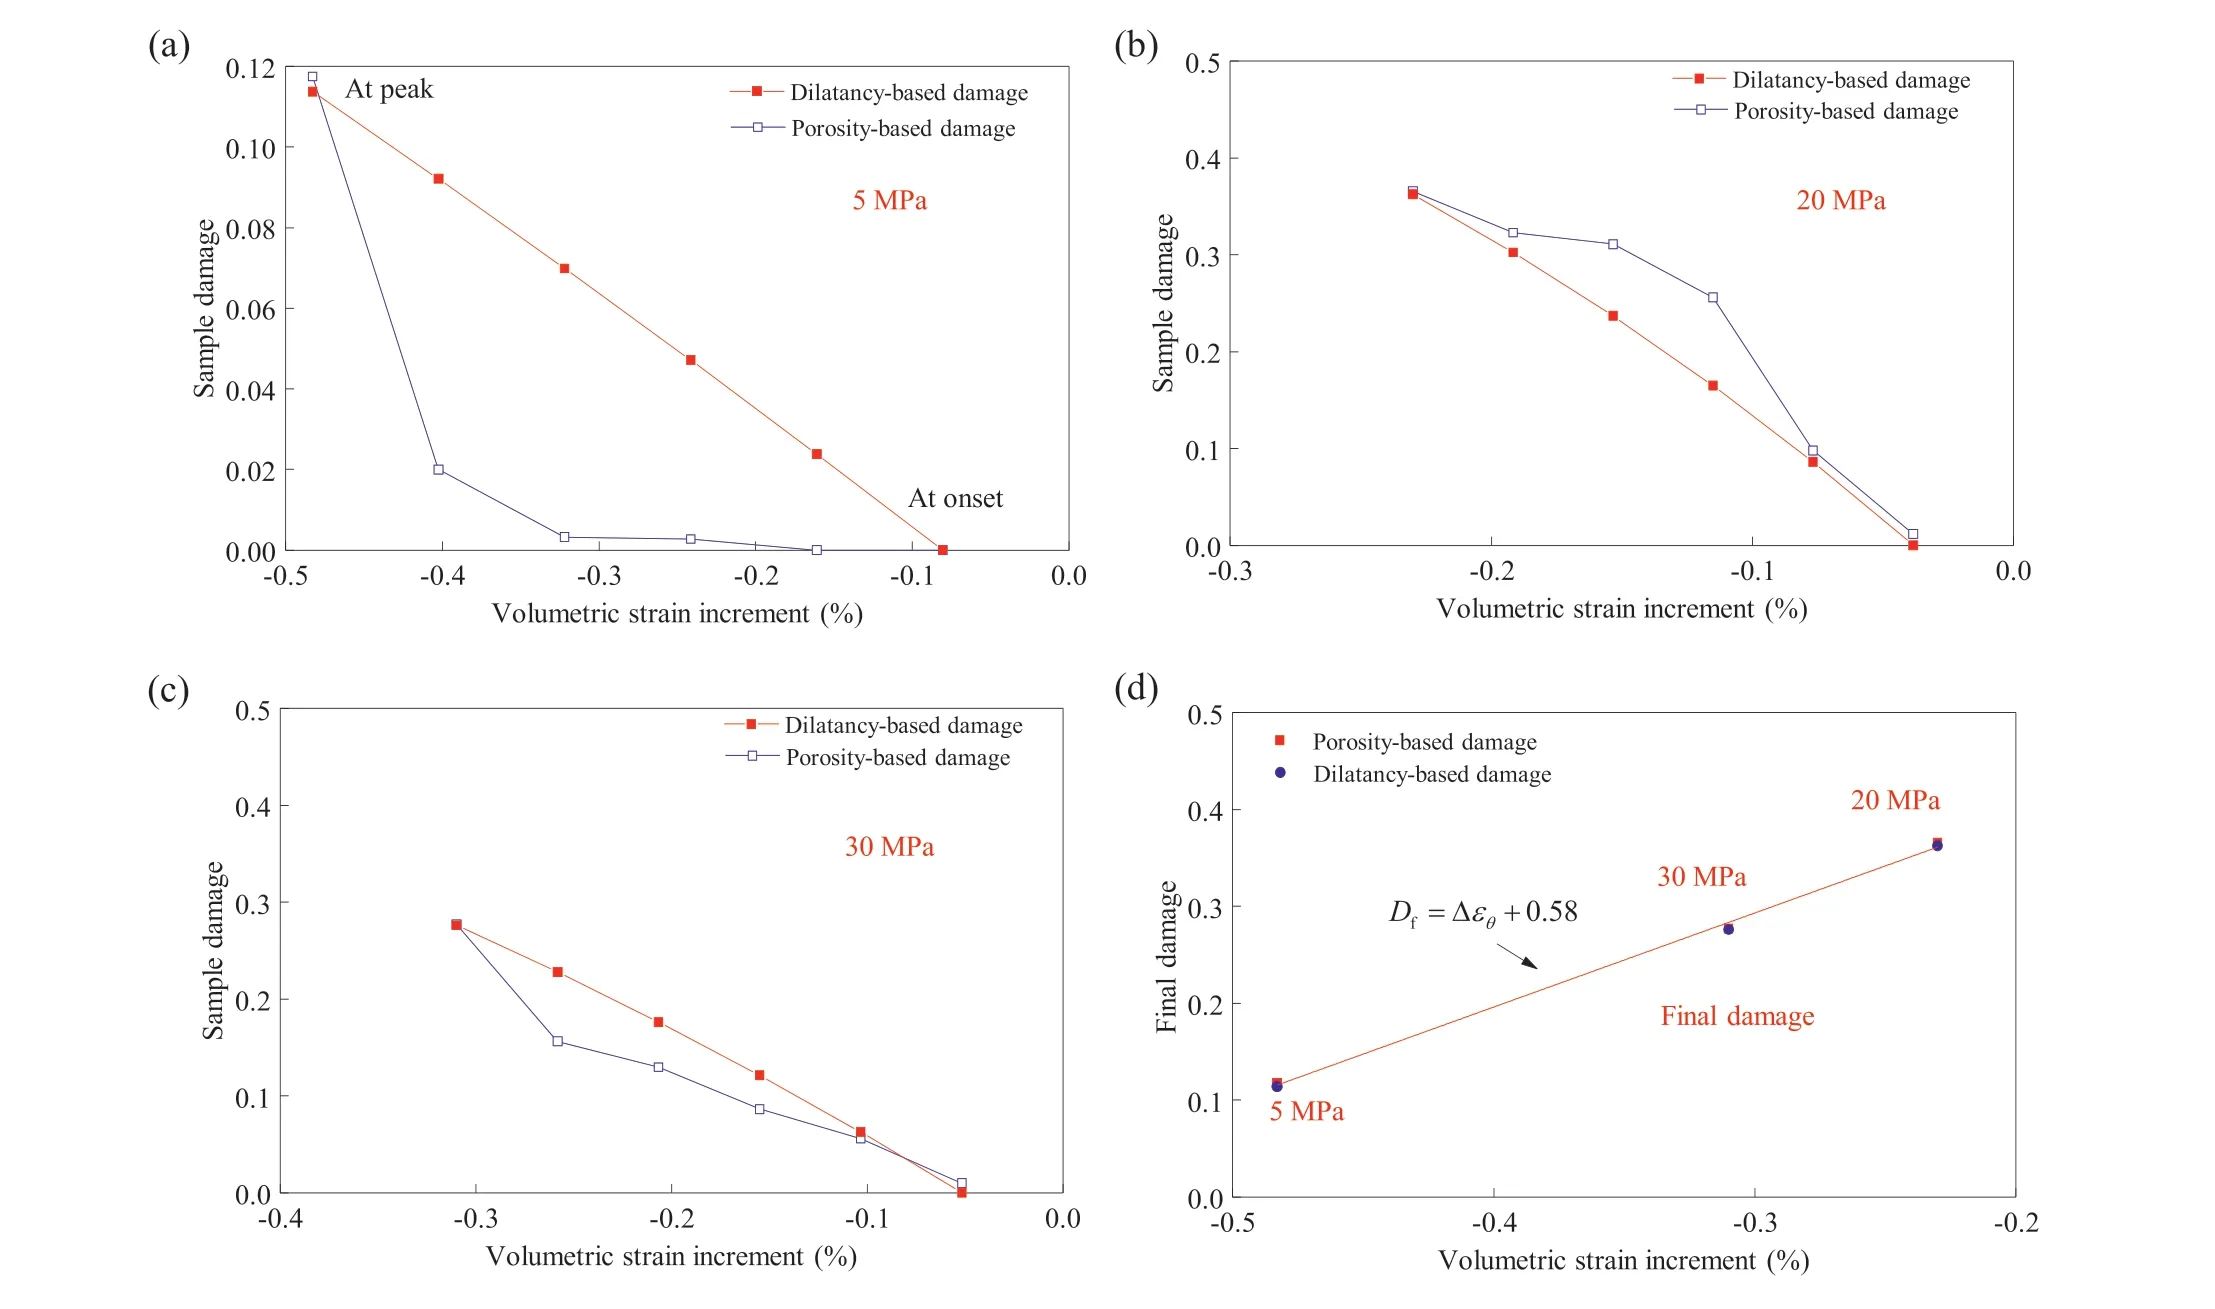
Fig.17. Damage evolution determined by dilatancy-based and porosity-based methods for three samples under confining pressures of(a)5 MPa,(b)20 MPa and(c)30 MPa,and(d)linear correlation of final damage at peak stress with the volumetric strain increment.

Unless the internal friction angle φ varies, the estimation from Coulomb (1776) only indicates a constant value. Indeed, the calculation of the internal friction angle needs to be based on a series of triaxial compression tests,which is inappropriate for a test sample. After, Mohr (1882) noticed such a problem and suggested an improved calculation by introducing the famous concept of Mohr’s circle:

If the envelope is described by a line connecting a series of Mohr’s circle, Eq. (15) will be reduced as the same as Eq. (14).However, according to Mohr’s suggestion of adopting a smooth curve to build the envelope,the fracture angle will be dynamically influenced by the tangent point from the adjacent Mohr circles.
Also, Hoek (1998) and Hoek and Brown (2019) proposed an empirical formula for describing the failure criterion:

where σ1and σ3are the maximum and minimum principal stresses, respectively; m indicates the rock softness with a suggested range of 0.001-25; s illustrates a broken level in a range of 0-1; and σcis the uniaxial compressive strength of the intact sample.
Taking the derivation on both sides of Eq. (16) by σ3, the envelope slope kHBis determined as
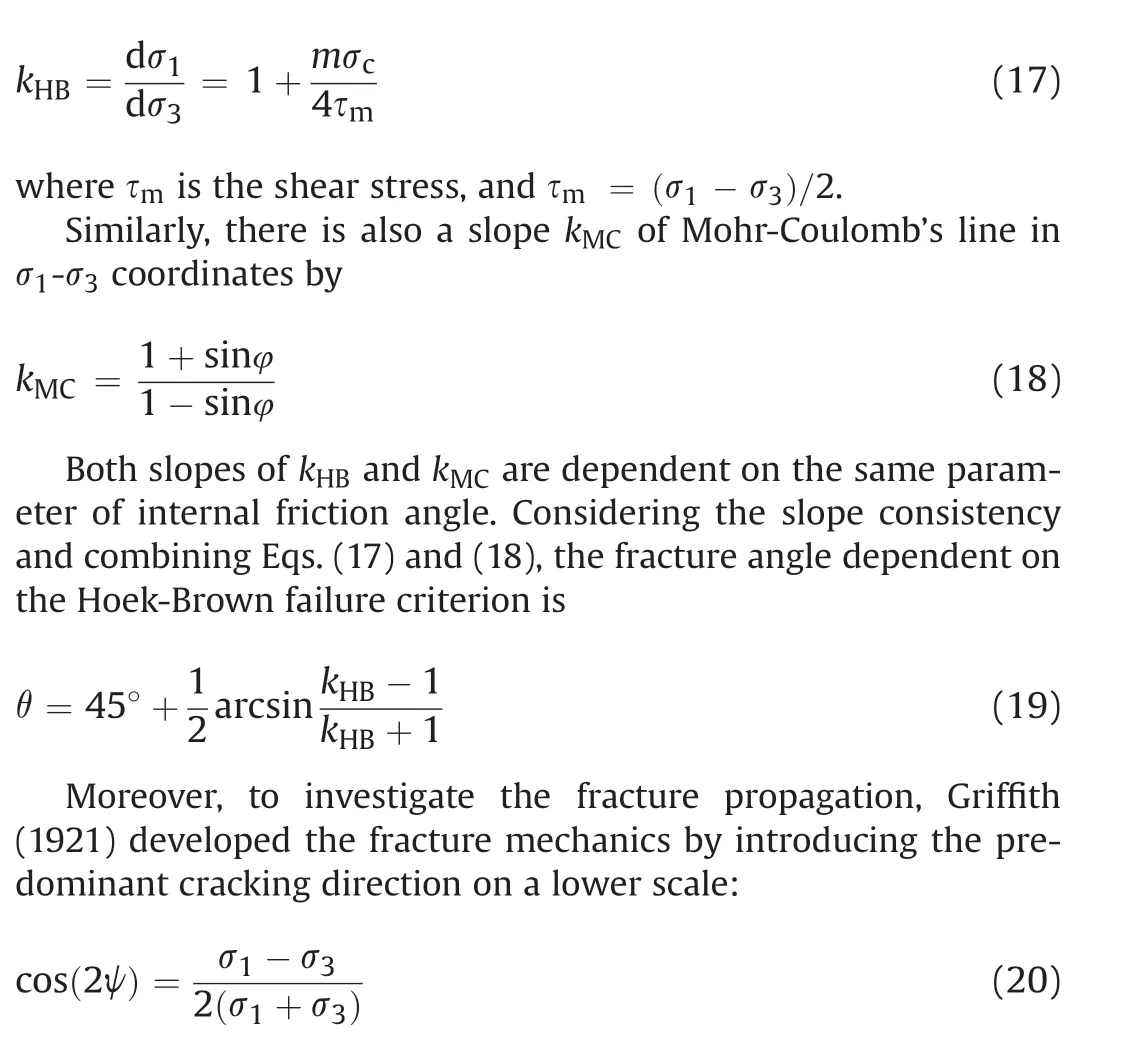
where ψ is the angle between maximum principal stress and cracking direction.
Hence, Griffith’s fracture angle can be calculated as

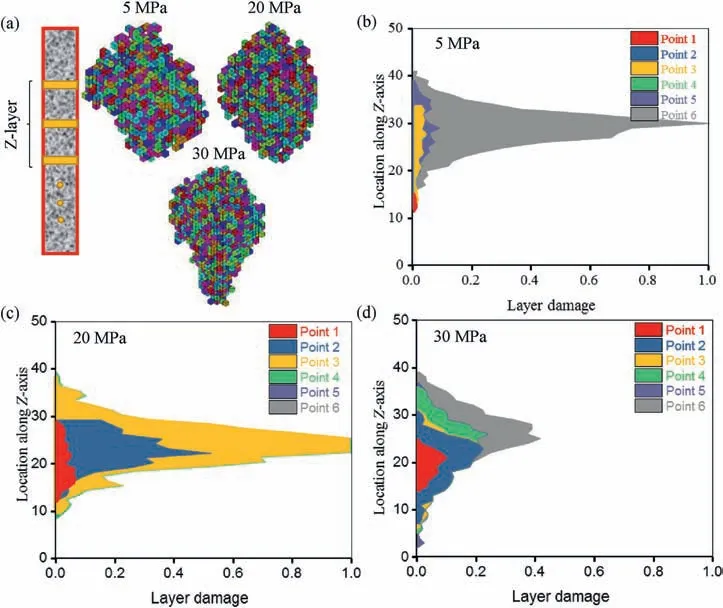
Fig.18. Evolution of damage distribution (a) along Z-axis by layer cluster for three samples under confining pressures of (b) 5 MPa, (c) 20 MPa and (d) 30 MPa. The unit for the vertical axis in (b)-(d) is in critical cube length.
By adopting a tangent line to connect a series of Mohr’s circles,the internal friction angle of granite is determined as 53.46°. By substituting this value into Eq.(14),the fracture angle suggested by Coulomb (1776) is determined as 71.73°, which is independent of the confining pressure. Similarly, by using Eq. (21), Griffith’s fracture angles under the confining pressures of 5 MPa, 20 MPa and 30 MPa are calculated as 59.31°,58.34°and 58.21°,respectively.The similar fracture angles indicate the insensitivity to the principal stresses of σ1and σ3. By comparing the Coulomb’s and Griffith’s fracture angles,there is a constant difference of about 12.5°.Such a large deviation could not be ignored but presents a huge complexity of predicting fracture angle (Fig.19a).
Considering the nonlinearity of the envelope, Mohr’s fracture angle is dependent on the varying internal friction angle and Hoek-Brown’s fracture angle is influenced by the changing correlation between σ1and σ3. Correspondingly, three fracture angles suggested by Mohr are calculated as 71°, 67.5°and 65°, as well as 72.66°,67.92°and 68.2°from the Hoek-Brown model(Fig.19b).The Mohr’s angle decreases with the increasing confining pressure,presenting a good monotonicity. However, Hoek-Brown’s solution shows a non-monotonic trend.Nevertheless,two kinds of fracture angle prediction are very close. The above four models are not obtained from theoretical solution but a deep observation of fracture propagation influenced by intrinsically physical property such as internal friction angle or external factors such as two principal stresses of σ1and σ3.
A good strategy to verify accuracy is to make a proper comparison between predicating values and measured fracture angles.Conventionally, the fracture angle is measured based on the fracture edge on the outer surface of the granite cylinder. Two assumptions including the ignorable curvature of the 3D rough surface and reasonable substitutability of taking line instead of curved edge need to be made (Fig. 19c). Through such simplification, three fracture angles are measured as 73.2°, 74.5°and 74°.Fig.18d shows the comparison of measured fracture angle and cluster-based statistics. Here, considering two conjugated shear fractures, the average cluster-based angles in Fig. 19d are taken from Fig. 14a. Although the proximity of two groups of fracture angles can verify the effective prediction by the cluster model, the result may not support the higher precision of the cluster model than the four empirical models.The most important reasons are the inaccuracy of measurement and non-ignorable fluctuation of evolutional fracture angle.
In general, there is a decreasing sequence of fracture angles obtained from cluster model,measurement,Coulomb(1776),Hoek(1998) and Hoek and Brown (2019), Mohr (1882) and Griffith(1921). In all the models, three maximum differences of fracture angles are 14.59°, 18.23°and 18.34°corresponding to confining pressures of 5 MPa, 20 MPa and 30 MPa, respectively. Taking the solution from Coulomb (1776) as a benchmark, three errors are calculated as 20.34%, 25.41% and 25.57%, respectively. Some ideal fractures satisfying plane assumption may support one of the models, but most fractures have a complex network presenting extreme complexity in geometry and huge difficulty in measurement.Formation of the fracture surface is a dynamic process,which indicates an evolution of fracture angle. On the one hand, the fracture angle may be influenced by external factors,such as stress on a large scale. On the other hand, it may be dominated by the intrinsic material property,such as internal friction angle on a local scale. Unlike the four empirical models (Coulomb, 1776; Mohr,1882; Griffith,1921; Hoek,1998; Hoek and Brown, 2019) focusing on the stress or internal friction angle,the cluster model is based on the spatial correlation of AE signal cloud.Similar to the real-time AE monitoring technology, the cluster model could also be used to dynamically measure the fracture angle.
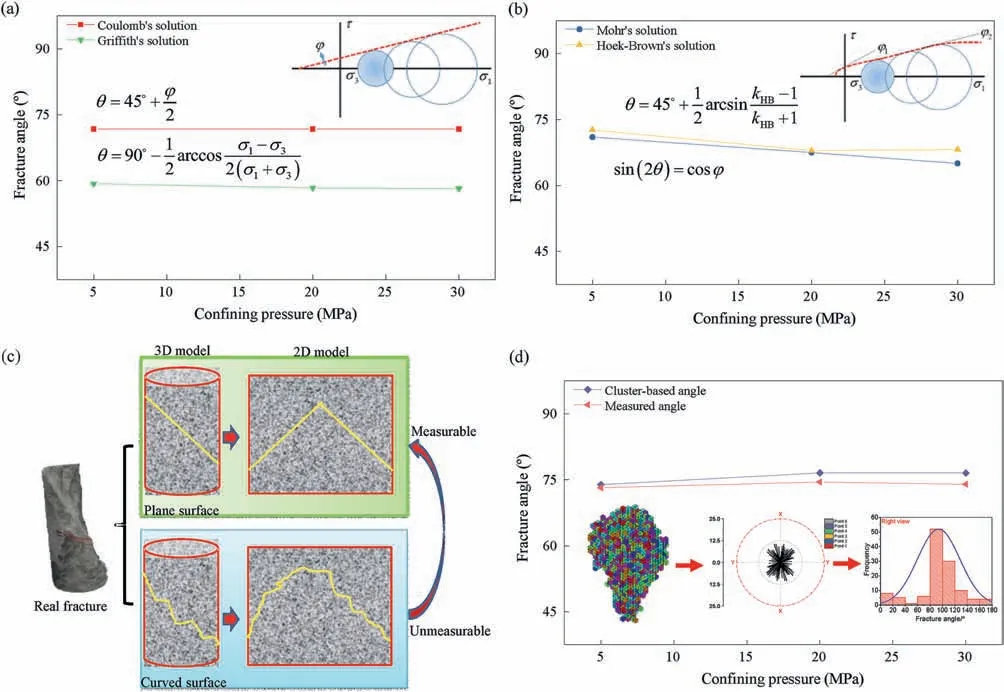
Fig.19. Comparison of fracture angle suggested by (a) Coulomb (1776) and Griffith (1921), (b) Mohr (1882) and Hoek and Brown (2019) as well as (c) an illustration of the ideal measurement for (d) the measured angle and cluster-based angle.
5. Conclusions
Aiming at correlating dilatancy behavior and fracture network under triaxial compression, the AE signal cloud is analyzed considering its spatial correlation. Three granite samples are used to carry out the triaxial compression tests under confining pressures of 5 MPa, 20 MPa and 30 MPa to collect the AE signals.The main conclusions are drawn as follows:
(1) A cube cluster approach is effectively established to describe the spatial correlation of randomly distributed AE signals.On this basis, the correlation analysis between dilatancy behavior and AE signal cloud is made.The description of the invisible fracture network is indirectly realized by the evolutional cube cluster. To make a quantitative analysis, two descriptors including three-axis length sum and pore fraction of cube clusters are introduced and both show a strong linear dependence on the dilatancy behavior. It verifies the sensitiveness of established cube cluster to the dilatancy behavior.
(2) The cube cluster model provides a new tool to calculate the evolutional damage under triaxial compression. Two calculations of damage are compared based on the increasing dilatancy and porosity from the cube cluster.Both show that there is a linear dependence of final damage on the increasing increment of volumetric strain. However, the deviation by two methods exists, proving the complexity of accurately calculating the evolutional damage.
(3) Based on the cube cluster approach,the prediction of fracture angle is feasible by modeling the spatial correlation of the evolutional AE signal cloud.For three granite samples under different confining pressures, the inside view of two dip angles shows a strong linear dependence on the volumetric strain increment. There is an obvious deviation of fracture angles predicted by four empirical models,which presents a huge difficulty in describing the curved fracture by a unique descriptor. The small differences of cluster-based and measured angles verify the effectiveness of using the cube cluster model to calculate the fracture angle.
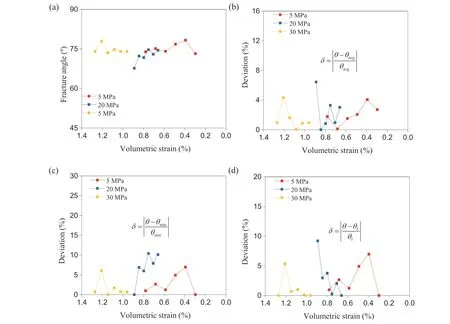
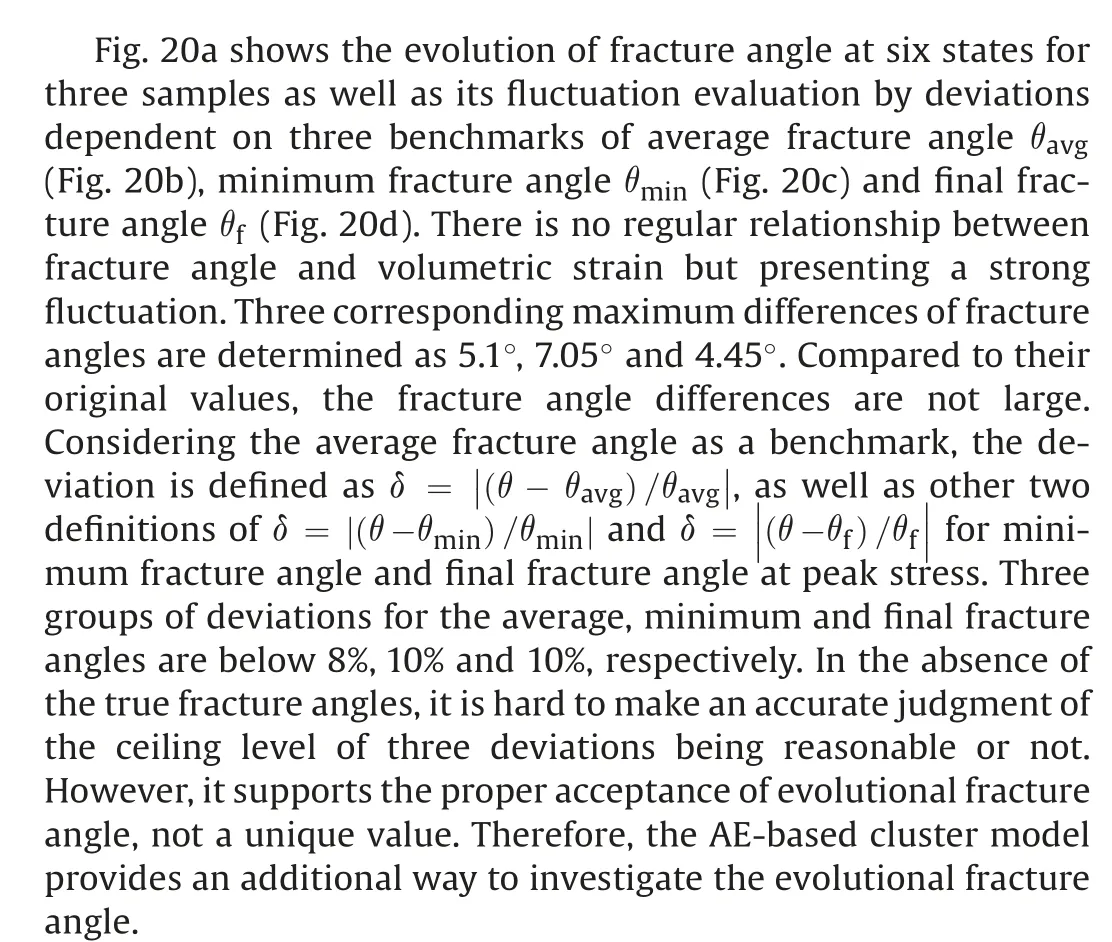
Fig.20. Evolution of(a)fracture angle with volumetric strain for three samples and the corresponding evaluation of deviation from benchmarks of(b)average,(c)minimum and(d)final fracture angles.
Declaration of competing interest
The authors declare that they have no known competing financial interests or personal relationships that could have appeared to influence the work reported in this paper.
Acknowledgments
This study was sponsored by the National Natural Science Foundation of China (Grant No. 51504257) and the Fundamental Research Funds for the Central Universities (Yueqi Outstanding Scholars) (Grant Nos.2018B051616 and 2021JCCXLJ01).
 Journal of Rock Mechanics and Geotechnical Engineering2021年5期
- Journal of Rock Mechanics and Geotechnical Engineering的其它文章
- Surface characteristics analysis of fractures induced by supercritical CO2 and water through three-dimensional scanning and scanning electron micrography
- Hysteresis in the ultrasonic parameters of saturated sandstone during freezing and thawing and correlations with unfrozen water content
- Coupled Eulerian-Lagrangian simulation of a modified direct shear apparatus for the measurement of residual shear strengths
- A novel true triaxial test system for microwave-induced fracturing of hard rocks
- Hydromechanical behavior of unsaturated expansive clay under repetitive loading
- Laboratory large-scale pullout investigation of a new reinforcement of composite geosynthetic strip
