Hysteresis in the ultrasonic parameters of saturated sandstone during freezing and thawing and correlations with unfrozen water content
Liu Yang, Hailiang Jia, Li Han, Huimei Zhang, Liyun Tang
College of Architecture and Civil Engineering, Xi’an University of Science and Technology, Xi’an, 710054, China
Keywords:Frozen porous rocks Ultrasonic parameters Hysteresis Freeze-thaw Nuclear magnetic resonance (NMR)Unfrozen water content
ABSTRACT Determining the mechanical properties of frozen rock is highly important in cold-area engineering.These properties are essentially correlated with the content of liquid water remaining in frozen rock.Therefore,accurate determination of unfrozen water content could allow rapid evaluation of mechanical properties of frozen rock. This paper investigates the hysteresis characteristics of ultrasonic waves applied to sandstone(in terms of the parameters of P-wave velocity,amplitude,dominant frequency and quality factor Q) and their relationships with unfrozen water content during the freeze-thaw process.Their correlations are analysed in terms of their potential for use as indicators of freezing state and unfrozen water content.The results show that:(1)During a freeze-thaw cycle,the ultrasonic parameters and unfrozen water content of sandstone have significant hysteresis with changes in temperature. (2)There are three clear stages of change during freezing: supercooled stage (0 °C to -2 °C), rapid freezing stage (-2 °C to -3 °C), and stable freezing stage (-3 °C to -20 °C). The changes in unfrozen water content and ultrasonic parameters with freezing temperature are inverse.(3)During a single freeze-thaw cycle,the ultrasonic parameters of sandstone are significantly correlated with its unfrozen water content,and this correlation is affected by the pore structure. For sandstones with mesopores greater than 50%,there are inflection points in the curves of ultrasonic parameters vs. unfrozen water content at -3 °C during freezing and at-1 °C during thawing.It was found that thermal deformation of the mineral-grain skeleton and variations in the phase composition of pore water change the propagation path of ultrasonic waves.The inflection point in the curve of dominant frequency vs.temperature clearly marks the end of the rapid freezing stage of pore water, in which more than 70% of the pore water freezes. Consequently,the dominant frequency can be used as an index to conveniently estimate the unfrozen water content of frozen rock and, hence, its mechanical properties.
1. Introduction
In high-latitude and high-elevation regions, bedrock is commonly subjected to freeze-thaw cycles at various temporospatial scales (Huang et al., 2020). Its mechanical properties are primarily determined by the freezing (or thawing) state and thus closely related to the unfrozen(or melting)water content inside(Jia et al., 2019, 2020a). Therefore, accurate and convenient determination of unfrozen water content (especially on the field) could allow fast evaluation of mechanical properties of rocks and further benefit design and construction of rock engineering in cold regions (Wang et al., 2021). This study investigates the variations in ultrasonic parameters and unfrozen water content in rocks during the freezethaw process. Their correlations are analysed and the possibility of using ultrasonic parameters as indicators of freezing (or thawing)state and unfrozen(or melting)water content in rocks is discussed.
Propagation of ultrasonic waves in rocks is sensitive to damage level of rock, water content in pores, and viscosity of pore fluid.Ultrasonic methods have been widely used to detect damage in porous materials such as soil(Kang and Lee,2015;Liu et al.,2020),rock (Martínez-Martínez et al., 2011) and concrete (Prassianakis and Prassianakis, 2014) due to the advantages of being nondestructive, rapid and simple. The S- and P-wave velocities of porous materials are usually reported to be negatively correlated with damage level (Martínez-Martínez et al., 2011; Kang and Lee,2015) and have long been employed to estimate the mechanical properties of rocks(Abdi et al.,2018;Rezaei et al.,2019;Zhang et al.,2021). Following the pioneering work by Biot (1956), who established theoretical formulae for wave velocity and attenuation in a homogeneous isotropic medium containing pore fluid, the correlation between water content (Amalokwu et al., 2014), fluid viscosity(Zhu et al.,2012;Clarke et al.,2020)and ultrasonic properties at room temperature has been well established and forms the basis for detecting the unfrozen water contents of soil and rocks at subzero temperatures (Sondergeld and Rai, 2007; Draebing and Krautblatter, 2012).
Researchers have also utilised ultrasonic methods to detect the mechanical properties of frozen soil or rock in cold regions. Wang et al. (2006) measured the ultrasonic wave velocities of frozen sand, loess and clay at different temperatures, and used them to calculate the dynamic elastic parameters of the samples.Draebing and Krautblatter(2012)measured the P-wave velocity increases in low-porosity rocks during freezing and thawing and evaluated increases in matrix velocity due to ice pressure. Huang et al. (2013)studied the influences of temperature and water content on the ultrasonic wave velocity, concluding that the ultrasonic wave velocity increases with water content. Sudakova and Vladow (2019)experimentally studied the acoustic properties of water-saturated sand in a temperature range of -20°C to 20°C. Liu et al. (2020)measured S- and P-wave velocities in loess under freeze-thaw cycles and established an exponential relationship between S-and Pwave velocities and uniaxial compressive strength.While the above studies are informative,a definitive correlation between ultrasonic properties and unfrozen water content has not been established,which hinders the use of ultrasonic parameters as indicators of the freezing state of rocks (i.e. their frozen strength).
In this study, the ultrasonic parameters of P-wave velocity,amplitude and dominant frequency were tested in four sandstone samples with different pore structures during single freeze-thaw cycle. Changes in unfrozen water content were measured via nuclear magnetic resonance (NMR). We investigated (1) hysteresis changes in ultrasonic parameters and unfrozen water content during the freeze-thaw process; (2) correlations between ultrasonic characteristics and unfrozen water content; (3) the microscopic mechanism behind these correlations;and(4)the possibility of using ultrasonic parameters as indices of the freezing (or thawing) state and unfrozen(or melting) water content of rock.
2. Principles of the tests
2.1. Principles of ultrasonic testing
2.1.1. Fast Fourier transform
Fast Fourier transform (FFT) is a common digital signalprocessing technique that can transform a time-domain signal into a frequency-domain signal. It can further analyse the frequency-domain characteristics of the signal and of the system under test so that a problem that is not apparent in the time domain can be observed in the frequency domain(Lee et al.,2012).
FFT can identify the frequency distribution of a received wave in the time domain f(t) and decompose it into frequency spectra of different frequencies. Therefore, it can reveal changes in the ultrasonic frequency of the signal throughout the time domain. Its equation is as follows:

where F(ω) is the function of Fourier transform in the time domainf(t), i is the square root of -1, and ω is the angular frequency.
It has been found that different-propagating media absorb elastic waves of different frequencies (Santos et al., 2010). This paper used FFT to convert a received time-domain signal into a frequency-domain signal. By analysing changes in the dominant frequency caused by changes in unfrozen water content at different temperatures during freeze-thaw cycle, we can reveal the mechanism that the acoustic properties of rock samples vary at different freezing temperatures.
2.1.2. Wavelet transform
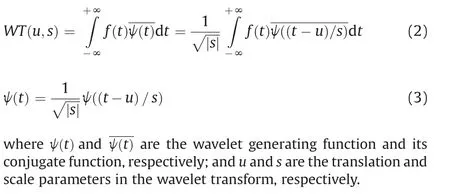
Grossmann and Morlet (1984) reported that wavelet transform can identify the time-frequency characteristics of a measured signal in the time domain f(t) (Lee et al., 2012). The idea of wavelet analysis comes from the expansion and translation method,which is a time-frequency localisation analysis method in which both the time and frequency windows can be varied. In this case, we use a fixed window size with a variable shape. This allows the time resolution to increase with the signal frequency,which is known as a“mathematical microscope”.The wavelet transformation of a signal f(t) is expressed as
2.1.3. Quality factor Q
Attenuation is represented by the quality factor Q or its reciprocal,Q-1.The value of Q in rock reflects the energy loss occurring during the period in which an elastic wave propagates through the rock.The higher the Q-value,the lower the energy loss(Mavko and Nur,1979). The relationship between Q and the attenuation coefficient α is as follows:

where f is the frequency of a wave with velocity v,and Q-1is related to the wave’s energy loss during propagation. To approximate attenuation in terms of changes in amplitude A, we express it by parameters directly related to A:

where A0and A are the amplitudes of standard and measured samples, respectively; α0and α are their attenuation coefficients;and L is the length of the measured sample.
2.2. Principles of nuclear magnetic resonance testing
Before an NMR test,the hydrogen(H)protons in the pore water of a rock sample are arranged in random orientations. When the rock sample is put into the instrument, these protons are magnetised by its magnetic field. Then, the emission of alternating electromagnetic fields causes these polarised protons to flip from their new equilibrium position. After the alternating magnetic field is removed, these protons return to their original equilibrium positions in a process called relaxation. Generally, we judge change in the pore water of rock and soil by measuring its relaxation time T2,which is the transverse relaxation time of a proton in water. The transverse magnetisation vector intensity is the signal intensity measured during NMR scanning, which is proportional to the number of protons(i.e. water content).
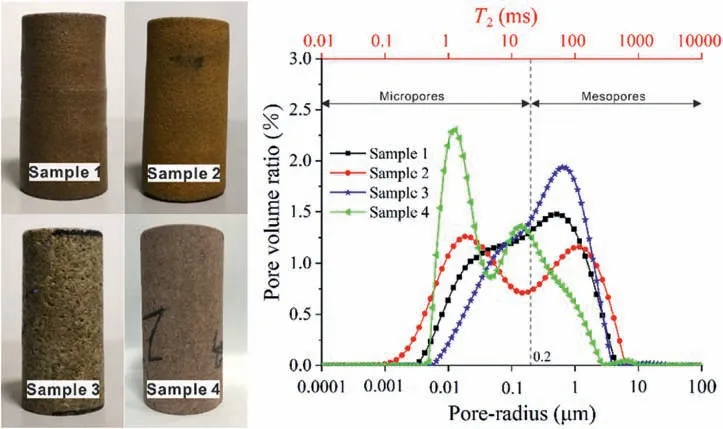
Fig.1. Test samples (left) and their pore size distributions and T2 spectra (right).
2.2.1. Measurement of the pore structure of rocks
The transverse relaxation time of pore water varies according to the pore diameter.Therefore,the pore size distribution of a rock can be calculated according to its T2spectrum(Jia et al.,2020b),which is related to the geometric parameters of the pores as follows:

where ρ2is the transverse surface relaxation rate, which is constant, and ρ2= 5μm/s; Spis the pore surface area; and Vpis the pore volume. By introducing the concept of average pore size, Eq.(6) can be expressed as

where FSis a geometric factor (FS= 3 for spherical pores, and FS= 2 for columnar pores), and FS= 2 in this study; and rCis the average radius. According to Eq. (7), there is a one-to-one correspondence between T2and pore size.
2.2.2. Measurement of unfrozen water content
At low magnetic fields, an NMR signal from ice is barely detectable (Zhao et al., 2017). Instead, free induction decay (FID)signals can be used to measure the unfrozen water content of frozen rocks (Tice et al., 1981; Watanabe and Wake, 2009). The unfrozen water content of each sample was calculated using the following equation:

where Swis the normalised unfrozen water content of a sample;FIDfrozenis the FID value of the sample frozen at -20°C after temperature correction; and FIDsaturatedis the FID value of the sample totally saturated at room temperature.
3. Experimental design
3.1. Sample preparation
In this study, four cylindrical samples with the size of 50 mm × 100 mm (diameter × height) were prepared: (1) red medium-grained sandstone,(2)yellow medium-grained sandstone,(3)grey-white coarse-grained sandstone,and(4)purple-red argillaceous siltstone (Fig.1). The porosities of samples 1-4 were 14.42%,18.26%,13.72%,and 12.12%,respectively.The pore size distribution of the rocks(Fig.1)can be calculated according to their NMR T2spectra(Eq.(7)).BasedontherockporesizeclassificationproposedbyJiaetal.(2021), pores with apertures less than 0.1 μm are classified as micropores, those with apertures between 0.1 μm and 1000 μm are mesopores,and those with apertures larger than 1000 μm are macropores.The pore size distribution of the rock samples is illustrated in Table 1.
The samples were prepared as follows: (1) Oven-drying at 105°C for 24 h. After drying for 12 h,18 h and 24 h, respectively,their mass was measured. The mass did not change after 18 h, at which time the samples were considered to have attained their dry mass md.(2)Vacuum saturation.Samples were placed in a vacuum chamber at-1 bar(1 bar=100 kPa)for 4 h,and then immersed in water for 72 h to achieve complete saturation with a saturated mass ms. Samples were then wrapped in plastic film until the experiment.The effective porosity of the sample is calculated as follows:

where P is the effective porosity of the rock, and V is its volume.

Table 1 Pore structure of each rock sample.
3.2. Experimental design
3.2.1. Measurement of ultrasonic parameters during freeze-thaw
Changes in the ultrasonic parameter were measured with an M-4A non-metal ultrasonic tester(Fig.2a)with the following settings:range = 100 mm, zero sound = 6.2 μs, sampling period = 0.1 μs,emitted voltage = 500 V, window length = 4096, and sampling length=1024.Ultrasonic tests were performed on four completely saturated samples at temperatures of 20°C, 1°C,0°C,-1°C,-2°C,-3°C,-4°C,-5°C,-6°C,-8°C,-10°C,-15°C and-20°C.To study the hysteresis of the unfrozen water content at a given temperature during freeze-thaw cycle, the temperature regime of the thawing process was opposite to that used for freezing.
The four fully saturated samples were wrapped with clingfilm.Before freezing, their ultrasonic parameters at room temperature(20°C) were tested, and then the rock samples were put into an environmental chamber(Fig.2b)and its temperature was adjusted to each of the test temperatures in turn and maintained for 4 h.Subsequently, the samples were taken out of the environmental chamber and tested with ultrasonic waves. The duration of each test was less than 30 s.3.2.2. Measurement of unfrozen water content during freeze-thaw
Changes in unfrozen water content were measured with an NMR low-temperature pore analyser(macroMR12-150H-I;Fig.2c)with the following settings: P1=16 μs, P2= 32 μs, TD = 440,034,TW = 1000 ms, TE = 0.44 ms, SW = 200 kHz, RFD = 0.01 ms,RG1=10 db,DRG1=3,DR =1,and NS= 8.The test temperatures were consistent with those in the ultrasonic tests and each temperature was maintained for 4 h.Then,the samples were taken out of the environmental chamber and NMR signals were collected.The duration of each test was 30-60 s and the T2distributions obtained by inversion and NMR signals were recorded. During this period,the samples were placed in the environmental chamber for temperature stabilization.
4. Results
4.1. Changes in acoustic characteristics during freeze-thaw
4.1.1. Variation in waveforms
Variations in the four rock samples’waveforms at temperatures above-20°C are shown in Fig.3.At temperatures above-2°C,the waveforms were essentially the same at each temperature; therefore,changes in both the attenuation of the received waves and the arrival time of the first wave were not obvious. At temperatures of -2°C to -3°C, the waveform pattern changed remarkably and the attenuation of the received waves at -3°C was less than that at-2°C;moreover,the first wave at-3°C arrived earlier than that at -2°C. At temperatures of -3°C to -20°C, the waveform and change of received wave attenuation were not obvious, and the arrival time of the first wave was basically unchanged.
4.1.2. Variation in P-wave velocity
Curves of P-wave velocity versus temperature in a single freezethaw cycle are shown in Fig.4.It can be seen that change in the Pwave velocity with temperature during thawing lagged behind that during freezing, i.e. distinct hysteresis existed during thawing and thawing.
There were three distinct stages of change in P-wave velocity with temperature during freezing and thawing.Taking the freezing process as an example,with decreasing temperature,the variation in P-wave velocity presented three stages: slight increase, rapid increase, and stabilisation stages. At temperatures higher than -2°C, the P-wave velocity was basically unchanged or increased slightly. At temperatures between -2°C and -3°C, it increased sharply.At temperatures of-3°C to-20°C,the P-wave velocities of samples 1-3 gradually became stable, while that of sample 4 increased gradually and then remained stable.In addition,samples 1 and 3 showed small decreases at the temperatures of 1°C to-1°C, while samples 2 and 4 showed slight increases.
4.1.3. Variation in amplitude
Within a single freeze-thaw cycle, variation in amplitude with temperature had obvious hysteresis as well(Fig.5).In the freezing process, the amplitude presented three stages as the temperature decreased. At temperatures above -2°C, the amplitude increased gradually as the temperature decreased. At temperatures between -2°C and -3°C, the amplitude increased sharply. With further decreases in temperature from -3°C to -20°C, the amplitude fluctuated significantly and peaked between -3°C and -4°C. During thawing, the amplitude also presented three stages with increasing temperature: it first fluctuated and decreased, then decreased abruptly and, finally, stabilised. The amplitude in the rock after complete thawing was lower than that before freezing.
4.1.4. Variation in dominant frequency
During a freeze-thaw cycle, variation in dominant frequency with temperature also presented obvious hysteresis in the shape of a parallelogram (Fig. 6). In a freeze-thaw cycle, variation of the dominant frequency also followed a three-stage mode with temperature. In samples 1-3, during freezing at temperatures above -2°C, the dominant frequency increased slightly with decreases in temperature.At temperatures between-2°C and-3°C,it increased sharply, while at temperatures of -3°C to -20°C, it was basically unchanged. In sample 4, at temperatures higher than -1°C, the dominant frequency was almost unchanged with decreases in temperature. At temperatures of -1°C to -2°C, the dominant frequency surged and, at temperatures of -2°C to-20°C,it fluctuated significantly with decreases in temperature.Moreover, after samples 1-3 had melted completely, their dominant frequencies were basically the same as that before freezing,while that of sample 4 was quite different.
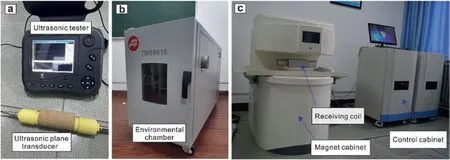
Fig. 2. Experimental equipment: (a) Ultrasonic tester, (b) environmental chamber, and (c) NMR instrument.
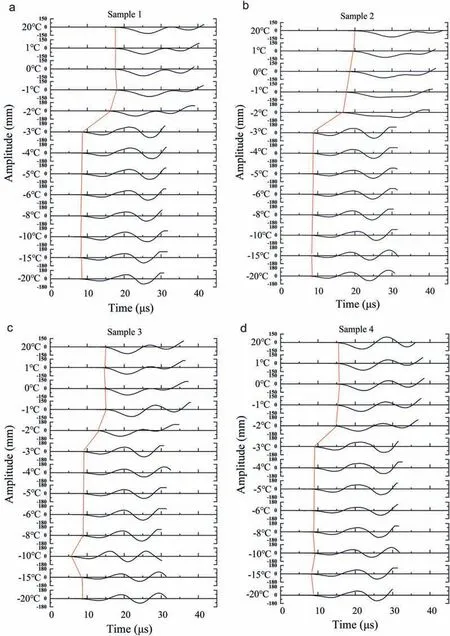
Fig. 3. Temperature contrast diagrams of P-wave waveforms in the four samples.
Fig. 7 shows the frequency weighting curves for the four samples obtained according to FFT and wavelet transform.Wavelet transform has the characteristic of multi-resolution analysis, which can remove high-frequency noise from a signal.In this study, the wavelet basis of sym8 was selected to conduct three-layer wavelet decomposition of the transmitted and received wave signals at temperatures of 20°C,-3°C and-20°C(Mallat, 1989; Grubb and Walden, 1997). FFT reconstructs lowfrequency signals with high-frequency noise being removed (Lee et al., 2012). The proportion of each frequency can be calculated based on the amplitude of different frequencies. The peaks of the frequency weighting curves gradually shifted to the right with decreases in temperature.
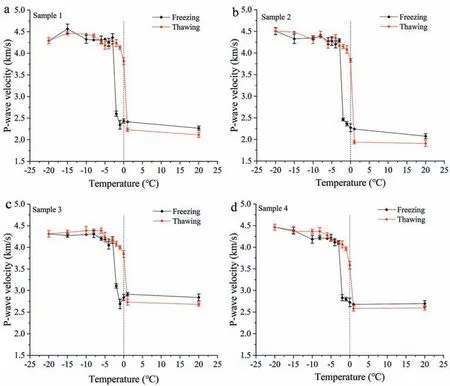
Fig. 4. Variations in P-wave velocity with temperature in the four samples.
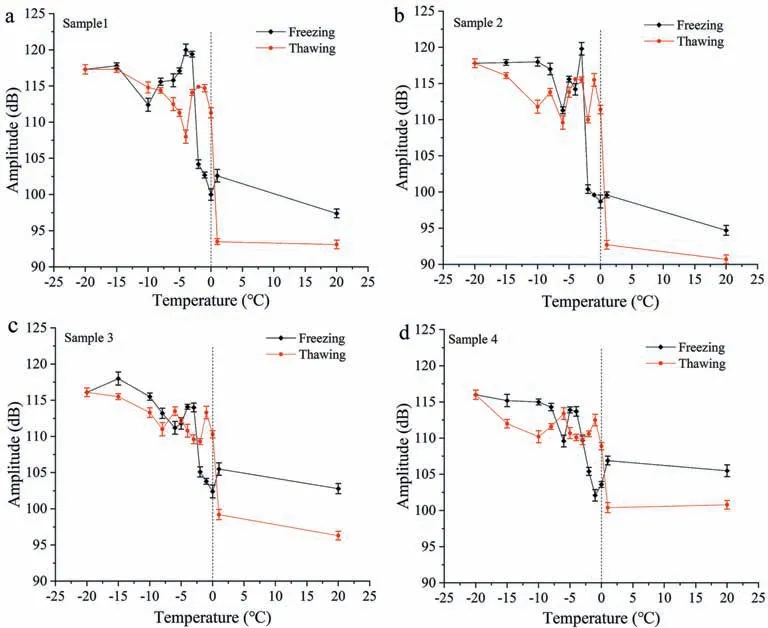
Fig. 5. Variations in amplitude with temperature in the four samples.
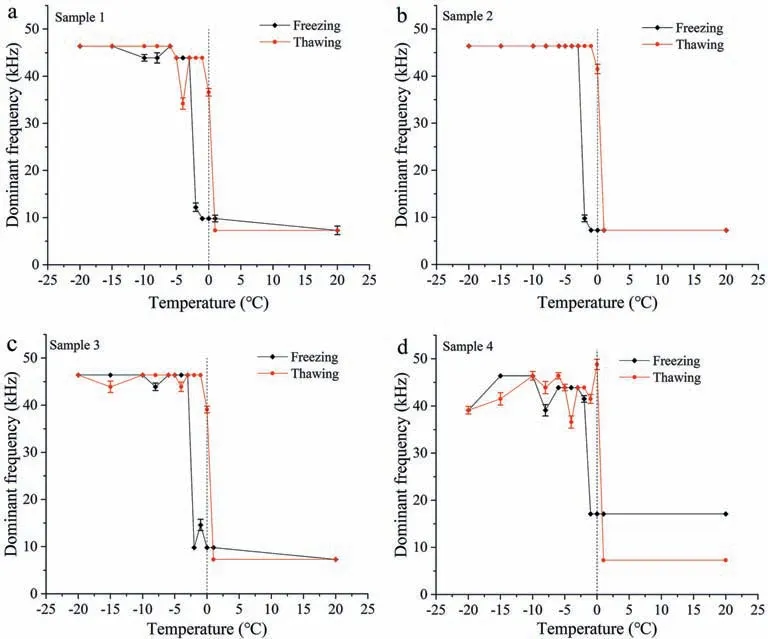
Fig. 6. Variations in dominant frequency with temperature in the four samples.
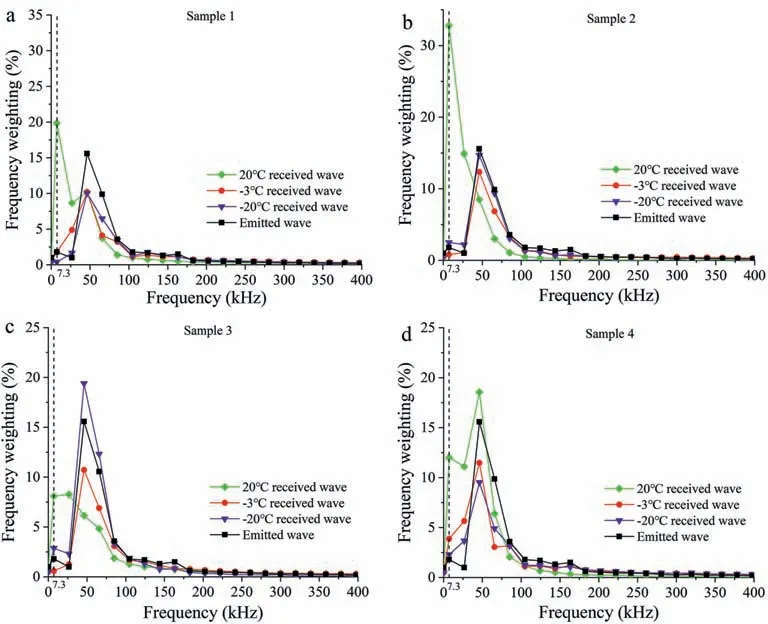
Fig. 7. Frequency weighting curves at various temperatures for the four samples.
4.2. Variation in quality factor Q during freeze-thaw
The quality factor Q, or its reciprocal Q-1, can be used to represent the attenuation of elastic waves during propagation.The value of Q-1can be calculated by Eqs. (4) and (5) to obtain the variation in Q with temperature.
Within a single freeze-thaw cycle, the variation in Q with temperature during freezing did not coincide with that during thawing(Fig. 8). During the freezing process, the variation in Q with decreasing temperature exhibited three stages. In samples 1-3 at temperatures above -2°C, Q increased slightly as temperature decreased.At temperatures between-2°C and-3°C,Q increased sharply. As the temperature continued to decrease from -3°C to -20°C, Q fluctuated significantly, with a peak at around -4°C and a valley at around -8°C. In sample 4 at temperatures higher than -1°C, Q tended to decrease slightly with decreases in temperature.At temperatures of-1°C to-2°C,Q increased sharply.At temperatures of -2°C to -20°C, Q fluctuated significantly with decreases in temperature, with a peak near 2°C and a valley near -6°C.
During the thawing process, although being hysteretic, the quality factor Q presented three stages as well.As the temperature increased, Q fluctuated and decreased first, followed by an abrupt decrease, and finally stabilised. In addition, the values of Q for samples 1-3 were basically the same before freezing and after complete thawing,while in sample 4,Q was significantly different.
4.3. Variation in unfrozen water content during freeze-thaw
Fig. 9 shows the relationship between the unfrozen water content of sandstone and temperature during a freeze-thaw cycle.In a single cycle, variation in the unfrozen water content exhibited remarkable hysteresis as in the ultrasonic parameters (Fig. 9).
The hysteretic loops on curves of unfrozen water content vs temperature for samples 1-3 were similar and generally had parallelogram shapes. In the freezing process, at temperatures between 0°C and -2°C, supercooling occurred, where the unfrozen water content reduced slowly with decreases in temperature. At temperatures of-2°C to-4°C,a large amount of pore water froze and the unfrozen water content dropped rapidly. The unfrozen water content only changed slightly with decreases in temperature below-4°C.At-20°C,the unfrozen water contents of samples 1-3 were 3.91%, 3.1% and 6.26%, respectively. During thawing, at temperatures below 0°C,pore ice melted gradually with increases in temperature. At temperatures between 0°C and 1°C, pore ice melted rapidly.
The hysteresis loop of sample 4 was sickle-shaped. In the freezing process, at temperatures between 0°C and -1°C, there was a supercooling phenomenon.At-1°C to-3°C,a large amount of pore water froze and the unfrozen water content dropped rapidly. At temperatures of -3°C to -20°C, the unfrozen water content decreased gradually with temperature. At -20°C, the unfrozen water content of sample 4 was 3.91%. During thawing at temperatures below 0°C, the unfrozen water content gradually increased to about 50%.At temperatures between 0°C and 1°C,the rest of the pore ice melted rapidly.
4.4. Correlations between ultrasonic parameters and unfrozen water content
Figs.10-13 indicate that ultrasonic parameters(P-wave velocity,dominant frequency, amplitude and Q) had strong correlations with unfrozen water content during the rapid freezing (0°C to -3°C) and thawing (-1°C to 0°C) stages. These correlations were relatively weak within other temperature intervals.4.4.1. Correlations between P-wave velocity and unfrozen water content
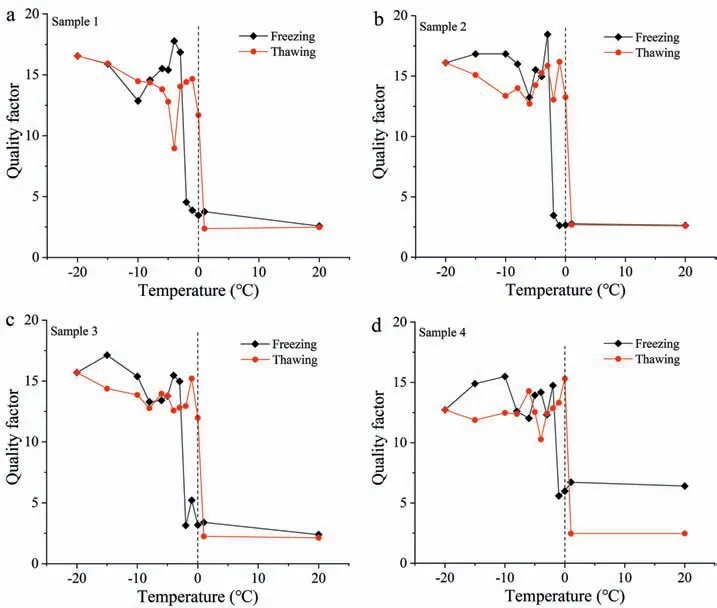
Fig. 8. Variations in quality factor Q with temperature in the four samples.

Fig. 9. Variations in unfrozen water content with temperature in the four samples.
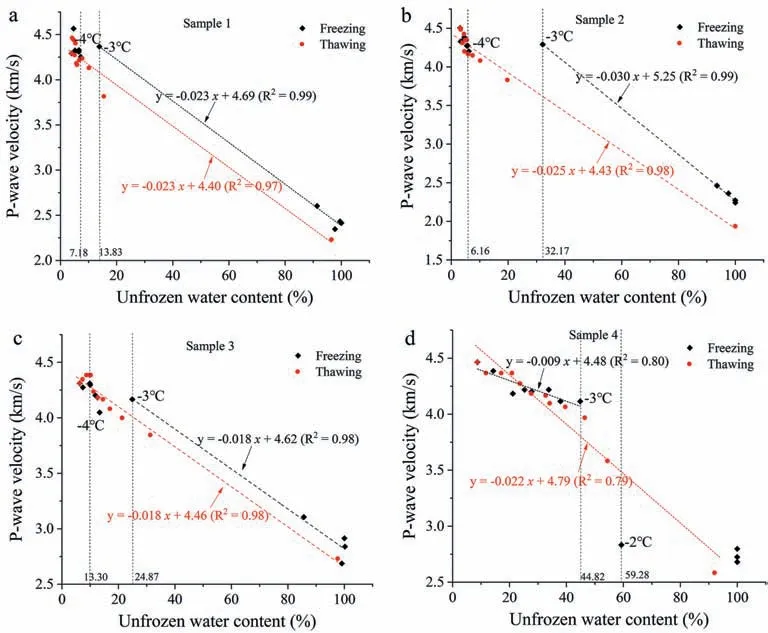
Fig.10. Relationships between unfrozen water content and P-wave velocity in the four samples.
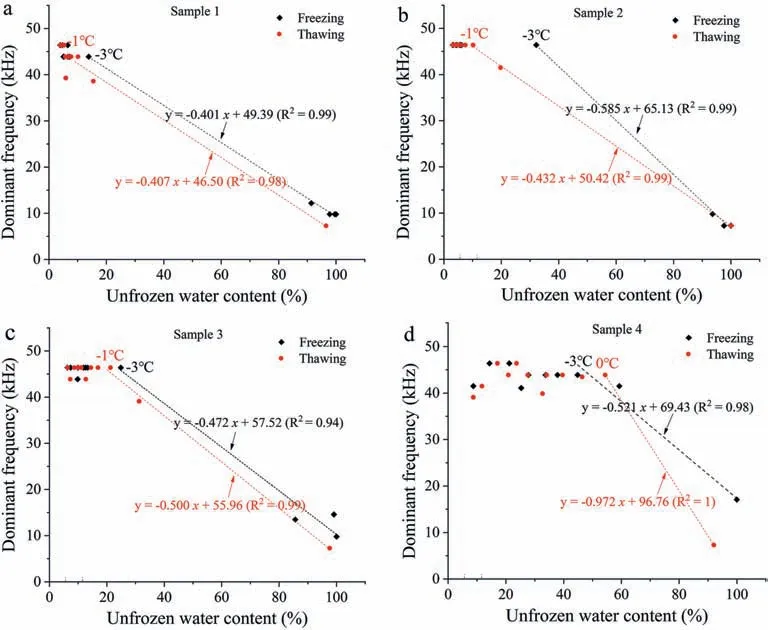
Fig.11. Relationships between unfrozen water content and dominant frequency in the four samples.
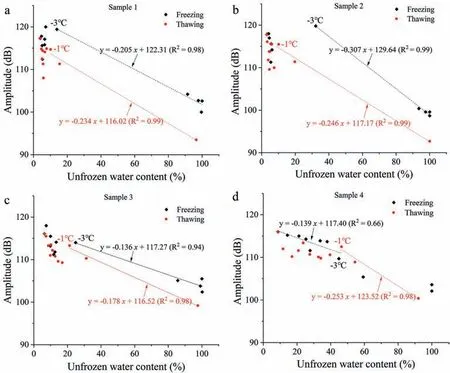
Fig.12. Relationships between amplitude and unfrozen water content in the four samples.
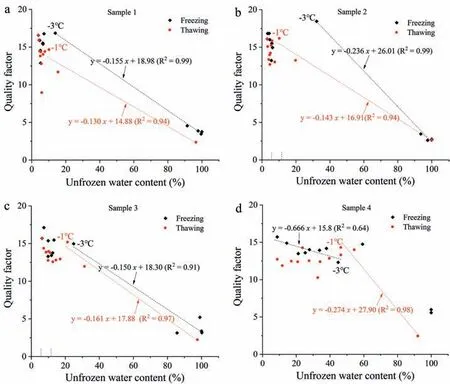
Fig.13. Relationships between quality factor Q and unfrozen water content in the four samples.
The correlation between P-wave velocity and unfrozen water content during freezing was different from that during thawing.During the freezing process in samples 1-3 (sandstone with mesopores greater than 50%,Table 1),the relationship between P-wave velocity and unfrozen water content could be divided into three stages.At temperatures above-3°C,i.e.at the rapid freezing stage,the P-wave velocity increased linearly with decreases in unfrozen water content, indicating a strong correlation between them(Fig.10a-c).At temperatures of-3°C to-4°C,the P-wave velocity remained unchanged or reduced slightly with decreases in unfrozen water content. At temperatures below -4°C, the P-wave velocity generally increased with decreases in unfrozen water content. As can be seen in Fig.10a-c, -3°C was a clear inflection point of the variation in P-wave velocity with decreasing temperature, which marks the end of the rapid freezing stage of pore water. However, in sample 4 (sandstone with mesopores less than 50%, Table 1), the P-wave velocity had a strongly negative linear correlation with temperatures below -3°C, i.e. at the stable freezing stage (Fig.10d).
During the thawing process in all four samples, the P-wave velocity decreased linearly with increases in unfrozen water content,rather than at the distinct stages observed during the freezing process (Fig.10a-d).
4.4.2. Correlation between the dominant frequency and unfrozen water content
The relationship between the dominant frequency and unfrozen water content only had two stages during both freezing and thawing(Fig.11).In the process of freezing,the dominant frequency increased linearly with decreases in unfrozen water content at temperatures above -3°C, where rapid freezing of pore water ended (Fig. 9). Meanwhile, at temperatures below -3°C, the dominant frequency no longer had a clear correlation with unfrozen water content.In the thawing process,however,the dominant frequency decreased linearly with increases in unfrozen water content at temperatures higher than -1°C, which is the starting point of the rapid thawing stage (Fig. 9). At temperatures below -1°C, the dominant frequency no longer had a clear correlation with unfrozen water content.
It can be seen from the above analysis that variation in the dominant frequency can clearly indicate the end of rapid freezing of pore water and the initiation of rapid thawing of pore ice.
4.4.3. Correlations between amplitude, Q and unfrozen water content
Similar to P-wave velocity, the amplitude and Q-values of samples 1-3(sandstone with mesopores greater than 50%,Table 1)had almost linear correlations with unfrozen water content at temperatures higher than -3°C during freezing. The correlations were weak at other temperatures(Figs.12 and 13).However,as for sample 4 (sandstone with mesopores less than 50%, Table 1), the amplitude and Q had a strongly negative linear correlation with temperatures below-3°C(Figs.12 and 13).Meanwhile,during the rapid thawing process in all four samples (above -1°C), the amplitude and Q decreased linearly with increases in unfrozen water content(Figs.12 and 13).
To conclude, the temperature of -3°C was a clear inflection point of the variation in ultrasonic parameters with decreasing temperature,and marks the end of the rapid freezing of pore water.The temperature of -1°C was another inflection point indicating the start of the rapid thawing of pore ice during temperature rise.Among the ultrasonic parameters, the variation in dominant frequency with temperature had the most distinct inflections at these points.
5. Discussion
The ultrasonic parameters were strongly correlated with unfrozen water content during the rapid freezing or rapid thawing stage. The underlying mechanisms should be related to pore structure modification caused by the phase transition of pore water and thermal deformation of the rock matrix during freezethaw.
5.1. Pore water freezing process in sandstone
Direct observations of the pore structure of sandstone (sample 2) were made via environmental scanning electron microscopy(ESEM) (Fig.14a). Accordingly, a conceptual pore structure model was derived(Fig.14b).The pore size of rock is negatively correlated with the freezing order of pore water;in other words,water in large pores freezes first (Everett, 1961; Timur, 1968; King, 1977; Pandit and King,1979; King et al.,1988; Ding et al., 2020).
According to the samples’ pore size distribution (Fig. 1 and Table 1),it can be seen that mesopores held the majority(>50%)in the pores of samples 1-3, while micropores did in sample 4. The pore water freezing processes in these two types of rocks are analysed below.For sandstone with mesopores greater than 50%at temperatures between 0°C and-2°C,only a small amount of pore water froze due to the supercooling phenomenon (Jia et al., 2019;Deprez et al., 2020). At temperatures between -2°C and -3°C,water in large pores (mesopores in this case) froze first, and then water in small pores(micropores in this case)that were connected to large pores froze. Therefore, a large amount of free water and capillary water froze rapidly,causing the unfrozen water content to drop rapidly(Everett,1961; Jia et al.,2019; Deprez et al.,2020).As the temperature continued to decrease from -3°C to -20°C, a certain amount of water always remained unfrozen (Petrov and Furó 2011a, b; Jia et al., 2019).
For sandstone with micropores higher than 50%, supercooling occurred as well at temperatures between 0°C and-1°C(Fig.8d).At temperatures between -1°C and -2°C, water in mesopores froze rapidly, and the unfrozen water content dropped to about 60%,which is basically the same as the proportion of mesopores in the sample(Fig.8d and Table 1).As temperature decreased further,a portion of water in micropores (mainly capillary water) froze gradually. At -20°C, unfrozen water may exist in two forms: unfrozen water film between pore ice and mineral particles, and adsorbed water in extremely small pores(Jia et al.,2015,2019).The former is primarily in mesopores(or bigger ones),and its volume is determined by its thickness,which is negatively correlated with the freezing temperature(Yan et al.,2019).Accordingly,we can derive the pore structure of sandstone before and after freezing with reference to the phase transition of pore water,as shown in Fig.14.
5.2. Mechanism of change in ultrasonic properties during freezethaw process
In the process of propagation,ultrasonic waves may experience reflection, refraction, diffraction and other phenomena (Winker and Nur, 1982). Therefore, variation in ultrasonic parameters is closely related to the propagation path of ultrasonic waves. According to the pore structure model shown in Fig. 14, the propagation paths of ultrasonic waves in sandstone are basically of two types: propagation in the rock skeleton (path 1) and propagation across the pores (path 2). During the sandstone freezing-thawing process, paths 1 and 2 both changed significantly due to thermal deformation of the mineral grain skeleton and changes in the pore phase composition (relative contents of ice and water). From this point of view, we can analyse the correlation between ultrasonic parameters and unfrozen water content during the freeze-thaw process (Fig.15).
5.2.1. Mechanism of change in P-wave velocity during freeze-thaw process
It can be seen from Figs. 4, 9 and 10 that there were close correlations between P-wave velocity and unfrozen water content.The influences of paths 1 and 2 on wave velocity during the freeze-thaw process are analysed below.
Fig.15 shows that for path 1,with decreases in temperature,the rock volume shrinks due to cold-contraction of the rock skeleton,which shortens the ultrasonic wave propagation distance, and therefore increases the longitudinal wave velocity (Inada and Yokota,1984). Shortening of path 1 due to cold-contraction of the rock skeleton is linearly correlated with temperature difference.
Fig. 15 also shows that for path 2, at temperatures of -1°C to -3°C, a large amount of pore water froze rapidly and pore ice filled the pore spaces. Consequently, ultrasonic waves could travel directly across the gap between mineral particles; in other words,the propagation distance decreased. As temperature decreased further, unfrozen water film was narrowed down; however, this effect would not alter P-wave velocity significantly.
Modification of the above two paths by cold-contraction of the rock skeleton and gap-filling of pore ice both contributed to the increase in wave velocity during freezing and unquestionably the latter is the main cause.
5.2.2. Mechanism of energy change during freeze-thaw process
The ultrasonic wave energy decreases with distance as it propagates through rock, while the amplitude is an important parameter in energy attenuation (Winker and Nur,1982; Murphy,1984).In this paper, the quality factor Q or its reciprocal Q-1is used to represent energy attenuation. It can be seen from Figs.10 and 11 that there is a close correlation between energy attenuation and unfrozen water content. The mechanism that rock freezing influences energy change can be analysed in terms of the two paths shown in Fig.15.

Fig.14. ESEM image (a) and diagrams of the pore water freezing mechanism (b, c).
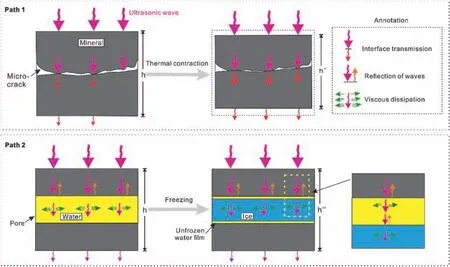
Fig.15. Mechanisms of elastic wave propagation in rock during freeze-thaw cycle: Path 1 (upper) and path 2 (lower).
For path 1, we know that with decreases in temperature, the ultrasonic wave propagation distance decreased due to coldcontraction of the rock skeleton. As energy decreased with propagation distance, the energy increased in this case.
For path 2,at temperatures between-2°C and-3°C,gap-filling of pore ice occurred.The scattering attenuation of ultrasonic waves propagating in a solid is weaker than that in a liquid due to the higher viscous dissipation and energy loss in a liquid(Biot,1962a,b;O’Connell and Budiansky,1977;Mavko and Nur,1979;Toksöz et al.,1979), thus the ultrasonic wave attenuation was reduced after water froze into ice.
5.2.3. Mechanism of change in the dominant frequency during freeze-thaw process
A propagation medium performs frequency-selective absorption of sound waves, therefore, the absorption and scattering of waves vary according to the physical state of the medium (Santos et al., 2010).
As can be seen from Figs.7 and 13,at temperatures above-2°C,the rock pores were filled with water and thus could absorb a relatively high-frequency sound spectrum. Therefore, only the relatively low-frequency signals were not attenuated in the spectrum,hence there were only low-frequency signals in the received spectrum and the dominant frequency was low. At temperatures between -2°C and -3°C, water froze rapidly. At this time, the absorption of relatively high-frequency sound waves by unfrozen water was weakened, thereby the dominant frequency increased rapidly. At temperatures between-3°C and -20°C, the unfrozen water content remained basically unchanged (Figs. 7 and 13) and thus the dominant frequency was still relatively high.
5.3. Ultrasonic parameters as indices of unfrozen water content in rock
Ultrasonic parameters (P-wave velocity, dominant frequency,amplitude and Q) had strong correlations with unfrozen water content during the rapid freezing and rapid thawing stages.Moreover, two clear inflection points in the curves of ultrasonic parameters versus temperature were observed at -3°C (marking the end of rapid freezing of pore water) and -1°C (indicating the start of rapid thawing of pore ice). Therefore, based on the laboratory test results, ultrasonic parameters can be used as indices to quickly judge the freezing state and unfrozen water content of porous sandstone. In addition, the higher the proportion of mesopores in sandstone, the lower the unfrozen water content at the inflection point during freezing.
6. Conclusions
In this paper,ultrasonic and NMR tests were conducted on four rock samples with different porosities.Changes in P-wave velocity,amplitude,dominant frequency and unfrozen water content during the freeze-thaw process were measured.The following conclusions can be drawn:
(1) In a freeze-thaw process, the ultrasonic parameters of sandstone(P-wave velocity,amplitude,dominant frequency,and Q) have significant hysteresis with changes in temperature. In addition, there are three stages in the variation of these parameters with decreases in temperature: at temperatures above -2°C, they increase slightly, and then increase sharply at-2°C to-3°C,followed by a slight change at -3°C to -20°C.
(2) The unfrozen water content of sandstone exhibits a significant hysteresis phenomenon with changes in temperature.There is an obvious three-stage change in each phase of freezing and thawing.In the freezing phase,at temperatures higher than -2°C, the unfrozen water content decreases slightly with temperature. Between -2°C and -3°C, the unfrozen water content decreases rapidly. In porous sandstone with mesopores greater than 50%, the unfrozen water content does not change with decreases in temperature below -4°C. In rock with micropores greater than 50%, the unfrozen water content still decreases gradually with temperature. At-20°C, the unfrozen water content is less than 10%. In sandstone with mesopores greater than 50%, the hysteresis loop is generally parallelogram-shaped. In sandstone with micropores greater than 50%, the hysteresis loop is generally sickle-shaped.
(3) The ultrasonic parameters of sandstone have clear correlations with the unfrozen water content, which are also affected by the pore structure of the sandstone. For porous sandstone with mesopores greater than 50%, -3°C is the inflection point in this variation during freezing.In particular,the dominant frequency does not change according to the unfrozen water content at temperatures below -3°C. The higher the proportion of mesopores,the lower the unfrozen water content at the inflection point. For rocks with micropores greater than 50%, there is no clear inflection point during the freeze-thaw process.
(4) The propagation paths of ultrasonic waves in saturated sandstone are basically of two types,propagation in the rock skeleton and propagation through the pores. During the sandstone freeze-thaw process, the ultrasonic wave propagation paths both change significantly due to thermal deformation of the mineral grain skeleton and changes in the pore phase composition.Modification of the above two paths leads to the variation of ultrasonic parameters during freezethaw process.
(5) For porous sandstone with mesopores greater than 50%, the inflection point in the ultrasonic parameter-temperature curve, especially that in the dominant frequencytemperature curve, marks the end of the pore water rapid freezing stage. Hence, ultrasonic parameters can be used as indices to conveniently judge the freezing state and unfrozen water content of rock.
Declaration of competing interest
The authors declare that they have no known competing financial interests or personal relationships that could have appeared to influence the work reported in this paper.
Acknowledgments
This work was supported by the National Natural Science Foundation of China (Grant No.41702334).
 Journal of Rock Mechanics and Geotechnical Engineering2021年5期
- Journal of Rock Mechanics and Geotechnical Engineering的其它文章
- Surface characteristics analysis of fractures induced by supercritical CO2 and water through three-dimensional scanning and scanning electron micrography
- Prediction of fracture and dilatancy in granite using acoustic emission signal cloud
- Coupled Eulerian-Lagrangian simulation of a modified direct shear apparatus for the measurement of residual shear strengths
- A novel true triaxial test system for microwave-induced fracturing of hard rocks
- Hydromechanical behavior of unsaturated expansive clay under repetitive loading
- Laboratory large-scale pullout investigation of a new reinforcement of composite geosynthetic strip
