Surface characteristics analysis of fractures induced by supercritical CO2 and water through three-dimensional scanning and scanning electron micrography
Hao Chen, Yi Hu, Jiawei Liu, Feng Liu, Zheng Liu, Yong Kang,Xiaochuan Wang,*
a Hubei Key Laboratory of Waterjet Theory and New Technology, Wuhan University, Wuhan, 430072, China
b School of Power and Mechanical Engineering, Wuhan University, Wuhan, 430072, China
Keywords:Supercritical carbon dioxide (SC-CO2)fracturing Quantitative characterization of surface features Surface roughness and fractal dimension Three-dimensional (3D) scanning Scanning electron micrograph (SEM)
ABSTRACT Morphology of hydraulic fracture surface has significant effects on oil and gas flow, proppant migration and fracture closure,which plays an important role in oil and gas fracturing stimulation.In this paper,we analyzed the fracture surface characteristics induced by supercritical carbon dioxide(SC-CO2)and water in open-hole and perforation completion conditions under triaxial stresses.A simple calculation method was proposed to quantitatively analyze the fracture surface area and roughness in macro-level based on three-dimensional (3D) scanning data. In micro-level, scanning electron micrograph (SEM) was used to analyze the features of fracture surface. The results showed that the surface area of the induced fracture increases with perforation angle for both SC-CO2 and water fracturing, and the surface area of SC-CO2-induced fracture is 6.49%-58.57% larger than that of water-induced fracture. The fractal dimension and surface roughness of water-induced fractures increase with the increase in perforation angle,while those of SC-CO2-induced fractures decrease with the increasing perforation angle. A considerable number of microcracks and particle peeling pits can be observed on SC-CO2-induced fracture surface while there are more flat particle surfaces in water-induced fracture surface through SEM images, indicating that fractures tend to propagate along the boundary of the particle for SC-CO2 fracturing while water-induced fractures prefer to cut through particles. These findings are of great significance for analyzing fracture mechanism and evaluating fracturing stimulation performance.
1. Introduction
Hydraulic fracturing is a widely used stimulation measure for oil and gas wells(Damani et al.,2018;Wanniarachchi et al.,2018;Feng et al., 2020a; Tan et al., 2020). Horizontal wells and multistage hydraulic fracturing have been successful in American shale gas development (Bennour et al.,2015; Li et al.,2015). The production of shale gas is closely related to effective stimulated reservoir volume, which depends on the complexity of the fracture network(Mayerhofer et al.,2010;Miller et al.,2011;Zhang et al.,2019a;Tan et al., 2020). Supercritical carbon dioxide (SC-CO2) fracturing,which has been shown by many studies to create more complex fractures, has a broad prospect in the development of shale gas in China for its various advantages such as reducing formation damage and displacing methane (Middleton et al., 2015; Zhang et al.,2017; Wang et al., 2018a). Especially, in water shortage area, the use of SC-CO2would greatly reduce water consumption and environmental pollution (Hu et al., 2016; Cai et al., 2018; Wang et al.,2018b). Thus, it is of great significance to understand SC-CO2fracturing for oil and gas exploitation in China.
Previous studies on SC-CO2fracturing mainly focused on two aspects.One was to compare SC-CO2with other fluids such as water to verify the superiority of SC-CO2fracturing. The other was to investigate the influences of in situ stress, flow rate and other factors on fracture initiation and propagation (Kizaki et al., 2012;Inui et al., 2014; Bennour et al., 2015; Jiang et al., 2018; Li et al.,2019; Zhang et al., 2017, 2019b). Laboratory experiments have found that the breakdown pressure of SC-CO2-based fracturing is smaller than that of water- and oil-based fracturing, and SC-CO2could induce more complex fracture than other fracturing fluids for its unique properties such as low interfacial tension, low viscosity and high diffusivity (Inui et al., 2014; Zhang et al., 2017; Ranjith et al., 2019). Thus SC-CO2has a better fracturing effect than water. Under the same in situ stress condition, the propagation of fractures induced by SC-CO2and water shows different patterns.The fracture propagation of higher viscosity fluids is more easily dominated by stress; however, SC-CO2shows an independence of stress and could induce more complex fracture even under a high differential stress(Bennour et al.,2015;Zou et al.,2018).Due to the low viscosity, it is easier for SC-CO2to enter the pore and microcrack in rock than other higher viscosity fluids. Therefore, SC-CO2could more easily induce fracture along the bedding planes, preexisting fractures and other weak planes (Jiang et al., 2018; Li et al., 2019). The rock anisotropy also affects fracture initiation and propagation, showing that fracture would more easily propagate along the bedding when bedding plane direction is more inclined to the direction of the minimum principal stress (Zhang et al., 2019b). A high flow rate would be beneficial for SC-CO2to activate the bedding planes and pre-existing fractures while a low flow rate may be better for water-based fluids(Guo et al.,2014;Zou et al.,2018).The above-mentioned studies mainly focused on openhole completion specimens, while Chen et al. (2019) investigated the fracture propagation in perforation completion specimens.They found that perforation angle had an important effect on fracture propagation, and high perforation angle would help to form more complex fracture for SC-CO2fracturing.
Fracture surface records the process of irreversible deformation of materials under multiple effects of loading and environments(van Dam and de Pater, 2001; Fu et al., 2019; Feng et al., 2020b).Morphology of hydraulic fracture surface has important effects on oil and gas flow,proppant migration and fracture closure(Luo et al.,2016; Huang et al., 2017a). Usually, the fracture surface is uneven and zigzag (Zhao et al., 2019). Experiments showed that hydraulic fracture roughness was determined by material properties and confining stresses without shear and torsional loading; the roughness increases with horizontal stresses and decreases with the stress perpendicular to the fracture (van Dam and de Pater,2001). Fracture roughness differs with various rock types, and it is much rougher in plaster than in cement (van Dam and de Pater,2001). There is a positive correlation between fracture toughness and fracture roughness in granite (Nasseri et al., 2007). Fracturing fluid also has some influence on fracture surface, i.e. fracture roughness induced by SC-CO2is larger than that of fresh water and N2(Li et al.,2016;He et al.,2018).Previous studies in the literature also investigated the effects of fracture roughness on fluid flow and proppant migration.Thompson and Brown(1991)investigated the role of anisotropic surface roughness on fluid flow and solute transport in fractures and found that roughness oriented parallel to the primary flow direction substantially enhanced fluid and solute transport rates through fractures.Huang et al.(2017a)investigated the influence of fracture roughness on proppant transport in a vertical fracture and found that the proppant-transport behavior in rough fracture was different from that in the smooth fracture and the existence of roughness enhanced the vertical displacement of fluid containing proppant.They also investigated the influence in a complex fracture network by numerical simulation and found that wall roughness can both decrease the horizontal transport speed and vertical drop speed of the proppant (Huang et al., 2017b).Therefore, studies on fracture surface are of great significance for understanding fracturing mechanism and evaluating its stimulation effect.
However,only a few studies on SC-CO2fracturing have involved the fracture surface. Li et al. (2016) and Jia et al. (2018) conducted SC-CO2fracturing experiments and calculated the fracture surface roughness and fractal dimension through stylus and optical profilometry. However, the scanning range of the apparatus is small and it is not accessible to obtain the whole fracture surface as the scanning area in Li et al.(2016)is 1.6 mm×1.6 mm and that in Jia et al. (2018) is 20 mm × 10 mm. Therefore, in this work, we analyzed the surface characteristics of SC-CO2-induced fracture under different completion conditions in macro-level through three-dimensional(3D)scanning,and provided a simple method to calculate the fractal dimension based on point cloud data. Meanwhile, scanning electron micrograph (SEM) was used to compare the fracture surface microscopic characteristics of water fracturing and SC-CO2fracturing. The results are of great significance for analyzing fracture mechanism and evaluating fracture conductivity performance.
2. Experimental methodology
2.1. Apparatuses
The fracturing experiments were conducted on a self-made true triaxial fracturing system(Fig.1).The system is composed of SC-CO2injection device,water injection device,and true triaxial confining pressure loading device. The system can perform both SC-CO2fracturing and water fracturing experiments.
The SC-CO2injection device consists of gaseous CO2cylinder,liquid CO2storage tank, plunger pump, water bath heater, and buffer tank. Gaseous CO2from CO2cylinder is liquefied through refrigeration cycle and then stored in storage tank.The liquid CO2is then pressurized via plunger pump and heated and stored in a buffer tank.The rated pressure of the plunger pump is 80 MPa,and the controllable temperature range of the water bath heating device is 5°C-100°C with accuracy of±0.5°C.The CO2will turn into supercritical state when the temperature and pressure in the buffer tank exceed their critical values, respectively (31.1°C for temperature and 7.38 MPa for pressure).
The water injection device can realize the injection of liquid fluid under laboratory conditions.The fluid in the piston container is pushed into the rock through a TC-260L pump with rated pressure of 60 MPa. The pump can achieve injection with constant pressure or constant flow, and the flow range is 0.01-60 mL/min.The volume of the piston container is 500 mL and it is filled through an 800 mL polycarbonate (PC) storage tank.
The true triaxial confining pressure loading device consists of confining pressure kettle, hydraulic pump, and servo-control system. The confining pressure can be applied independently along the x-, y-, and z-directions through three hydraulic pumps controlled by servo-control system. The maximum size of test specimen in this system is 300 mm×300 mm×300 mm,and the maximum confining pressure can reach up to 30 MPa in each direction.
After fracturing,specimens were scanned by laser handheld 3D scanner FreeScan X7 (Fig. 2). Adopting multi-line structured laser and double 7-line scanning technology,its scanning rate can reach 48,000 times per minute. The resolution is 0.05 mm, the measurement accuracy is 0.03 mm, the volume accuracy is 0.02 + 0.06 mm/m, and the measurement range is 0.1-0.8 m.Hence it is accessible to obtain the whole fracture surface characteristics.
2.2. Specimen preparation
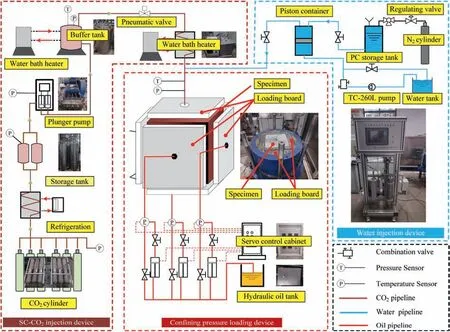
Fig.1. True triaxial fracturing test system.
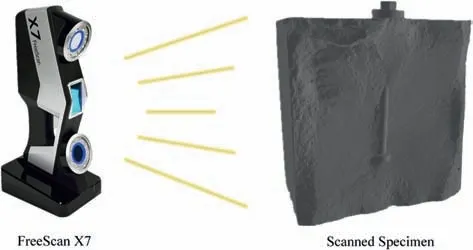
Fig. 2. The 3D scanning apparatus and the scanned specimen.
In order to avoid the influences of rock heterogeneity and anisotropy, artificial rock specimens made of cement and quartz were adopted. The mass ratio of the cement and quartz (40-70 meshes)is 1:1.The specimen size is 300 mm×300 mm×300 mm and the specimens were tested after four weeks of curing. The mechanical properties of the specimen were obtained through carrying out compression and tension experiments. The P-wave velocity was obtained by using the NM-4A nonmetallic ultrasonic testing analyzer. The physico-mechanical properties of the specimens are listed in Table 1.
Open-hole completion and perforation completion specimens were prepared by two different methods. For the perforation completion specimens, the mixed mortar was firstly injected into the cube mold,and then a stainless steel tube was inserted into the middle of the mortar. The length of the tube is 220 mm and the outer diameter is 14 mm (Fig. 3a). Two symmetric holes withdiameter of 3.5 mm were drilled at 50 mm up from the bottom of the steel tube to simulate the perforation hole in the process of fracturing. The direction of perforation can be determined by adjusting the orientation of the hole. The perforation angle (α) is defined as the intersection angle between the perforation and the maximum principal stress direction as defined by Chen et al.(2019), as shown in Fig. 3a. Five perforation angles (0°, 30°, 45°,60°and 90°) were used in this experiment.

Table 1 Physico-mechanical properties of the specimens.
For the open-hole completion specimens (Fig. 3b), the mixed mortar was firstly put into the cube mold and then a borehole mold was inserted into the middle of the mortar. After 12 h of solidification, the borehole mold was pulled out and a borehole was remained in the specimen. After 2 weeks of curing, a tube was cemented with G-style cement in the borehole, leaving a 15 mm open-hole section,and then the specimens were cured for another 2 weeks. The borehole mold and tube are shown in Fig. 3.
2.3. Experimental procedure
Before experiment, we placed the specimens in a dry and ventilated environment for a week. After that, all specimens were heated to reach a temperature of 60°C. Then, the specimen was placed in the confining stress loading device with the tube oriented vertically(x-direction).Then,confining pressures are applied in x-,y- and z-directions with values of 9.8 MPa,10.5 MPa and 8.5 MPa,respectively. All specimens were under the same stress condition.In the process of SC-CO2injection,the injection valve opening kept the same among all the experiments to control the flow rate while in the process of water fracturing, constant flow injection was adopted and the flow rate was set at 40 mL/min. After the experiments,the specimens were spilt along the fracture trace,exposing the fracture surface. To analyze some quantitative properties and microscopic characteristic of the surface, 3D scanning and SEM were adopted.
3. Calculation methodology
The point cloud data of the whole fracture surface can be obtained by 3D scanning.The x-,y-and z-axes were set to be parallel to the directions of vertical principal stress, maximum and minimum horizontal principal stresses, respectively. As the induced fractures were vertical and mostly propagated perpendicularly to the minimum principal stress, xy plane was used as the reference plane. Since the projection of the point cloud data on xy plane is irregular, the present study firstly reconstructed the point cloud data by means of bilinear interpolation to obtain the lattice arranged regularly in the projection plane(Fig.4).The lattice data are used to analyze and calculate the fracture surface area, fractal dimension and other parameters. The distance between interpolation points in xy plane is 0.25 mm. Fig. 5 shows the 3D distribution patterns of the point cloud data and the interpolation data.The morphology of the two distribution patterns is very similar, indicating that the interpolation data can be used to analyze the surface characteristics of the induced fracture.
3.1. Fracture surface area and roughness
Xie et al. (1998) proposed a simple method for calculating the surface area (Fig. 6). The fracture surface can be approximately divided into many small quadrangles. The whole fracture surface area can be approximately obtained by calculating the sum of the areas of all the small quadrangles. The projections of the interpolated data onto xy plane are the regular grid points.For the kth grid abcd(a,b,c and d are four angular points of the grid)with a selected scale of δ×δ(the grid size),the heights of the fracture surface at the points a,b,c and d are zi,j+1,zi,j,zi+1,jand zi+1,j+1,respectively.The area of the fracture surface Akcorresponding to the projection abcd can be approximately calculated by

where
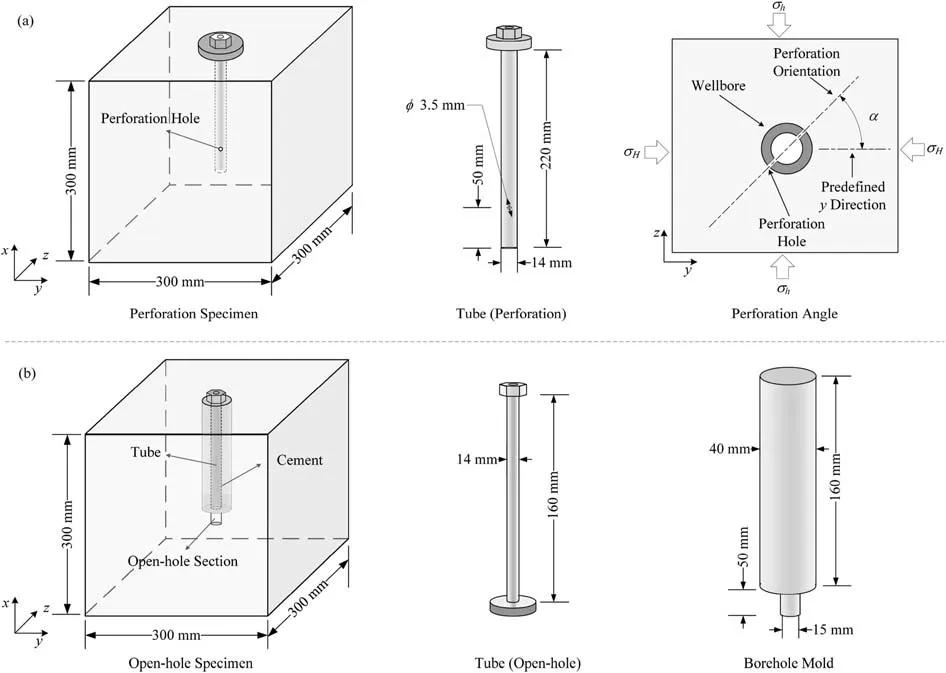
Fig. 3. Schematic diagram of the design of perforation and open-hole specimens: (a) Perforation completion, and (b) Open-hole completion.
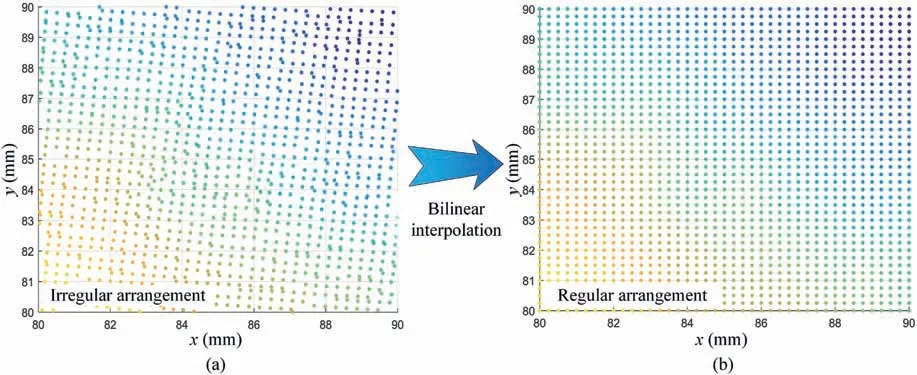
Fig. 4. Schematic diagram of the arrangement of points: (a) 3D scanned point cloud data, and (b) Grid data after linear interpolation.
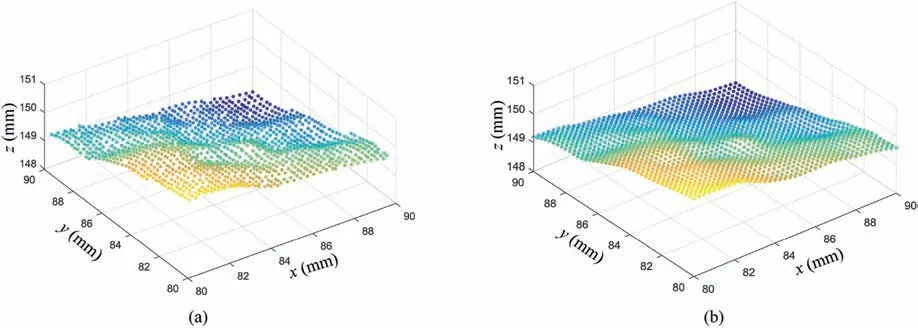
Fig. 5. 3D distribution patterns of the point cloud data and interpolation data: (a) Point cloud data, and (b) Interpolation data.
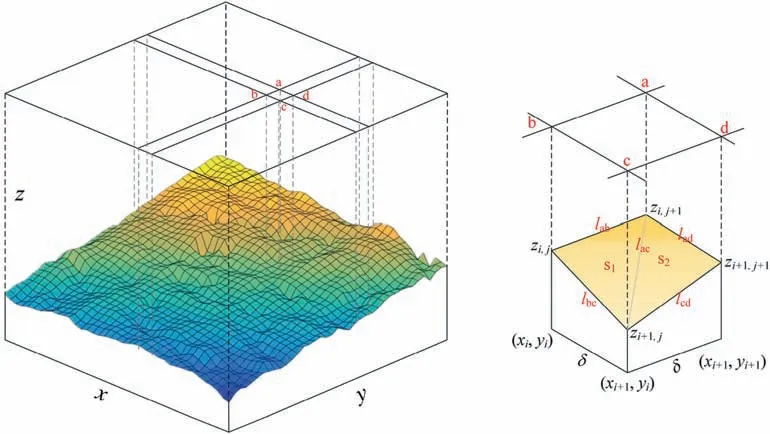
Fig. 6. Schematic diagram for calculating surface area of fracture.

If the fracture surface to be calculated was divided into n quadrangles,then the total area of the surface AT(δ)can be written as

The fracture surface roughness RSin this study is referred to as the ratio of the fracture surface area to its projected area in the xy plane, and it can be written as (El Soudani,1978):

where Apis the projected area of the fracture,and n is the number of quadrangles that the fracture surface is divided.For a flat surface parallel to xy plane, RSequals one. The rougher and more inclined the fracture surface is, the larger the value of Rsis.
3.2. Fractal dimension
Zhou and Xie (2003) provided a simple method to directly estimate the fractal dimension of a rough surface, i.e. the cubic covering method. The basic idea of this method is to use a cube of size δ×δ×δ to cover the fracture surface,and the fractal dimension is associated with the number of cubes needed to cover the surface and the scale δ.Zhao et al.(2017)proposed an improved method to calculate the number of cubes required to cover the surface corresponding to the kth grid abcd as
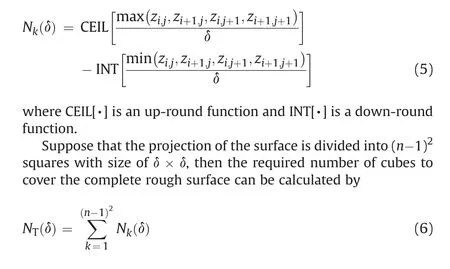
A set of NT(δ)can be obtained by changing the size of δ,and the fractal dimension can be calculated as

where D is the fractal dimension of the fracture surface and it can be obtained by calculating the inverse of the slope of the log10NT(δ)-log10δ curve. Fractal dimension D reflects the roughness of the fracture surface. For a 3D surface, the range of D is 2-3. For a flat surface,D is equal to 2,and the rougher the surface is,the closer the fractal dimension D is to 3.
4. Results
Table 2 lists the experimental scheme and fracture geometry for this study. In water fracturing experiments, a vertical bi-wing fracture was induced in each specimen. There were more branches induced by SC-CO2fracturing.The fracture geometry and propagation will not be described as it has been analyzed in detail by Chen et al. (2019). This study aims to analyzing the surface characteristics of the fracture.
4.1. Surface area of the induced fractures
Based on 3D scanning data, the areas of fracture surfaces were calculated by MATLAB programming. To eliminate the edge effect,the calculated area is 290 mm × 295 mm. For open-hole completion specimens, tube and cementing section with size of 40 mm × 160 mm was removed. For perforation completion specimens, an area of tube with size of 14 mm × 220 mm was removed(Fig.7).If a single bi-wing fracture is induced,the fracture surface area is the average of the two sides of the main fracture. If more branches are induced, the fracture surface area is the total area of the main fracture and its branches.
Table 3 and Fig. 8 show the total surface areas of the fracture induced by SC-CO2fracturing (ASC-CO2) and water fracturing(Awater). The fracture surface area of SC-CO2fracturing is larger than that of water fracturing in both open-hole and perforation completion conditions. Under open-hole completion condition,the surface area of SC-CO2-induced fracture is 13.8%-58.57%larger than that of water-induced fracture. Under perforation completion condition, the surface area of SC-CO2-induced fracture is 6.49%-50.59% larger than that of water-induced fracture.With the increase of perforation angle, the fracture surface area tends to increase for both SC-CO2and water fracturing, and the rate of increase in SC-CO2fracturing is larger than that inhydraulic fracturing. The total fracture surface area is mainly determined by the fracture branches and roughness of the fracture. Under open-hole completion condition, the total fracture surface area differs greatly between the specimens with and without branches. When there is no branch, the SC-CO2-induced fracture should be more zigzag and rougher than water-induced fracture, as the SC-CO2-induced fracture surface area is larger than water-induced fracture. Under perforation completion condition, since there are more branches as perforation angle increases, the increase of fracture surface area with perforation angle for SC-CO2fracturing is mainly due to the formation of fracture branches.It is difficult to determine whether the fracture surface roughness increases with the perforation angle or not.However, for water fracturing, the increase of fracture surface area is mainly due to the increase of roughness, as there are no branches induced by water fracturing.
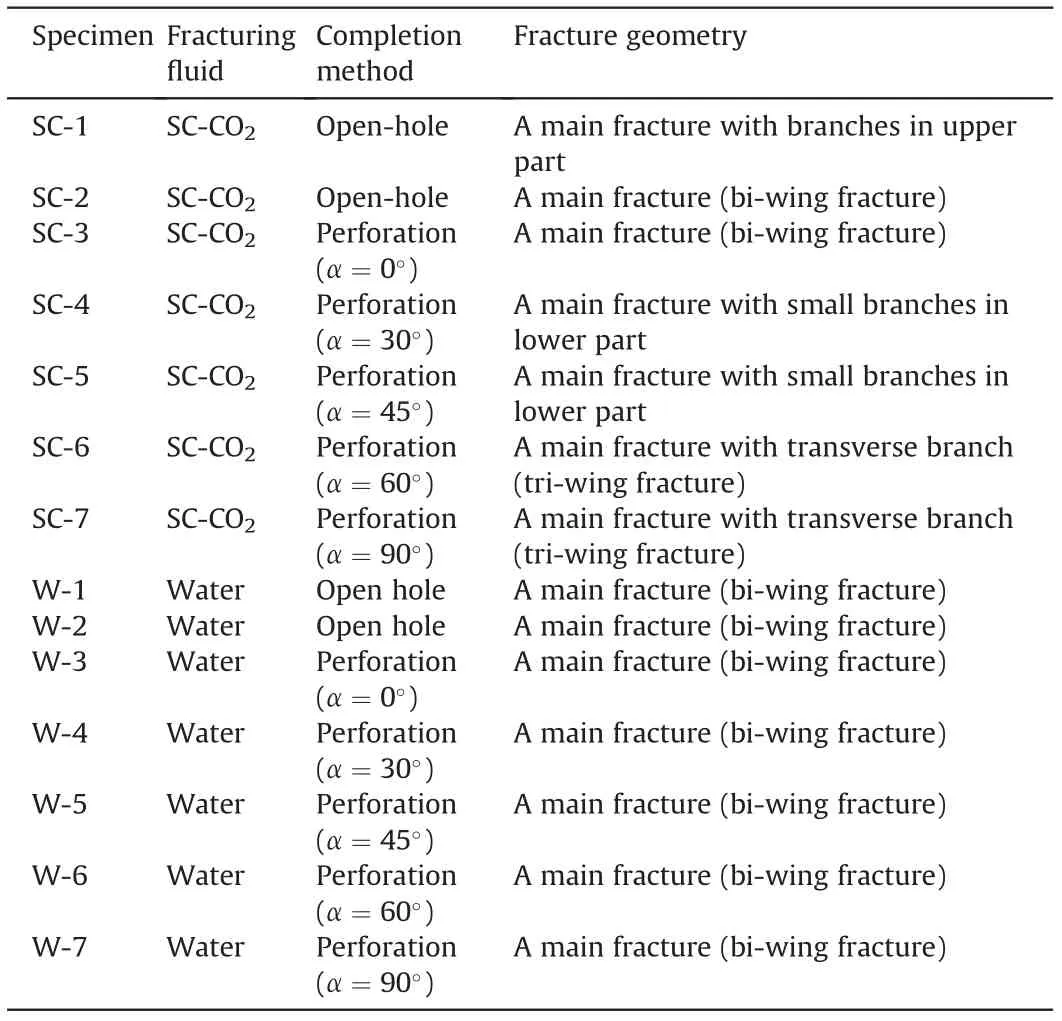
Table 2 Experimental scheme and results.
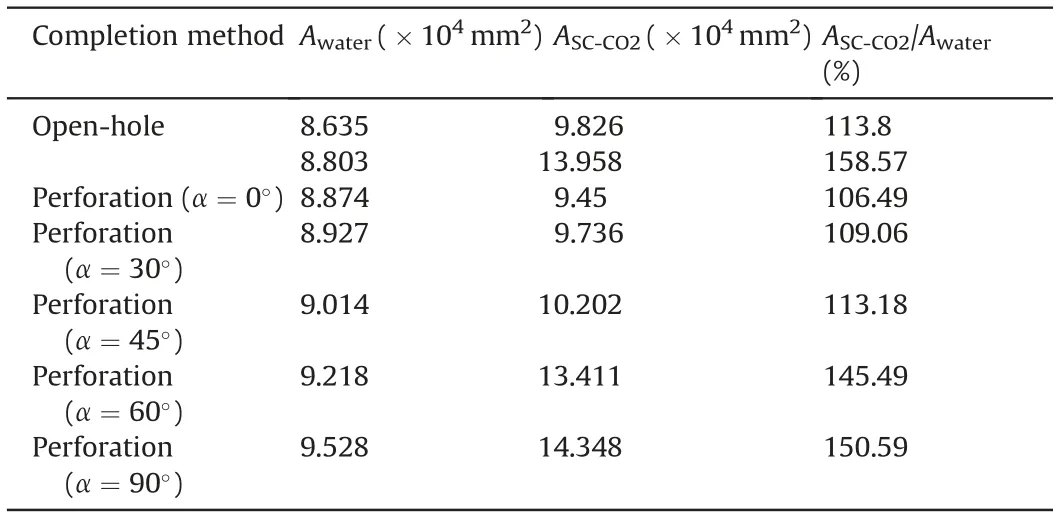
Table 3 Calculation results of total fracture surface area.
4.2. Fracture surface complexity
Fracture roughness and fractal dimension were selected to quantify fracture complexity. Due to the generation of fracture branches and the irregularity of fractures,it is difficult to analyze the entire fracture.Therefore,the same area near the wellbore on the main fracture was selected to calculate the fractal dimension and fracture roughness. As shown in Fig. 9, the size of the analysis area is 80 mm×120 mm.Each main fracture surface has two analysis areas, symmetrical with respect to the tube. The spacing between the two areas is 60 mm for open-hole completion specimen and 40 mm for perforation completion specimen.
In this study, the fractal dimension of analysis areas was calculated by cubic covering method. The minimum numbers of cubes (N) needed to cover the fracture surface were calculated according to different computational scales. The scales δ are 0.25 mm, 0.5 mm, 1 mm, 2 mm, 4 mm, 8 mm and 16 mm,respectively. Table 4 provides the calculation results of the fractal dimension of the fractures. The correlation coefficient R2of all surfaces is more than 0.99,indicating that the fractures have fractal characteristics on this scale.
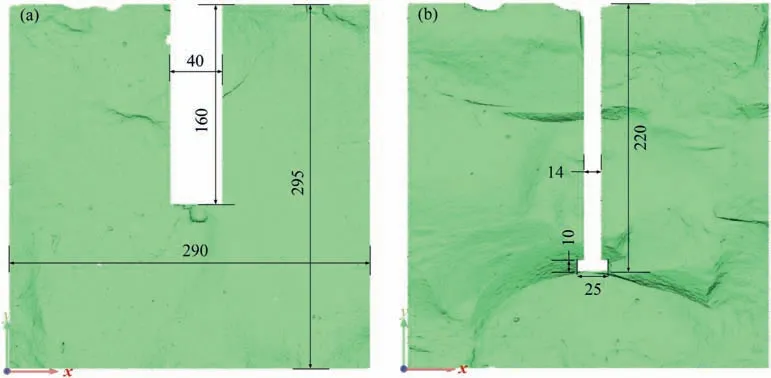
Fig. 7. The region to calculate fracture surface area: (a) Open-hole completion, and (b) Perforation completion. Dimensions are in mm.
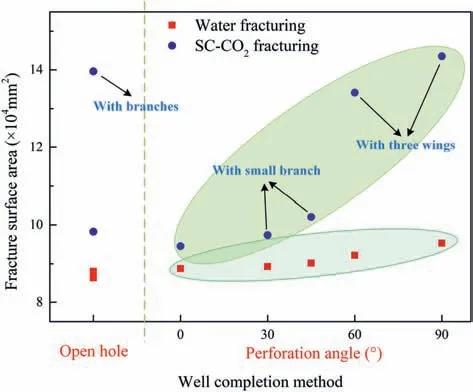
Fig. 8. Total surface area of the induced fracture in SC-CO2 fracturing and water fracturing.
In order to better show the fracture surface complexity, the fractal dimension and surface roughness are plotted in Fig.10.It can be seen that the fractal dimension and surface roughness of SCCO2-induced fractures are both larger than those of water-induced fractures under open-hole completion condition.Under perforation completion condition,the fracture surface complexity of water and SC-CO2-induced fractures shows different patterns. With the increase of perforation angle, the fractal dimension and surface roughness of water-induced fractures tend to increase, while SCCO2-induced fractures show downward trend. Therefore, the increase of fracture surface area with perforation angle for SC-CO2fracturing discussed in Section 4.1 is due to the formation of branches, and the surface roughness makes a negative effect on this. At low perforation angles (α < 45°), there are few branches induced by SC-CO2fracturing. SC-CO2-induced fracture is rougher than water-induced fracture. At high perforation angles, SC-CO2generates more and larger branches; however, the surface roughness decreases and is smaller than that of water-induced fractures.It implies that the formation of fracture branches reduces the roughness of the main fracture.
4.3. Microscopic characteristic of the fracture surface
This section is to analyze the microscopic characteristic of the fracture surface induced by water and SC-CO2through SEM images.Several typical SEM images of water-and SC-CO2-induced fracture surfaces are shown in Fig.11.As the specimens were made of quartz and cement, quartz particles can be easily identified in the image.There are some differences between the fracture surfaces induced by water and SC-CO2. Microcracks between quartz particle and cement can be seen in the SC-CO2-induced fracture surface image and there are also some pits left by peeling particles. However,for water-induced fracture, there are some relatively flat particle surfaces left on the surface image, which results from quartz particle splitting.The difference of the surface characteristics indicates the difference of microscopic failure modes between the specimens in water and SC-CO2fracturing. For SC-CO2fracturing, fracture tends to propagate along the boundary of the particle, and for water fracturing, fracture tends to cut through the particle (Ishida et al.,2016; Li et al., 2019). Zhou et al. (2018) also observed this characteristic in cement mortar (Fig. 12). This is caused by the low viscosity of SC-CO2, which would make SC-CO2easily enter micropores and crack tip and induce fracture from relatively weak grain boundaries.
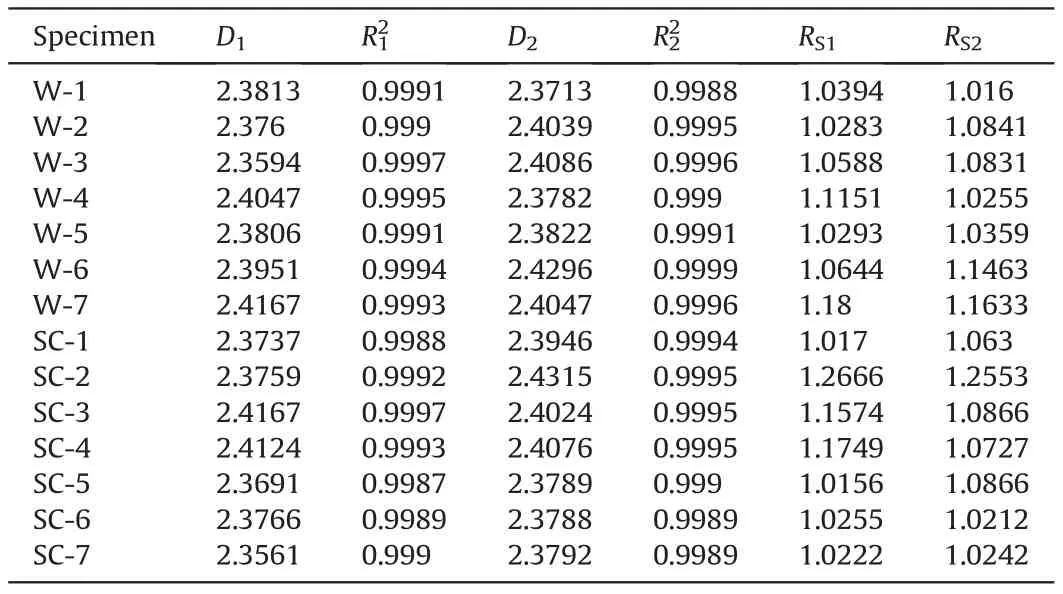
Table 4 Calculation results of fractal dimension and surface roughness. Subscripts 1 and 2 represent the left and right analysis areas of each fracture, respectively.
5. Discussion
5.1. Effect of fluid type on fracture complexity
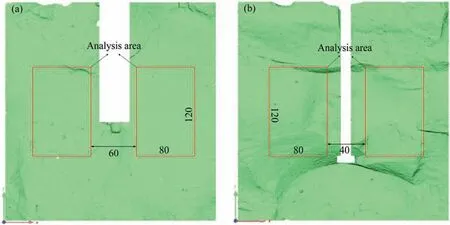
Fig. 9. Analysis areas for fractal dimension and fracture roughness: (a) Open-hole completion specimen, and (b) Perforation completion specimen. Dimensions are in mm.
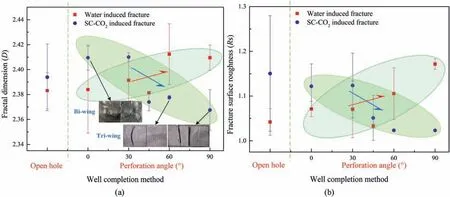
Fig.10. (a) Fractal dimension and (b) surface roughness of the fractures induced by SC-CO2 and water.
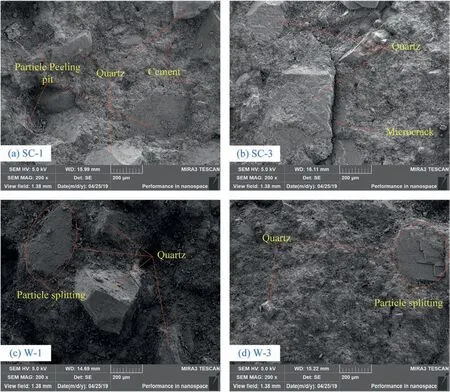
Fig.11. SEM images of the fracture surfaces induced by water and SC-CO2 fracturing:(a)SC-1 by SC-CO2 fracturing,(b)SC-3 by SC-CO2 fracturing,(c)W-1 by water fracturing,and(d) W-3 by water fracturing.
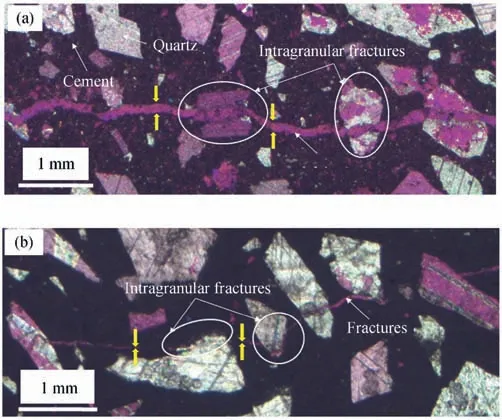
Fig.12. Microscopic images of fracture paths induced by (a) Hydraulic fracturing, and(b) SC-CO2 fracturing (Zhou et al., 2018).
The experimental results have found that the total fracture surface area induced by SC-CO2is larger than that induced by water in both open-hole and perforation completion specimens.There are two aspects contributing to this result, i.e. the roughness of the fracture and the fracture branches. In open-hole completion and small perforation angle specimens, the roughness of the main fracture induced by SC-CO2is larger than that by water. Previous studies in sandstone(Li et al.,2019)and shale(Jia et al.,2018;Zhao et al., 2018) have also observed that SC-CO2can induce more complex and rougher fractures. The difference in fluid properties causes this phenomenon.
The viscosity of water is much greater than that of SC-CO2.At a pressure of 20 MPa and a temperature of 60°C,the viscosity of SCCO2is 61.65 μPa s and the water is 471.92 μPa s (Fenghour et al.,1998). Due to the low viscosity, the flow resistance of SC-CO2in pore and fracture would be much lower than that of water,making it easier for SC-CO2to enter micropore and the crack tip and to induce fracture at the weaker position. Therefore,SC-CO2-induced fractures tend to propagate along the boundary of mineral particles,more likely to form fracture branches and rougher surface when encountering high-strength particles, while water-induced fractures tend to cut through mineral particles (Li et al., 2019). Chen et al. (2015), Li et al. (2015), Ishida et al. (2016) and Zhou et al.(2018) found this feature from microscopic observation in granite,sandstone and mortar cement specimens (Fig. 12), and the SEM images of the fracture surface in this study can also prove this point.
The initial pore pressure in the specimen is zero in this study,so that the fluid pressure would decrease from the wellbore to the boundary of the specimen. Therefore, CO2would change from supercritical state to liquid or gas state in the specimen during the injectionprocess of SC-CO2.The sound of explosions and the sight of gas ejection in SC-CO2fracturing both suggest the phase change.When SC-CO2changes to gaseous CO2,the volume of CO2would expand and urge the pore or fracture to expand. Some researchers (Chen et al.,2017;Hu et al.,2018;Long et al.,2014)have also studied the use of blasting energy from CO2phase transitions to cracked rocks. The phasechangeinspecimenwouldincreaserockdefectsanddisturbthe stress field, increasing the randomness of the rupture. Thus, the fracture complexity and roughness would increase.
5.2. Effect of completion method on fracture surface topography
In this study, we have used the open-hole and perforation completion methods, and the perforation angle was set as 0°, 30°,45°, 60°and 90°. The completion would have some influence on fracture propagation and surface topography.
In water fracturing, the roughness and area of the fracture in open-hole completion specimens are consistent with that of the specimen with a perforation angle of 0°. With the increase of the perforation angle, the roughness and area of the fracture tend to increase. This tendency is related to the propagation of the fractures. The perforation angle affects the initiation position of the fracture. When the perforation angle is 0°, fracture is supposed to initiate and extend along the direction of the maximum principal stress,which is similar to the open-hole condition(Chen et al,2010,2017). With the increase in perforation angle, fracture tends to initiate at the perforation and extends some distance in the direction of the perforation, and then reorients to the direction of the maximum principal stress.Therefore,the fracture tends to be more flexural and inclined as the perforation angle increases.
In SC-CO2fracturing, the fracture roughness of open-hole and low perforation angle specimens is larger than that of high perforation angle specimens. However, the total fracture surface area increases with the perforation angle.More branches are induced as the perforation angle increases,indicating that more energy is used to create secondary fracture so that there is less energy to increase the surface complexity. Meanwhile, as SC-CO2is characterized by low interfacial tension,low viscosity and high diffusivity,it is easier and faster to enter the pore of the rock and increase the pore pressure, and thus reduce the effective compressive stress of rock skeleton(Hubbert and Willis,1957;Ito,2008;Zhang et al.,2017;Cai et al., 2018). Due to the perforation, the pore pressure may distribute unevenly around the wellbore that the pore pressure is higher in direction of the perforation as the perforation is the channel to the rock for SC-CO2(Chen et al., 2019). Therefore, the stress field would be changed and this may change the failure mode of the rock,which may contribute to the decrease of the roughness.However, further study is needed to stand this point.
Both the fluid type and the completion method can affect the fracture surface topography which directly influence the conductivity of fractures. This study only compared the fracture surface properties in cement mortar specimens. Further experiments on sandstone and shale will be carried out.If the relationship between fracture conductivity and fracture surface characteristics can be established, it will be of great significance for the prediction of oil and gas production.
6. Conclusions
In this study, the fracture surface characteristics of water fracturing and SC-CO2fracturing under different completion conditions were studied with 3D scanning, and the microscopic surface features of water fracturing and SC-CO2fracturing were compared through SEM images. Then the effects of fracturing fluid type and completion method on the induced fracture surface were analyzed.The main findings are as follows:
(1) SC-CO2fracturing can induce larger fracture surface area than water fracturing in both open-hole and perforation completion conditions.Under the experimental conditions in this study, the surface area of SC-CO2-induced fracture is 13.8%-58.57% larger than that of water-induced fracture in open-hole completion condition, and in perforation completion condition,the value ranges from 6.49%to 50.59%.
(2) The fractal dimension and surface roughness of waterinduced fracture tend to increase with the increase in perforation angle,while the tendency is opposite for SC-CO2-induced fractures. The fractal dimension and surface roughness of SC-CO2-induced fractures are larger than those of water-induced factures in open-hole and low perforation angle conditions, and smaller in high perforation condition.
(3) With the increase in perforation angle,total fracture surface area tends to increase for both SC-CO2and water fracturing;and the rate of increase in SC-CO2fracturing is larger than that in water fracturing.The increase for SC-CO2fracturing is mainly caused by the formation of fracture branches while the increase for water fracturing is mainly due to the roughness.
(4) SEM images show that there are micro-fractures and particle peeling pits on the SC-CO2-induced fracture surface, while there are more flat particle surfaces on water-induced fracture surface, indicating that fractures tend to propagate along the boundary of the particle for SC-CO2fracturing,and water-induced fractures prefer to cut through particles.
Declaration of competing interest
The authors declare that they have no known competing financial interests or personal relationships that could have appeared to influence the work reported in this paper.
Acknowledgments
This work was supported by National Natural Science Foundation of China(Grant No.51804318),the China Postdoctoral Science Foundation Founded Project (Grant No. 2019M650963) and National Key Basic Research and Development Program of China(Grant No.2014CB239203).
 Journal of Rock Mechanics and Geotechnical Engineering2021年5期
- Journal of Rock Mechanics and Geotechnical Engineering的其它文章
- Prediction of fracture and dilatancy in granite using acoustic emission signal cloud
- Hysteresis in the ultrasonic parameters of saturated sandstone during freezing and thawing and correlations with unfrozen water content
- Coupled Eulerian-Lagrangian simulation of a modified direct shear apparatus for the measurement of residual shear strengths
- A novel true triaxial test system for microwave-induced fracturing of hard rocks
- Hydromechanical behavior of unsaturated expansive clay under repetitive loading
- Laboratory large-scale pullout investigation of a new reinforcement of composite geosynthetic strip
