Nonlinear fluid flow through three-dimensional rough fracture networks:Insights from 3D-printing, CT-scanning, and high-resolution numerical simulations
Bo Li, Jifei Wng, Riheng Liu, Yujing Jing
a Key Laboratory of Rock Mechanics and Geohazards of Zhejiang Province, Shaoxing University, Shaoxing, 312000, China
b State Key Laboratory for Geomechanics and Deep Underground Engineering, China University of Mining and Technology, Xuzhou, 221116, China
c School of Engineering, Nagasaki University, Nagasaki, 852-8521, Japan
Keywords:Nonlinear flow 3D-printing CT-scanning Fracture network Permeability Fluid flow test
ABSTRACT Nonlinear flow behavior of fluids through three-dimensional (3D) discrete fracture networks (DFNs)considering effects of fracture number, surface roughness and fracture aperture was experimentally and numerically investigated. Three physical models of DFNs were 3D-printed and then computed tomography (CT)-scanned to obtain the specific geometry of fractures. The validity of numerically simulating the fluid flow through DFNs was verified via comparison with flow tests on the 3D-printed models. A parametric study was then implemented to establish quantitative relations between the coefficients/parameters in Forchheimer’s law and geometrical parameters. The results showed that the 3D-printing technique can well reproduce the geometry of single fractures with less precision when preparing complex fracture networks, numerical modeling precision of which can be improved via CT-scanning as evidenced by the well fitted results between fluid flow tests and numerical simulations using CT-scanned digital models.Streamlines in DFNs become increasingly tortuous as the fracture number and roughness increase, resulting in stronger inertial effects and greater curvatures of hydraulic pressure-low rate relations,which can be well characterized by the Forchheimer’s law.The critical hydraulic gradient for the onset of nonlinear flow decreases with the increasing aperture, fracture number and roughness,following a power function. The increases in fracture aperture and number provide more paths for fluid flow, increasing both the viscous and inertial permeabilities. The value of the inertial permeability is approximately four orders of magnitude greater than the viscous permeability, following a power function with an exponent α of 3, and a proportional coefficient β mathematically correlated with the geometrical parameters.
1. Introduction
The paths of fluid flow in rock masses are primarily constituted by three-dimensional (3D) fracture networks. Earlier works commonly employed a smooth parallel-plate model (PPM) to represent the geometry of single fractures in fracture networks,and emphasis was laid on assessing the impact of spatial distribution of fractures on the aggregate permeability and related hydromechanical coupling effects (Min et al., 2004). Natural rock fractures are formed by rough walls,leading to complex void space geometries that significantly influence the fluid flow and related transport and chemical reaction processes(Yasuhara et al.,2004;Li et al., 2008; Kang et al., 2016; Cao et al., 2018, 2019). Compared to the PPM, tortuous streamlines in natural fractures facilitate the onset of nonlinear flow and therefore complicate the related coupled processes, which have attracted much attention in recent engineering practice where the nonlinear flow is frequently encountered, such as water circulation in geothermal energy development and hydraulic pumping tests(Chen et al.,2015;Wang et al., 2020). A series of experimental, analytical and numerical simulation methods has been developed to investigate the nonlinear fluid flow behavior through fractured rock masses(Long et al.,1982; Zimmerman et al., 2004; Ishibashi et al., 2019; Zhang et al., 2021). The performance of these methods relays greatly on the precision in reconstructing the specific geometrical structure of void spaces in experimental and/or numerical models. Given the invisibility of internal structures of natural rock fractures,it is still a challenging issue to effectively prepare experimental and numerical fracture network models with realistic and measurable void space geometries, based on which the nonlinear flow behavior could be accurately estimated (Ishutov et al., 2015; Suzuki et al.,2017).
The complexity of void space geometries originates from the rough nature of fracture walls. The effect of fracture surface roughness on fluid flow and solute transport through single fractures has been extensively studied (Thompson and Brown, 1991;Boutt et al., 2006; Zhang and Chai, 2020). The surface roughness elongates streamlines due to tortuosity and enhances frictional pressure losses, resulting in a reduction in permeability in most conditions compared to the corresponding PPM (Konzuk and Kueper, 2004; Zou et al., 2017). Different parameters have been introduced into roughness estimations such as the joint roughness coefficient (JRC)(Olsson and Barton,2001),the standard deviation of local slope of fracture surface(Xiong et al.,2011),the root mean square of the first deviation of a profile (Wang et al., 2016), the fractal dimension (Li and Huang, 2015), the Hurst exponent (Liu et al., 2004; Ye et al., 2015), and the statistical amplitude parameter that quantifies the degree of deviation from the center plane(Xia et al.,2017).Based on these parameters,previous studies have attempted to modify the classic cubic law to better accommodate experimental and numerical simulation results(Olsson and Barton,2001; Rasouli and Hosseinian, 2011). Another factor that contributes to the reduction in permeability is the inertial effect at large Reynold numbers(Re)(Zimmerman et al.,2004).The inertial effect is the source of nonlinearity in the relation between hydraulic pressure drop and flow rate, and its magnitude is governed by Re and geometrical characteristics of void spaces in fractures (Zou et al., 2017). It has been reported that the permeability of roughwalled fractures is about 26%-80% of that of PPM due to the combined viscous and inertial energy dissipation (Huang et al.,2018). During a shear process, the critical Re or the critical hydraulic gradient for the onset of nonlinear flow gradually increases due to reductions in the internal contact number and area that result in the flow channelization, and the tortuosity (Xiong et al.,2011; Yin et al., 2017). The critical Re can vary from 0.001 to 25 experiencing 4 orders of magnitude with increasing shear displacement of 0-20 mm,which reveals the significant influence of shear-induced geometrical change on the transitional behavior between the linear and nonlinear flow regimes(Javadi et al.,2014).
To characterize the hydro-mechanical properties of fractured rock masses, the discrete fracture network (DFN) modeling approach has been developed,which can realistically represent the length, orientation and aperture of single fractures (Sharif et al.,2019). Two-dimensional (2D) DFNs with geometrical parameters obtained from outcrops or coring data have been commonly adopted in early works due to their simplicity in modeling and computation. The 2D DFNs are cutting slices of real fractured rock masses, which are not capable of characterizing the 3D geometry and connectivity of fractures, frequently leading to biased estimations of the permeability (Lang et al., 2014). 3D DFNs were thereafter being developed based on various approaches such as the boundary element method (Andersson and Dverstorp, 1987), the flux-averaging technique (Durlofsky, 1991), the pipe network element method (Dershowitz and Fidelibus,1999), and the hybrid finite element method (Erhel et al., 2009). In most models, single fractures were treated as PPMs and the aperture was homogenously distributed to facilitate computation (Koudina et al.,1998).Recent developments have focused on realistic representation of spatial heterogeneity of fractures and complex void space geometries that lead to flow channelization (Zhao et al., 2014; Ishibashi et al., 2012). Using these advanced models, more sophisticated processes in fractured rock masses such as multiphase flow and reactive transport were numerically studied(Hyman et al.,2015;Li et al., 2020). In the investigation of nonlinear flow through 3D fracture networks, the Navier-Stokes (NS) equations need to be solved based upon elaborately meshed void spaces of connected single fractures (Zhou et al., 2020). This results in heavy computational burdens that restrict most numerical models at laboratoryscale with a limited number of fractures (Liu et al., 2018).
In practice, the hydraulic pressure drop over a fractured rock mass domain and the corresponding flow rate are typically measurable variables,with which the permeability can be steadily obtained. The nonlinear relation between these two variables has been found to be well characterized by the Forchheimer’s law, in which coefficients A and B characterize the viscous and inertial flow components, respectively (Zimmerman et al., 2004; Zhang and Nemcik, 2013). A is the reciprocal of commonly defined transmissivity in the linear regime when the nonlinear term vanishes,which is typically several orders of magnitude smaller than B (Liu et al., 2020). Both A and B are sensitive to the void space geometry variations induced by confining stresses and/or shear processes.It has been reported that A and B can increase by 5 orders of magnitude with the increment of confining pressures from 1 MPa to 30 MPa,and they experience approximately 1-2 and 1-3 orders of magnitude reductions, respectively, as single fractures are sheared up to 10 mm (Zhou et al., 2015; Rong et al., 2016). A, according to its definition, is strongly correlated with the hydraulic aperture, and B has been found to be correlated with the peak asperity height on fracture surfaces following a power law relation(Chen et al., 2015). Except these two coefficients, other related variables such as the critical Forchheimer number and the Forchheimer coefficient were also defined to characterize the non-Darcy effect (Zeng and Grigg, 2006; Ranjith and Darlington,2007). A and B can be decomposed into a coefficient of viscous permeability (kv) and a coefficient of inertial permeability (ki),respectively. An extensive survey on their relations from available datasets in the literature revealed that kvand kican span 12 and 20 orders of magnitude, respectively, and kihas a power law relation with kvwith an exponent of 3/2 (Zhou et al., 2019). To date, however, quantitative relations between these coefficients with wellrecognized geometrical parameters of 3D fracture networks are still unclear, which restricts the engineering applications of Forchheimer’s law in fluid flow data interpretations.
To quantitatively characterize the relation between the key coefficients involved in the Forchheimer’s law and the geometrical parameters of 3D fracture networks, a computed tomography(CT)enhanced 3D-printing based experimental method was developed in the present study.A rough-walled 3D DFN with a side length of 400 mm containing 60 fractures was numerically generated. A cylindrical DFN with a diameter of 50 mm and a length of 100 mm containing ten fractures was extracted from the host DFN. Three cylindrical DFNs containing one, five and ten fractures were 3Dprinted and then CT-scanned to obtain the specific void space geometries.High-precision flow-through tests were conducted on the printed samples to obtain the relation between the hydraulic pressure and flow rate. Meanwhile, high-resolution numerical simulations solving the NS equations were performed to quantify the linear and nonlinear flow behaviors, which were compared to the experimental results to verify the validity of the developed method. With the obtained results, the relation between the inertial and viscous permeabilities,and the effects of aperture,surface roughness and fracture number on the critical hydraulic gradient were quantitatively analyzed and discussed.
2. Methodology
2.1. 3D discrete fracture network generation
A 3D DFN containing 60 fractures was generated using a selfdesigned Matlab code, as shown in Fig.1a. The side length of the cubic DFN is 0.4 m.Center points of the disk-shaped fractures were randomly and uniformly distributed in the space. The fracture orientation followed a normal distribution and the fracture length followed a power law distribution with a negative exponent(Bour and Davy, 1998; Reeves et al., 2013). The geometrical parameters were obtained from in situ survey at Beishan, China, which is a potential site for high-level radioactive waste repository. Two sets of fractures were considered, one of which strikes at N55.5°and dips at 71.9°, and another strikes at N307°and dips at 74.3°(Lei et al., 2016). Following a scale ratio of 100:1 between the prototype rock mass and the established DFN, an average trace length of 0.44 m was determined (Lei et al.,2016).
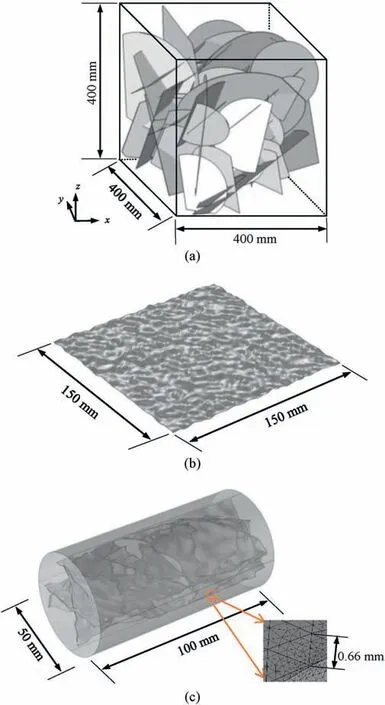
Fig. 1. Preparation of 3D fracture network models with rough surfaces: (a) A 3D fracture network model containing 60 fractures; (b) A randomly generated rough fracture surface (JRC = 15); and (c) A numerical model containing ten rough-walled fractures.
To fit the fluid flow testing apparatus, a cylindrical DFN containing ten fractures was extracted from the host DFN with a diameter of 50 mm and a length of 100 mm.For each fracture,the surface roughness was realized by assigning normally distributed local asperity heights to the two fracture surfaces. Given the popularity of JRC in the rock mechanics community, the mean JRC value of a series of cross-sectional profiles for each surface was calculated using the transformation from Z2to JRC(Myers,1962;Tse and Cruden,1979), where Z2is the mean square of the first derivative of a profile.Rough fractures with JRC values of 0,5,10,15 and 20 were prepared, where JRC = 0 corresponded to the PPM. This range was designed for covering most roughness degrees of engineering rock fractures.An example of the generated rough fracture surfaces with a JRC value of 15 is shown in Fig.1b and the corresponding DFN containing ten fractures is shown in Fig.1c. To take into account the effect of aperture,the two surfaces of each fracture were normally approached from a sufficient far distance and resulting models with mean apertures of em= 0.3 mm, 0.5 mm,0.7 mm and 1 mm were selected (Zou and Cvetkovic, 2020).
Except the roughness of single fractures,the number of fractures in a network is also an important geometrical factor.From the tenfracture cylindrical model,a one-fracture and a five-fracture model,were generated by randomly deleting small fractures while maintaining the large cutting-through fracture.In total,48 rough-walled 3D DFNs containing one, five and ten fractures with different roughness and apertures were generated. As shown in Fig. 2, the white circulars/ellipses represent the contacts with em= 0. The geometrical characteristics of the network become increasingly complex and the fractures occupy an increasing volume ratio with the increment of the fracture number. For comparison, 16 DFNs containing three, five, seven and ten fractures with each fracture being modeled by PPM were also prepared.
2.2. Preparation of physical models of 3D discrete fracture networks
The manufacture of well-designed and measurable fracture geometrical models has been a bottleneck in the hydraulic testing of fractured rock masses.Here,an integrated 3D-printing and X-ray CT method was developed. The numerically generated cylindrical DFNs mentioned above were exported as STL files and were then imported into an advanced 3D printer of Objet500 Connex3. This printer has a spatial resolution of 16 μm and is capable of precisely printing objects with multiple materials.A kind of transparent and hard photosensitive resin, VeroClear, with a density of 1.09 g/cm3,was selected to print the physical models.During printing,a kind of supporting material, SUP706b, with a density of 1.12 g/cm3, was used to fill the void spaces and uphold the model,which is a typical way to manufacture objects with internal voids.After hardening for 24 h, the printed models were immersed in a solution of NaOH,Na2SiO3and H2O with a mass ratio of 2:1:97. With the help of an ultrasonic cleaning device, most of the supporting material can be washed off from the void spaces. Three DFN samples containing one,five,and ten fractures,respectively,with a JRC value of 15 and a mean aperture of 0.5 mm were printed, as shown in Fig. 3a-c.
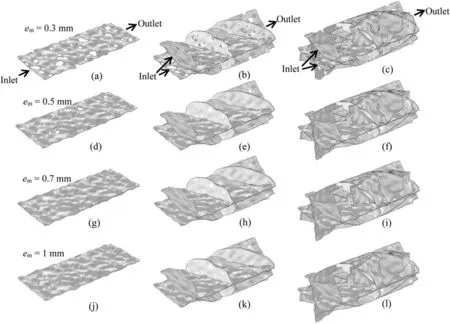
Fig.2. Geometries of numerical models with different mean apertures and different number of fractures.The first column(a,d,g,j)shows one-fracture models with the apertures of 0.3 mm, 0.5 mm, 0.7 mm and 1 mm, respectively. The second column (b, e, h, k) shows five-fracture models with the apertures of 0.3 mm, 0.5 mm, 0.7 mm and 1 mm,respectively. The third column (c, f, i, l) shows ten-fracture models with the apertures of 0.3 mm, 0.5 mm, 0.7 mm and 1 mm, respectively. The hollow ellipses are contact areas.
Significant spatial variations in the aperture field generate thin void layers (i.e. < 0.1 mm) filled with the supporting material,complete elimination of which is hard, if not impossible (Suzuki et al., 2017). The precision of 3D-printing is likely to descend when complex geometrical structures formed by intersected fractures are targeted. These may result in different void space geometries between the numerically generated DFNs and the printed samples.To confirm the quality of the printed DFNs, their internal structures were measured by a micro-CT scanning system, GE v|tome|x,with a spatial resolution of<1 μm.The system is composed of a nanofocus X-ray source,a sample scanning table,and an X-ray digital detection and data acquisition panel. The CT-scanned DFN samples were reconstructed from 1500 layers,as shown in Fig.3df. The red color represents the aperture field in fracture networks and the blue color represents the residual supporting material,the volume of which in fractures tends to increase as the fracture number increases. That is, the increased geometrical complexity results in greater differences between the numerically designed and 3D-printed DFNs. This process helped to obtain real void geometries of printed DFN samples, which could facilitate the subsequent comparison between testing and simulation results.
2.3. Fluid flow testing method and procedure
A schematic view of the fluid flow testing system is shown in Fig. 4. Three syringe pumps (D260, Teledyne) with a resolution of 0.001 mL/min were employed for injecting fluid flow and applying hydraulic pressures. Pumps A and B were utilized to provide axial and confining pressures, respectively. The fluid was injected into the model via pump C and the effluent was collected and weighted at the outlet using an electronic balance. Cross-checking the effluent rate and injection rate guaranteed the precise control of a constant flow rate without leakage. The hydraulic pressure difference between the inlet and outlet was measured by a differential meter(EJX110A, Yokogawa) with a resolution of 10 Pa.
Each 3D-printed sample was placed in a rubber cover and installed in the core holder.A confining pressure of 0.5 MPa and an axial pressure of 0.1 MPa were firstly applied to ensure the sealing of the sample.A constant flow rate of 10 mL/min was then injected into the model to expel the air until a saturated state was reached.The flow rate was restored to 0, and the fluid flow test was implemented with a series of incremental flow rates. At low flow rates, the pressure difference may drop to some values close or below the resolution of the differential meter.A kind of high-purity silicon oil was used as fluid instead of distilled water under low flow rate conditions to accurately measure the permeability in the linear regime.The flow rates of distilled water and silicon oil ranged in 1 ×10⁻⁸-3.3 ×10⁻⁶m3/s and 1 ×10⁻⁸-1 ×10⁻⁷m3/s, respectively, and their viscosities were 0.001 N s/m2and 0.043 N s/m2,respectively,at the room temperature.The density of the silicon oil was 836.1 kg/m3.
2.4. Governing equations and numerical simulation of fluid flow
For incompressible Newtonian fluid, the steady-state flow is governed by NS equations,which can be written as(Neuville et al.,2013):

where u is the flow velocity tensor,P is the hydraulic pressure,ρ is the fluid density,f is the body force tensor,t is the time,and T is the shear stress tensor.
When Re is sufficiently small,the nonlinear terms drop out.Eq.(1) reduces to the cubic law for single fractures (Zimmerman and Bodvarsson,1996):Fig. 3. 3D-printed models contains (a) one fracture, (b) five fractures, and (c) ten fractures,and their corresponding CT-scanned digital models with(d)one fracture,(e)five fractures, and (f) ten fractures. Red color represents the fractures and blue color represents the residual supporting material. The mean aperture is 0.5 mm for these samples.

where Q is the flow rate,w is the fracture width,ehis the hydraulic aperture,μ is the dynamic viscosity, and ΔL is the fracture length.
With the increases in the flow rate and Re, the inertial effects gradually become significant, leading to the nonlinear relation between the hydraulic pressure drop and the flow rate,which can be well quantified by the Forchheimer’s law (Bear,1972; Zeng and Grigg, 2006; Cardenas et al., 2009; Javadi et al., 2014):

where A and B are the coefficients of linear and nonlinear terms,respectively;v is the volumetric flux per area;and kvand kiare the viscous and inertial permeabilities with units of m2and m,respectively.
Considering the unification of dimensions, the relationship between kvand kican be quantified by(Ghane et al.,2014;Zhou et al.,2019):

where α and β are the coefficients with units of 1 and m1-α,respectively.
To address the nonlinearity of fluid flow,a nonlinear factor Nfis defined as (Javadi et al., 2014):

This equation quantifies the proportion of nonlinear component in the total flow rate and it is widely accepted that when Nf= 0.1,the fluid flow transits from a linear regime to a nonlinear regime(Zimmerman et al., 2004). The corresponding hydraulic gradient J,which is linearly correlated with the hydraulic pressure drop as J = ρg(dP/dL), is defined as the critical hydraulic gradient Jc. Note that the critical values of Nfare varied according to the requirements of a specific problem, such as 0.05 (Wang et al., 2016)and 0.01 (Liu et al.,2016).
According to Darcy’s law, the equivalent permeability, K, of a DFN can be calculated by

where Adis the cross-sectional area of a DFN that equals πr2= 1.96 × 10⁻³m2for the cylindrical samples, where r is the radius.
Fluid flow simulation by solving NS equations was implemented using COMSOL Multiphysics, which is a widely accepted platform for estimating the fluid flow behavior and associated mass transport,heat transfer and chemical reaction processes(Cardenas et al.,2007).Fluid flow through the 48 rough-walled models and 16 PPMs was simulated.The CT-scanned void space geometries of the three printed samples (Fig. 2) were also numerically modeled and the simulation results were compared with the testing results to verify the validity of the developed method. The two opposite circular faces of the cylindrical model were set as inlet and outlet boundaries, respectively, and other boundaries were impermeable. The flow rate imposed on the inlet of numerical models ranged in 1×10⁻⁹-4×10⁻⁵m3/s and the corresponding pressure difference was recorded to estimate the entire transition from linear to nonlinear flow regimes. The sampling interval of geometrical models was 0.66 mm, which was further triangularly meshed in COMSOL (Fig. 1c). For the model containing ten fractures, there were 3,482,985 meshes and a computing time of 5.5 h was required for a simulation case on an i7 cored computer. Based on the simulation results,the effects of mechanical aperture(em),number of fractures (N), JRC and relative standard deviation (RSD) on the evolutions of kv, ki,α,β, and Jcwere analyzed.
3. Results and analysis
3.1. Comparison between experimental and numerical simulation results
The experimental results obtained from the 3D-printed samples and their corresponding numerical simulation results using the numerically generated model (NGM) for 3D-printing and the subsequently CT-scanned model (CTM) of printed samples are shown in Fig.5.The Arabic number in the case label represents the number of fractures included in a model. The silicon oil was utilized for obtaining the linear part and the distilled water was utilized for testing the nonlinear part with greater flow rates. The overlapped parts between the testing results of the two fluids indicate that the fluid flow system yields reliable permeability of a DFN regardless of fluid types.
It is obvious that K increases as N increases due to the expanded flow paths. K is a constant for each case when Q is small(i.e. < 1 × 10⁻⁷m3/s), indicating that the flow is in the linear flow regime, which is well captured by the silicon oil flow.The curves start to bend downwards when Q is greater than around 1×10⁻⁷m3/s,at which the transition from linear to nonlinear flow regime is triggered. The curvature of the nonlinear parts becomes steeper as N increases, suggesting that the nonlinear behavior is correlated with the complexity of fracture geometries.
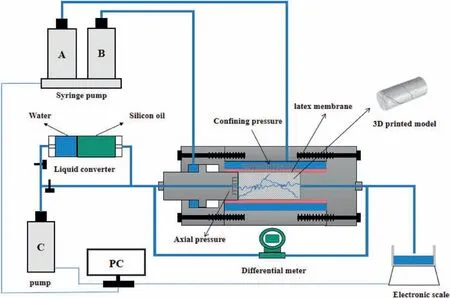
Fig. 4. Schematic view of the fluid flow testing system.
The experimental results agree well with the numerical simulation results obtained from both NGM and CTM when only one fracture exists, revealing that the 3D-printing technique can well reproduce the designed fracture geometry for single fracture models.However,deviations become increasingly obvious between experimental and NGM simulation results as N increases, which is consistent with the CT-scanned results shown in Fig. 2 that more supporting material tends to remain in the model as N increases.The 3D-printing technique still faces significant challenges when preparing DFN samples with complex internal structures. The residual supporting material in small void spaces and the errors induced by printing multiple intersections are the main sources of deviations.In contrast,the experimental results agree well with the simulation results of CTM for all cases, suggesting that the CT enhanced modeling technique can provide accurate representations of the internal void geometries of fractures and reliable nonlinear flow behavior estimations.This agreement also validated the numerical modeling method in terms of rough-walled DFN generation, meshing, and fluid flow simulation by solving NS equations, which was employed in the subsequent parametric study to investigate the impact of fracture geometrical characteristics on the nonlinear flow behavior.
3.2. Flow field distributions
The streamline distributions through DFNs containing one,five and ten fractures with JRC=5 and 15,when Re=0.025 and 100,are shown in Fig.6.For the one-fracture model with JRC=15,the fluid flow only takes place within the fracture plane through a few major channels,which bypasses the contact spots with strong tortuosity.Comparatively, the flow field is more homogenous with less tortuosity when JRC = 5. Such flow field distributions highlight the impact of void space geometries on the fluid flow through single fractures. For the models with multiple fractures, the fluid flow takes place in all connected fractures with more complex flow fields than that of the one-fracture model. Except the cuttingthrough fracture (i.e. the one-fracture model), major flow channels also appear in the intersected fractures. The fracture intersection therefore is another important factor that renders the flow streamlines tortuous.
The main flow paths and streamline distributions are similar for the cases with different Re values. At large Re, eddy flow becomes obvious at positions with remarkable local aperture variations,e.g.,bottleneck-shaped locations. Fewer streamlines can penetrate the model and reach the outlet boundary due to the appearance of eddy flow. The streamlines tend to concentrate in straight paths while the tortuous flow paths are weakened. These bring extra energy dissipations that result in reduced K as shown in Fig.5.The geometrical parameters to be developed to characterize the nonlinear flow need to systematically take into account the characteristics of each single fracture and the spatial combinations of all fractures.
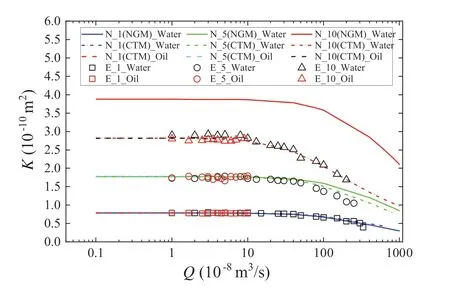
Fig. 5. Relations between K and Q obtained from experiments (E) and numerical simulations (N). NGM stands for the numerically generated models for 3D-printing,and CTM stands for the subsequently CT-scanned models of printed samples. The number included in each label stands for the number of fractures.
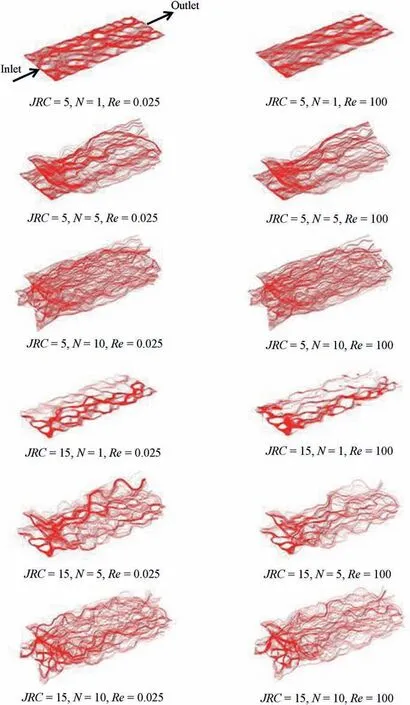
Fig. 6. Streamlines in DFNs with different values of N, JRC and Re.
3.3. Relations between Jc and geometrical parameters
The determination of the critical hydraulic gradient, Jc, is of special importance for selecting appropriate governing equations in permeability estimations. When the applied J is less than Jc,linear governing equations such as the cubic law could be employed. When J is greater than Jc, the NS equations need to be solved to achieve an accurate flow field calculation and the Forchheimer’s law can be utilized to quantify the nonlinear hydraulic pressure and flow rate relations.Re is a localized parameter that may vary at different locations in a network.In contrast,J is a macroscopic parameter that possesses a unique value for a network, the critical value of which is therefore more appropriate to characterize the transitional behavior of fluid flow in fracture networks.To facilitate engineering applications,a widely employed parameter, JRC, was selected as a geometrical parameter to represent the fracture surface roughness. The number of fractures in a model, N, was also selected because it is proportionally correlated with the intersection number.
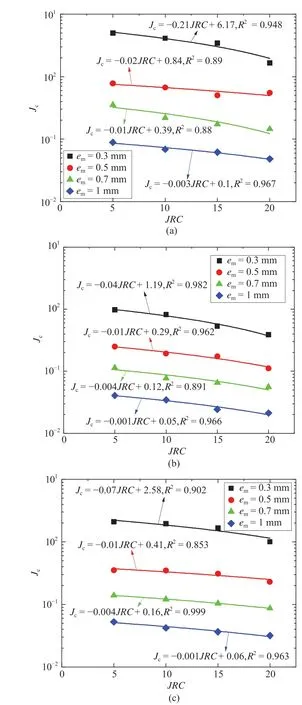
Fig. 7. Variations in Jc versus JRC for models with different number of fractures: (a)N = 1, (b) N = 5, and (c) N = 10.
Fig. 7 shows the relations between Jcand em, N and JRC. Jcdecreases almost linearly with the increasing JRC,which is in concert with the common knowledge that a complex fracture geometry can easily trigger the onset of nonlinear flow at a small flow rate or Re.With the increment of N, Jcgently decreases and the descending rate is more remarkable for relatively smooth fractures. Since the flow rate is correlated with the cube of em,the increase in emresults in a remarkable reduction in Jc,following power functions.In total,Jcranges in 0.02-5,and is mostly sensitive to the aperture,followed by the roughness and fracture number.These results indicate that Jcis inherently correlated with Re that changes proportionally with the cube of em.
JRC quantifies the original roughness of fracture walls,which is an indirect parameter for characterizing the resulting void space geometries.Alternatively,the dimensionless parameter RSD of local apertures is more suitable because it quantifies the relative surface roughness compared to the magnitude of aperture. For a pair of rough surfaces,the effect of roughness gradually diminishes as the aperture increases, which can be well characterized by RSD. Via a systematic analysis of the relation between Jcand geometrical parameters shown in Fig. 7, the following regressive expression was obtained:

Comparison of the prediction by Eq.(7)and computed results is shown in Fig. 8. This relation indicates that Jcis more sensitive to RSD than to N. Note that for a single PPM (i.e. RSD= 0 and N = 1),the nonlinear flow will not occur in the ranges of Re or J concerned here.Therefore,this expression does not apply to such conditions.
3.4. Relations of kv and ki with geometrical parameters
The calculated flow velocity,v,and the pressure gradient,dP/dL,were substituted into Eq. (3) to obtain the values of kvand ki. As shown in Fig. 9, both kvand kiincrease with the increasing em,following power law functions and the exponents show a roughly descending trend with the increasing N. The value of kvis about 4 orders of magnitude smaller than that of ki. kvexhibits a linear relation with N, while kiexhibits an exponential relation with N(see Fig.9c and d),revealing that kiis more sensitive to the fracture number than kv.As demonstrated in Fig.6,the tortuosity of flow is enhanced as JRC increases,resulting in the exponential decreases in both kvand ki(see Fig.9e and f).The decreasing rate of kiis greater than that of kv,suggesting that the nonlinear term is more sensitive to the fracture roughness. Taking N = 10 as an example, kvdecreases from 8.35×10⁻¹⁰m2to 2.38×10⁻¹⁰at a rate of 71.5%,while kidecreases from 2.46×10⁻⁵m to 1.09×10⁻⁶m at a rate of 95.57%.Analogously, kvand kidecrease with the increasing RSD, following power law and exponential functions,respectively(Fig. 9g and h).
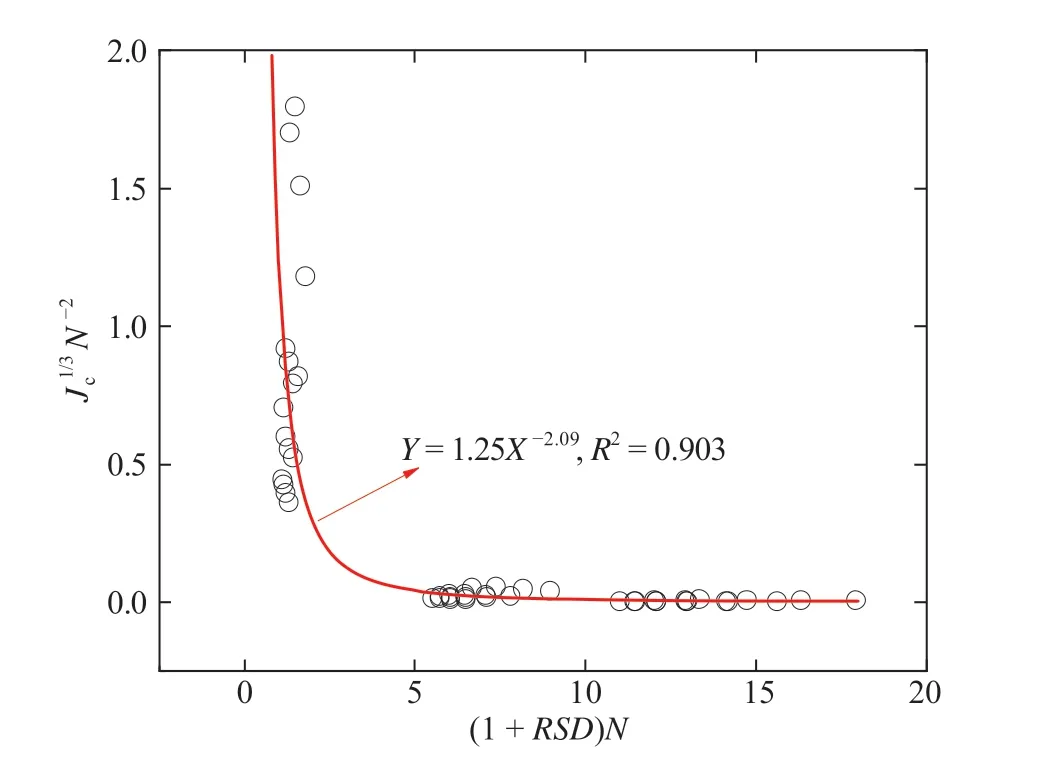
Fig. 8. Relation between Jc and RSD and N obtained from regression analysis for all computed cases.
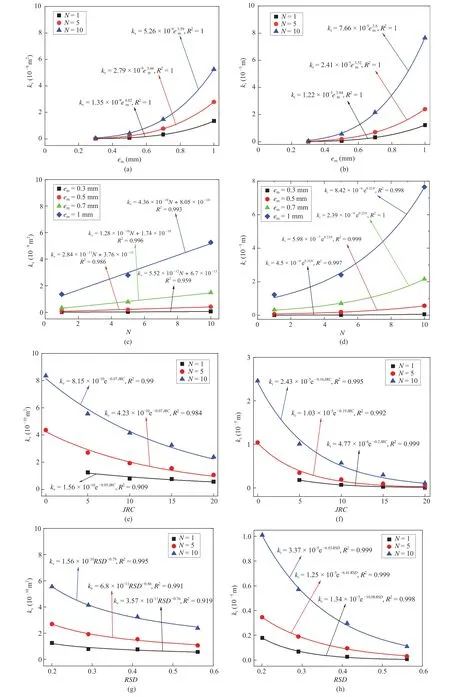
Fig.9. Influences of em,N,JRC and RSD on kv and ki:(a)Relation between em and kv(JRC=10);(b)Relation between em and ki(JRC=10);(c)Relation between N and kv(JRC=10);(d)Relation between N and ki(JRC=10);(e)Relation between JRC and kv(em=0.5);(f)Relation between JRC and ki(em=0.5);(g)Relation between RSD and kv(em=0.5);and(h)Relation between RSD and ki (em = 0.5).
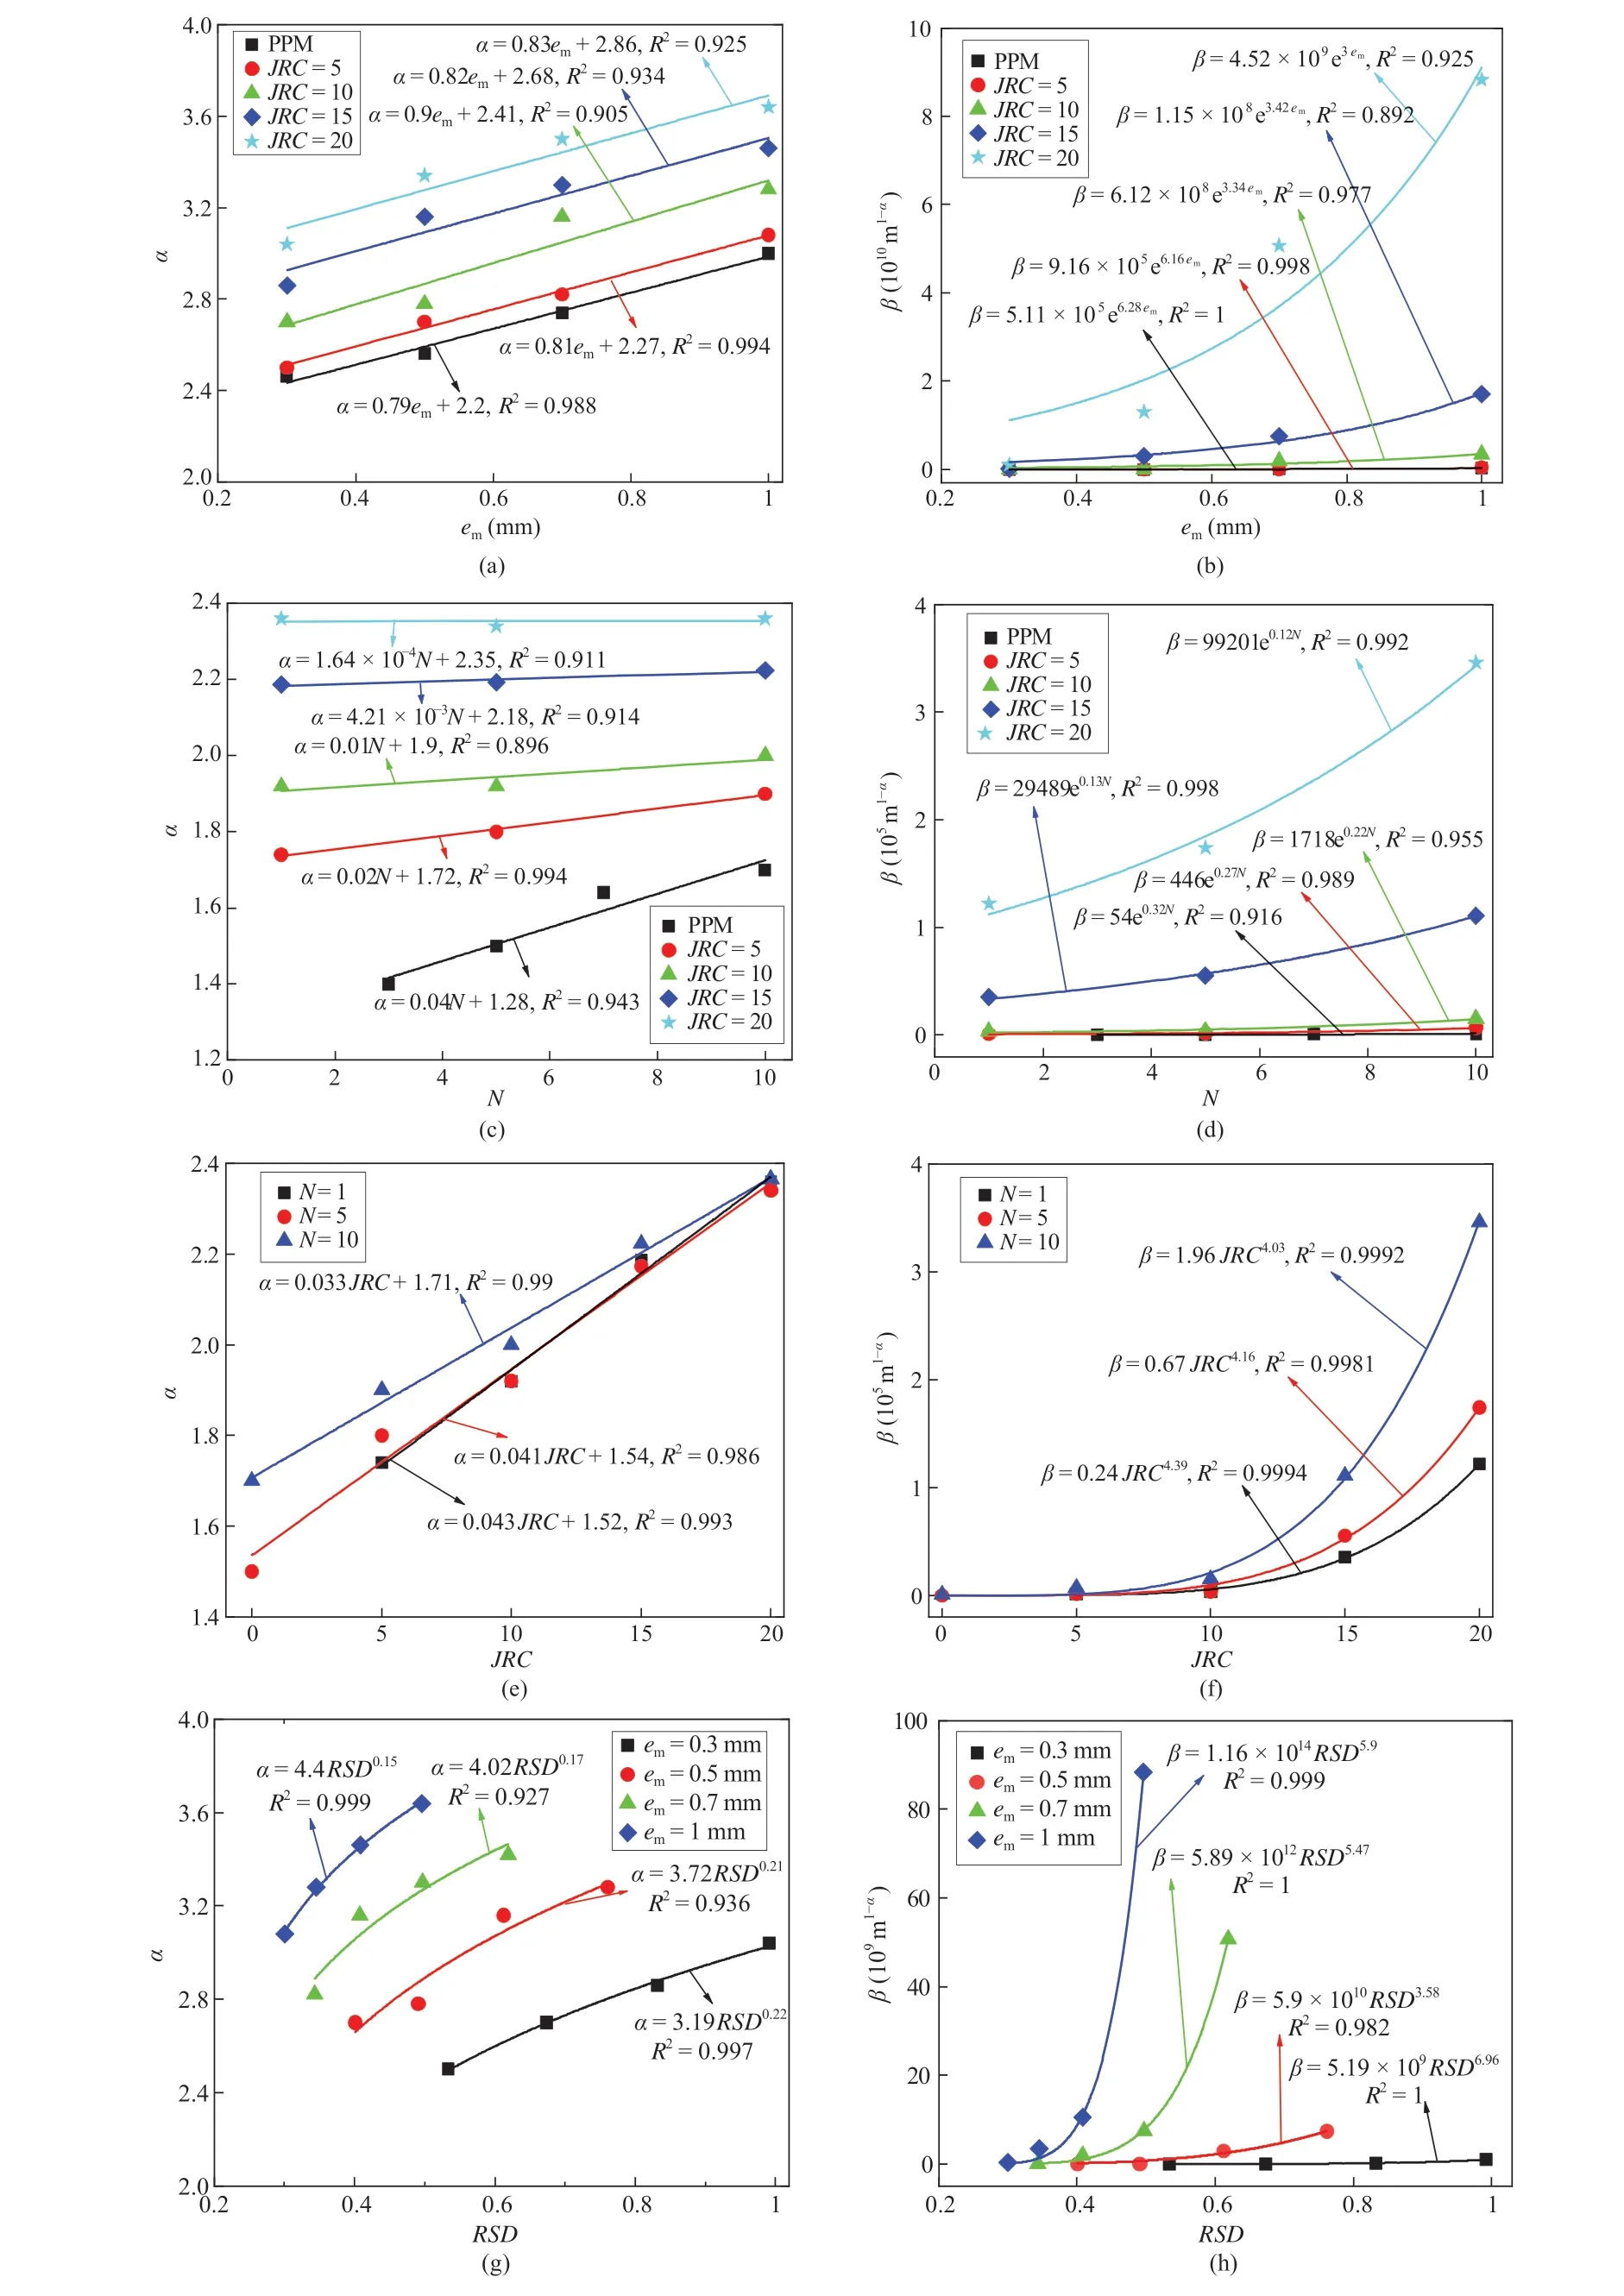
Fig.10. Influences of em,N,JRC and RSD on α and β:(a)Relation between em and α;(b)Relation between em and β;(c)Relation between N and α;(d)Relation between N and β;(e)Relation between JRC and α; (f) Relation between JRC and β; (g) Relation between RSD and α; and (h) Relation between RSD and β.
3.5. Relations of α and β with geometrical parameters
The above results show that kvand kiexhibit analogous trends with the changing geometrical parameters. Eq. (4) indicates that their specific relation is characterized by the coefficients α and β.Here, relations of α and β with geometrical parameters were analyzed to reveal their quantitative correlations and the results are shown in Fig. 10. Both α and β increase with the increasing em,following linear and power law functions,respectively.The slope of the α-emstraight lines exhibits a similar value of around 0.41 for the cases with different JRC values, while the curvature of β-emcurves changes robustly as JRC changes. α increases linearly and β increases exponentially as N increases from 1 to 10.The slopes of the α-N straight lines decrease with the increasing JRC and gradually approach 0, indicating that α is no longer sensitive to the fracture number when the fractures possess large roughness. N only has impacts on β at large value of JRC(i.e.>10).With the increase in JRC,both α and β increase following linear and power law relations,respectively.The JRC has a negligible influence on β when JRC<10,yet significantly affects β when JRC ≥10.This agrees with the trends shown in Fig. 9 that the nonlinear term is more sensitive to roughness than that of the linear term.α increases at a descending rate following a power law function, while β increases at an increasing rate also following a power law relation, as RSD increases.The exponent in the α-RSD relation is smaller than 1 while that for the β-RSD relation is greater than 1, exhibiting curving downwards and upwards trends, respectively. In total, the exponent term α varies in a small range between 1.6 and 3.6, while β spans over 5 orders of magnitude.
The relation between kvand kifor all computed cases is plotted in Fig.11.The data well fit a power function as indicated by Eq.(4)(Cherubini et al., 2012; Ghane et al., 2014; Chen et al., 2015), in which kiand kvspan 5 and 3 orders of magnitude,respectively.The best-fitted regression reveals a value of α of 3 with R2= 0.895,which agrees with the previously reported value(Zhou et al.,2019).The value of 3 was then mandatorily assigned to α,and the value of β was recalculated to maintain a uniform unit of m-2for all cases.Under this condition,β was found to possess a power relation with a lumped geometrical parameter as (see Fig.12):


4. Conclusions
The nonlinear fluid flow characteristics of 3D DFNs were studied bymeans of 3D-printing,CT-scanning,fluid flowtests and numerical simulations.A series of DFNs was numericallygeneratedandthreeof them containing one,five and ten rough-walled fractures were 3Dprinted and subsequently CT-scanned. Fluid flow tests were conducted on the printed samples and the results were compared to numerical simulation results obtained from numerically designed and CT-scanned geometrical models. Through a parametric study,the influences of fracture surface roughness, number of fractures and fracture aperture on the streamline distribution, viscous and inertial permeabilities and critical hydraulic gradients were quantitatively analyzed.The following conclusions were drawn:
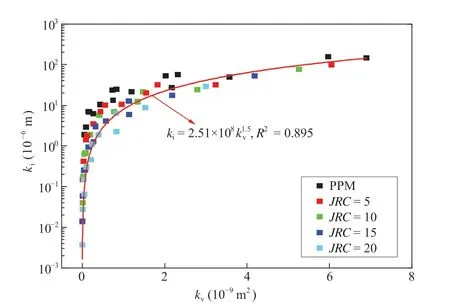
Fig. 11. Regressive relation between kv and ki represented by a power function obtained from all computed cases.
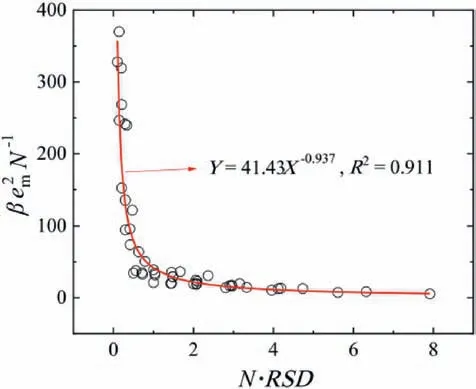
Fig. 12. Regressive power function between β and geometrical parameters obtained from all computed cases.
(1) The 3D-printing technique can well reproduce the geometrical characteristics of single rough-walled rock fractures while the precision tends to descend when models with multiple fractures and intersections are prepared. Multifracture DFN models can be CT-scanned to obtain the real fracture geometries and the resulting high-resolution numerical models yield consistent results with the fluid flow tests by solving NS equations.
(2) The critical hydraulic gradient for the transition from linear to nonlinear flow decreases with the increasing aperture,roughness and number of fractures.Of the three parameters,the first one can increase the local Reynold numbers under a constant hydraulic gradient,while the latter two enhance the tortuosity of streamlines in 3D space,which are main sources for the onset of nonlinear flow. Their relation can be well characterized by a power function.
(3) The inertial permeability increases with increasing viscous permeability, following a power function with an exponent of 1.5(i.e.α=3),which is consistent with that reported in the literature. The values of kiare approximately four orders of magnitude greater than those of kv. The proportional coefficient β is correlated with the RSD of local apertures and the fracture number following a power function.
Limited by the computational capacity, the present DFNs are small in dimension and only contain a maximum of ten fractures.These laboratory-scale DFNs can help to reveal the fundamental nonlinear flow behaviors,however,a huge gap still exists between the laboratory- and field-scale problems. The applicability of established quantitative relations needs to be verified against fieldscale measurements and/or simulation results in future studies.Besides, 3D-printing technique can be used to prepare fracture network models with infillings of different degrees to investigate their effects on fluid flow.
Declaration of competing interest
The authors declare that they have no known competing financial interests or personal relationships that could have appeared to influence the work reported in this paper.
Acknowledgments
This study has been partially funded by the Natural Science Foundation of Zhejiang Province(Grant No.LR19E090001)and the Natural Science Foundation of China (Grant Nos. 42077252,42011530122, and 51979272). These supports are gratefully acknowledged.
 Journal of Rock Mechanics and Geotechnical Engineering2021年5期
- Journal of Rock Mechanics and Geotechnical Engineering的其它文章
- Surface characteristics analysis of fractures induced by supercritical CO2 and water through three-dimensional scanning and scanning electron micrography
- Prediction of fracture and dilatancy in granite using acoustic emission signal cloud
- Hysteresis in the ultrasonic parameters of saturated sandstone during freezing and thawing and correlations with unfrozen water content
- Coupled Eulerian-Lagrangian simulation of a modified direct shear apparatus for the measurement of residual shear strengths
- A novel true triaxial test system for microwave-induced fracturing of hard rocks
- Hydromechanical behavior of unsaturated expansive clay under repetitive loading
