Sources of variability in laboratory rock test results
Rashi Granmayh Vanghi, Sy Eran Sabrhossini, Aray V. Dyskin,Klaus Thoni, Mostaa Sharizah, Mohamma Sarmaivalh
a WA School of Mines: Minerals, Energy and Chemical Engineering, Curtin University, Kalgoorlie, WA, 6430, Australia
b Northern Star Resources, Kalgoorlie, WA, 6430, Australia
c Science and Research Branch, Islamic Azad University, Tehran, Iran
d School of Civil, Environmental and Mining Engineering, The University of Western Australia, Crawley, WA, 6009, Australia
e Centre for Geotechnical Science and Engineering, The University of Newcastle, Callaghan, NSW, 2308, Australia
f WA School of Mines: Minerals, Energy and Chemical Engineering, Curtin University, Kensington, Perth, WA, 6151, Australia
Keywords:Rock property variation Uniaxial compressive strength (UCS)Specimen preparation End flatness Loading equipment precision Pre-existing microcrack
ABSTRACT Appropriate rock characterization is beneficial in providing a reliable judgment on rock properties which is crucial for the design process of rock engineering applications. However, it can be difficult to obtain consistent mechanical parameters due to substantial variations in rock properties. In this research,uniaxial compression tests on dolerite specimens collected from a gold mine in Western Australia showed substantial scatter in the results. Rock categorization based on the P-wave velocities is as accurate as the thin section analysis,which suggests that they can be used together to gain a more accurate initial understanding of the rock types before any laboratory testing.The quality of specimen preparation and rock-machine interaction greatly affect the test results. For instance, non-parallelness of loading platens can lead to considerable scatter of the testing results, which would be perceived as rock variability. It is suggested that the current testing standards should be modified towards a better control of the loading machine performance and equipment precision. Finally, the possibility of pre-existing microcracks in rock, neither detected by the thin section analysis nor by the ultrasonic measurement,must be examined by computed tomography(CT)scanning as they can affect the test results. This study will enhance our knowledge about the sources of variability in laboratory test results of rock which is essential for obtaining reliable data.
1. Introduction
Rocks are very complex and require a precise and meticulous identification of their physical and mechanical properties. Valid inspection, examination and testing methods are needed in order to gain such an understanding of rock characterization. It is essential for a rock mechanics engineer to have accurate and comprehensive information about the rock material for design and for dealing with engineering challenges of rock structures. Thanks to the technological developments and invention of new testing devices, rock characterization methods have been changed and developed remarkably within the last decades. However, some uncertainties still exist about the rock characterization since there are several variability sources affecting its behavior.Some of these variabilities are associated with the rock itself such as lithology,microstructural features, porosity, water content and how much and how long it has been under the stress and weathering conditions. Other factors are the size and shape dependency of rock specimens as well as the testing and examination conditions.
Different sources of variability have been considered by Hadjigeorgiou and Harrison (2011). These are associated with the data collection, rock testing methods, equipment precision, and in some cases inappropriate methods implemented in numerical analysis. Furthermore, another type of variability or uncertainty,called systematic uncertainty, also becomes noticeable when the data obtained from the laboratory scale are used for rock engineering designs at in situ scale(Duzgun et al.,2002).More recently,different sources of uncertainties specifically integrated in practical application of slope stability analysis have been defined and reviewed in an investigation by Abdulai and Sharifzadeh(2019).
The variability sources differ in different stages of the laboratory tests.As illustrated in Fig.1,the variability in test results may stem from different sources before the experiment,during the specimen preparation, during the testing itself, and finally during the data analysis.Therefore,the variability sources could be inherent(rockbased),specimen-based,machine-based,or statistical.The effect of these sources during each stage, individually, may not be significant,but the effects of these sources are cumulative with noticeable interaction effects. It should be noted that the core taking process including the drilling-induced damage and orientation of core may also contribute to sources of variabilities.However,since all tested specimens were taken from the same core trays, this factor is not further considered.
To date,several studies have attempted to investigate the effect of the variability on rock strength. In these studies, the uncertainties in the estimation of shear strength of the rock discontinuities have been quantified using the probabilistic approach(Duzgun et al.,2002).The contributions of the uncertainty sources coming from the measurements of the specimen dimensions,flatness, parallelism, rounding, calibration, and resolution of the instruments and transducers in the determination of the unconfined compressive strength (UCS) of rocks were also analyzed(Kuhinek et al., 2011). It was found that these variabilities contribute to less than 1%of the uncertainty of the UCS for the rocklike materials with more than 118 MPa of the UCS values.Similarly,it was pointed out that the scattering in the rock UCS values showed a decreasing trend with an increase in the rock strength so the stronger rocks should give very close test data (Rohde and Feng,1990). There have also been some attempts to determine the minimal number of specimens needed to reduce uncertainties in the rock mechanical properties obtained from the tests (Gill et al.,2005; Ruffolo and Shakoor, 2009).
The effect of the specimen shape(Liang et al.,2016;Xu and Cai,2017a) and size on the rock strength has been studied by many researchers ((Tsur-Lavie and Denekamp, 1982; Labuz and Biolzi,2007; Masoumi et al., 2016, 2017a, b), whereas it has been pointed out that there are still potential avenues for further investigation in this area (Roshan et al., 2016). Prakoso and Kulhawy (2011) investigated the relation between rock strength,specimen diameter and moisture content. The effect of the specimen cross-sectional shape on its strength was investigated both numerically and experimentally. It was shown that the specimen cross-sectional shape had minor effect on its peak strength while noticeably affecting the post-peak behavior. Interestingly, it was shown that a square prism specimen was stronger than a cylinder specimen with the same height to diameter (or height to width) ratio (Xu and Cai, 2017a). More recently, the specimen height to diameter ratio and cross-section were shown to control the rock mechanical properties and damage thresholds (Du et al.,2019).
ASTM D4543-08 (2008) and ISRM (1979) standards specify a procedure for preparation of rock specimens for testing purposes considering the dimensional tolerances. The effect of specimen shape deviations including the specimen end flatness, parallelism,and perpendicularity on the rock UCS was also investigated(ˇStambuk Cvitanovi'c et al., 2015; Nikoli'c et al., 2018). It was reported that the parallelism of the ends and the specimen axis perpendicularity do not considerably affect the UCS value,whereas the effect of the end flatness could be significant. The acceptable tolerance of the end flatness, however, has been optimized to be 60% higher than that specified in the existing standards (ˇStambuk Cvitanovi'c et al., 2015). The specimen end preparation was reported to greatly affect the UCS of concrete specimens and the degree of this influence depends upon the thickness of the machine end caps (Carino,1994).
There were also some attempts to address the machine-based variabilities (Brady, 1971; Hudson et al., 1972; Hemami and Fakhimi, 2014; Xu and Cai, 2017b; Gao et al., 2018). For instance,the effect of insert materials on the elastic behavior of rock specimens under the axial compression was investigated by Brady(1971), who suggested that the low-modulus inserts should be avoided in such testing. This was also discussed in another investigation(Hudson et al.,1972),as well as the advances in rock testing machine technologies which was a great step forward in rock testing. The loading frame-rock specimen interaction was also studied numerically, considering the effect of any variation of specimen dimension, end platen friction, and the loading frame stiffness on the rock strain response (Gao et al., 2018). Friction between the rock specimen ends and the loading platens was found to control the size effect of the rock specimens under compression test,indicating that the specimen size effect on UCS values could be negligible if the end friction is removed (Hemami and Fakhimi,2014). The end frictional effect decreases in rock specimens with high aspect ratio (Gao et al., 2018).
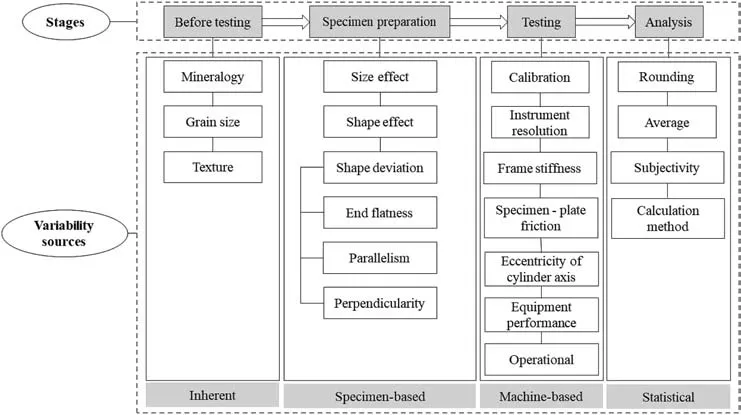
Fig.1. Different sources of variabilities for the rock laboratory test results.
All these factors are usually checked at the first stages of the experiments.However,it is unclear how such variabilities affect the final laboratory test results. It seems that more considerations should be taken into account beyond the ordinary visual inspections of the rock specimens and checking the existing controlling instructions of the rock testing equipment. Using experiments on rock and aluminum specimens of equal dimensions, this paper discusses some sources of variability that could potentially cause scatter of the UCS values.
Inherent variabilities of rock such as mineralogy,grain size,and texture are the first parameters commonly determined by the microscopic examinations. The testing conditions and rockmachine interaction will be considered as other sources of variability; these are usually presumed to be the same for all tests.However, they may differ from one rock type to another, and can interact with other testing conditions as well. This study seeks to explain why and how these parameters should be checked if such scattered test data are obtained. It should be noted that the variability due to the data analysis, calibration, instrument resolution,frame stiffness, specimen-loading platen friction, specimen size effect and shape effect are not considered in this study since some of them (like the size and shape effects) are not supposed to be noticeable for these experiments and the rest were consistent for all conducted tests.
This paper also discusses the importance of additional examinations that need to be considered for any rock testing to have valid design parameters. This implies the necessity of having a good controlling guideline, which is discussed later in this paper considering the main sources and effects of variability on the UCS results.Different examination techniques were used for this purpose to find out the reasons and the inherent sources or external factors behind the obtained scattering of the UCS values. Both quantitative and qualitative approaches are used in this paper to address this issuewhich is of great importance in a rock testing applicable to all mining,petroleum and geotechnical engineering fields.
The specimen preparation and the UCS results for the tested rock specimens are presented in Section 2. Section 3 discusses the examination of the rock inherent variability and the categorizations based on the results of the measurements. Section 4 describes the control tests carried out to assess the testing conditions and the reasons for such external factors to be checked before rock testing.The effect of testing condition, specifically loading platen defects,on the test results is numerically investigated in Section 5.Section 6 discusses the computed tomography (CT) scanning technique as a useful tool to check for pre-existing microcracks. Finally, conclusions are provided in Section 7.
2. Rock testing
2.1. Specimen preparation
Dolerite rock cores have been collected from the Enterprise gold mine located northwest of Kalgoorlie, Western Australia. After visual inspection of the rock cores,88 dolerite specimens have been prepared,with 50.5 mm in diameter and a length to diameter ratio of 2≤L/D<2.3, and with similar visual mineralogy. All these specimens were taken from adjacent core trays. The average density of these specimens was 2958 kg/m3. The rock specimens have been prepared according to ASTM D4543-08 (2008) and ISRM (1979).Efforts have been made during specimen preparation to grind specimens to flatness tolerance specified by these relevant standards. However, the best flatness obtained for these specimens after several times of grinding was less than 0.004 in (102 μm)while it should have been less than 0.001 in (25 μm) according to the mentioned practices.The required flatness for these specimens could not be achieved by the grinding machine used.This is mainly because of the hard minerals within the rock texture inter-grown with other minerals of different hardnesses. The grinding wheel or component misalignment might also have affected the grinding precision. It is usually more difficult to obtain the desired flatness for hard rocks than it is for soft rocks.In the next sections,the effect of the end flatness on the obtained results will be discussed to determine if variation of end flatness is the root causing the discrepancy in the test results.
2.2. Uniaxial compression test
Five specimens were selected for the uniaxial compression testing to obtain a statistically representative value for UCS (Fig. 2).These specimens were first checked to ensure that they did not have any visible defects.Their textures were then visually inspected based on their appearances in terms of differences in their textures, grain sizes, and colors in general. A uniaxial testing machine of 600-700 kN/mm stiffness,with a computer-controlled axial actuator,was used for this test. The deformation of the specimens was recorded using two rosette strain gauges attached on the middle of the two sides of the specimen surface opposite to each other. Each strain gauge recorded both horizontal and vertical strains. A data logger with nonlinearity of 0.1%frequency of sampling was used for strain data recording. It should be mentioned that lubricant was used to minimize the effect of friction between specimen and loading platen.
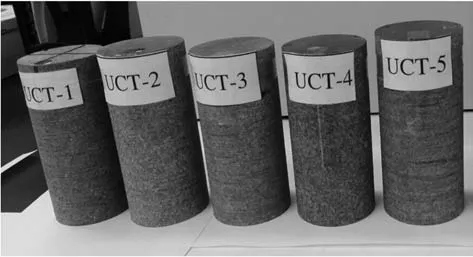
Fig. 2. Dolerite specimens prepared for the uniaxial compression tests.

Table 1 UCS of the tested specimens.
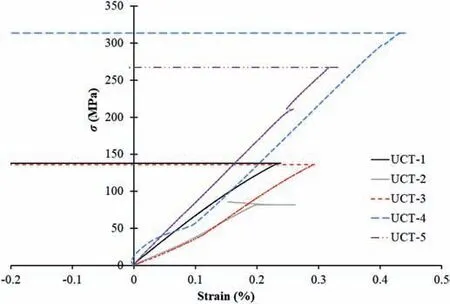
Fig.3. Stress-strain curves for the uniaxial compression tests on dolerite specimens.σ is the UCS.
Table 1 gives information about the rock specimens, obtained UCS, and a classification made on the tested rock specimens simply based on their visible textures. These specimens were visually classified into different groups (4, 5, and 1) simply based on judgments a geologist usually makes during the rock core selection for the experimental testing. It should be noted that no specimen was taken from Category 2 since it was visually different from the other categories.The stress-strain curves for these tests are shown in Fig.3.Since all samples are from hard rock and tested under load-control condition, all tests stopped at the failure points and no post-peak part of the stress-strain curves is available for these curves.As can also be seen,the measured values of the UCS of the tested specimens are greatly scattered from 86 MPa to 315 MPa, with almost 270% difference.The specimens failed at totally different peak stresses even though they were of the same visual categories.By taking specimens UCT-1,UCT-2 and UCT-3 for instance, their obtained UCS values differ by about 60% although they all belong to the same category (rock type 4). Thus, it is not clear why a strong rock,such as dolerite,produces such a scatter of UCS values,while it usually has very few flaws,which are the main sources of such discrepancy. This is against reported results(Rohde and Feng,1990)which indicate that measured UCS values for stronger rocks should be very close,with only small deviations from the mean value. On the other hand, it was shown that the correction coefficient on UCS values of rock specimens with different heights would not exceed 1.04, if the L/D ratio varies between 1 and 3 (ASTM D2938, 1986). Therefore, specimens tested in this study have a small difference in height and by no means could this difference affect the UCS by 270%. Hence, it is concluded that other factors must influence the results and possible factors are discussed in the next sections.
3. Examination of rock inherent variabilities
As already mentioned, rock inherent variability is one of the main sources of uncertainty in rock engineering and is linked to the rock type(Hadjigeorgiou and Harrison,2011).Since rock materials differ in their mineralogy, grain size, and texture, the degree of uncertainty and variability would also be different for each rock type. Therefore, heterogeneous and anisotropic rocks would need more examinations, compared to the relatively homogenous and isotropic rocks in order to obtain reliable design-based data.In this section,the inherent variability of the collected rock specimens has been estimated by microscopic examination of thin sections and the analysis of the measured pulse velocities (i.e. ultrasonic testing), to assess whether and how the variability in microstructure affected the UCS results. For this purpose,the rock specimens are categorized based on their inherent parameters obtained by the two techniques explained hereafter.
3.1. Thin section analysis
Determination of the rock minerals, its micro-fractures, alterations, grain size, and fabric, usually characterized by analyzing a thin section of rock specimen,is very helpful for the model analysis and practical purposes of the mechanical behavior of rocks (ISRM,1978). To this end, eight specimens were randomly selected covering all visually categorized rock types. Some of these sections were selected from the rock pieces/cores as close as possible to the tested rock specimens. The first three specimens (R1-R3) are peridotite (base of dolerite sill)and the other five (R4-R8)are dolerite.The specimens have all been recrystallized to pinkschist metamorphic assemblages with various alterations of chlorite, epidote,and carbonate. The analysis shows the variation in the mineral assemblages of the specimens. The main rock type is dolerite sills,which in the Goldfields region of Western Australia are differentiated with the ultramafic or peridotite bases graded into typical dolerite assemblages of clinopyroxene and plagioclase.Quartz becomes part of the mineralization as differentiation proceeds but is only minor(~5%) in some specimens and partly inter-grown with feldspar.Fig. 4 shows images from the thin section analysis of these specimens in cross polarized light(XPL).
It should be mentioned that within the dolerite sills in the Goldfields,the grain size can vary from very fine-grained(margins of dolerite body) to coarse-grained in the core of the body. The grain size is a function of temperature during crystallization and alteration.Table 2 shows the full rock name,grain size and classification of the analyzed thin section specimens. Specimen R4 was visually categorized as rock types 1 and 3 since it was very difficult to see which of the rock types this specimen belongs to. As can be seen, those specimens visually categorized as rock type 4 are“chlorite/chloritecarbonate altered peridotite” and those categorized as rock type 1 are “epidote-chlorite altered quartz dolerite”. What can be clearly seen in this table is the similarity between the rock types.Rock types 1 and 4 are visually similar as they are in alteration, explored from the thin section analysis.On the other hand,while rock types 1 and 5 are visually distinguishable, they have the same alteration and are categorized microscopically the same (“epidote-chlorite altered quartz dolerite”).Taken together,this comparison indicates that the visual inspection and judgment by a professional geologist or rock engineer could be questionable and is not always accurate and needs more examinations and analysis.
With respect to the UCS of the rock specimens,as can be seen in Table 2, rock type 4 (“chlorite/chlorite-carbonate altered peridotite”)resulted in a UCS value in the range of 86 MPa-139 MPa(UCT-1, UCT-2, and UCT-3), while rock types 1 and 5 (categorized microscopically as “epidote-chlorite altered quartz dolerite”)resulted in a very high value of UCS, higher than 267 MPa (UCT-4 and UCT-5).Although rock types 1 and 5 showed mineralization of quartz, a question arises as to whether a minor quartz mineralization or minor difference in alteration sequence could change the rock mechanical properties to vary by almost 270%. Turning to the specimens R2 and R3, categorized as the same rock type, the UCS for rock specimens close to them (UCT-2 and UCT-3) differ almost 60% from each other. The questions raised by this comparison are how a rock engineer can make sure that the difference in mechanical properties of rock, visually similar and identical, could be due to differences in mineralization;and whether there is another factor affecting the obtained data. How should a rock engineer or geologist analyze the rock specimens to have valid rock parameters for the design? In the next section, the available rock specimens were investigated in terms of their ultrasonic elastic parameters to see whether the major factor affecting the results can be determined and whether their classifications made by the ultrasonic results match the microscopic classification.
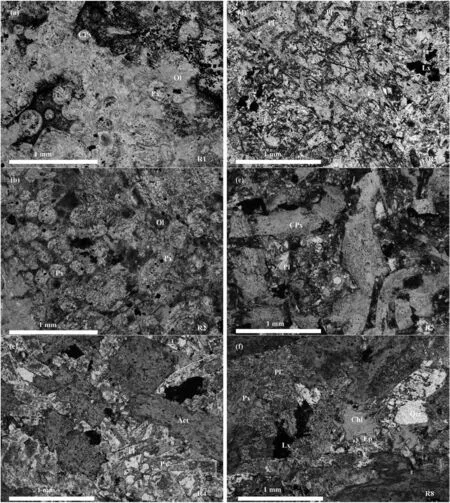
Fig. 4. Photomicrographs of thin sections of tested rock specimens: (a) R1: the rounded forms preserved are former clinopyroxene and/or olivine crystals partially or totally enclosed in coarser-grained pyroxene (now altered to fibrous amphibole-tremolite); (b) R2: a poikilitic texture where medium-grained former pyroxene encloses finer-grained,rounded pyroxene and/or olivine; (c) R4: the interlocking texture of plagioclase and former clinopyroxene, now replaced by actinolite; (d) R5: medium-grained former pyroxene encloses finer-grained plagioclase laths; (e) R7: a dolerite texture is defined by interlocking columnar plagioclase and prismatic clinopyroxene; (f) R8: a dolerite texture of altered plagioclase and pyroxene dominates the specimen. Patches of chlorite and epidote are present. Irregular patches of quartz are partly inter-grown with the feldspar, in plane polarized light(PPL);Px,CPx,Lx,and Pl stand for pyroxene,clinopyroxene,leucoxene,and plagioclase,respectively;and Ol,Act,Ep,Chl,and Qtz stand for olivine,actinolite,epidote,chlorite and quartz, respectively.
3.2. Ultrasonic parameters
Ultrasonic wave velocity measurements are popular for nondestructive testing (NDT) of rocks as it is relatively cheap, quick,simple, and easy to implement. This testing was conducted on 78 dolerite specimens to both determine their dynamic elastic constants and potentially categorize them into different distinguishable groups and to compare this classification with that of thin section analysis. The P- (longitudinal wave) and S-wave(shear wave)velocities have been recorded in this testing according to ASTM D2845-08(2008).A high-frequency ultrasonic test system with a digital waveform display was used for these experiments.It includes a signal generator, oscilloscope, and data acquisition unit and other components, the same as most commercially availableultrasonic test systems.Two different pairs of sensors(transducers)were used for measuring the waves. V103-RM and V153-RM transducers from OLYMPUS - both with a nominal frequency of 1 MHz and nominal element size of 13 mm-were used to record the compression and shear wave velocities, respectively.
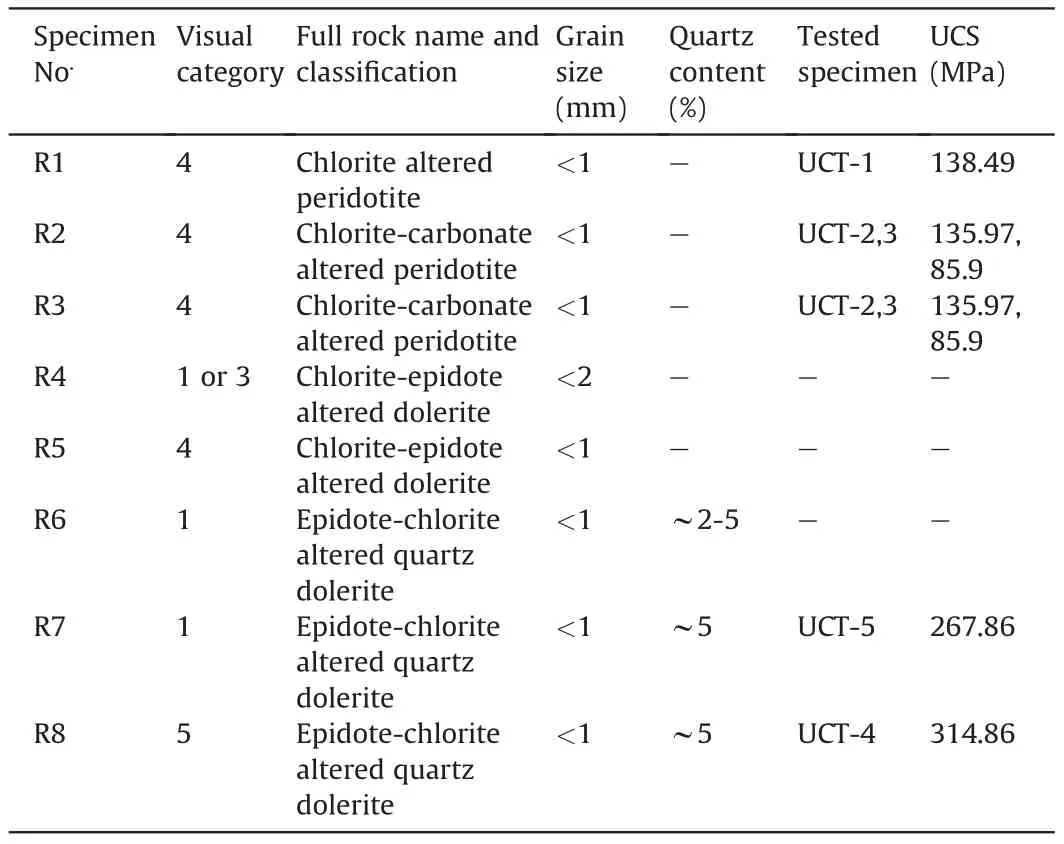
Table 2 The full rock name and classification, grain size and quartz content of the rock specimens after thin section analysis and comparison with the visual categorization.
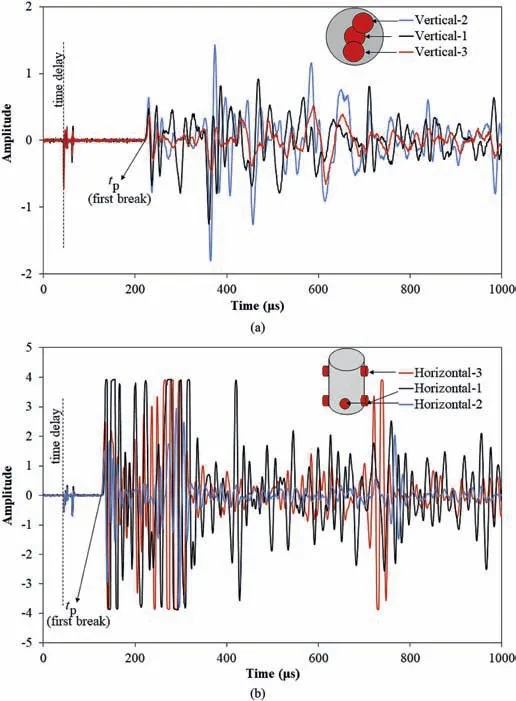
Fig. 5. Two examples of P-wave records. The arrival times were recorded by the time of first break:(a)Vertical(axial)directions,and(b)Diametrical(horizontal)directions.tp indicates the time of the first break.
Some measurements and verifications have been taken for determination of travel time, delay time and positioning of transducers to ensure the validity of this experiment on the tested specimens,according to ASTM D2845-08(2008)and Aydin(2014).Some of these measurements include using clippers for coaxial positioning of two sensors normal to the specimen’s end surfaces,applying coupling medium(silicone grease)between the specimen surfaces and each transducer to improve the energy transmission,and applying a small seating force again for better energy transmission.
The P-wave velocity measurements have been conducted in both vertical (normal to the end surfaces of the specimens) and diametrical(horizontal across the diameter or normal to the lateral dimension of the specimen) directions. Three measurements have been conducted at three different points in each direction (3 in vertical and 3 in diametrical). As illustrated in Fig. 5, all three measurements in each direction approximately resulted in the same P-wave arrival times(measured by the time of the first break,Fig.5),and hence,they have been averaged for further analysis.All vertical P-wave velocities vary by less than 2% from their average values except for two cases of which a crack is visible on the specimen surface. Therefore, generally speaking, it can be concluded that the specimens are isotropic since all velocities vary by less than 2% from their average values according to ASTM D2845-08 (2008).
The S-wave velocity measurements have been conducted twice along the axial direction of the specimens(normal to the specimen ends) to obtain a reliable result. For the first measurement, both transducers were attached onto the specimen end surfaces aligned parallel to each other(on the identical phase known hereafter as SPhase-0).For the second measurement,one of the transducers was rotated 90°to make a change in the phase of its wave arrival time,hereafter known as S-Phase-1 (Fig. 6). The S-Phase-0 velocities were taken as the representative shear velocities because this measurement is very sensitive to the direction of the transducers and operational error which is more likely in S-Phase-1 direction.Fig.7 shows the values for vertical P-wave velocities and S-Phase-0 shear velocities for all tested specimens. The average P- and Swave velocities were determined as 6160 m/s and 3530 m/s,respectively,for this rock type.The results are very similar to what has been reported for dolerite rocks,generally,in Western Australia in another investigation (Adams and Dentith, 2018).
Two ultrasonic dynamic elastic constants of Young’s modulus and Poisson’s ratio were calculated from the measured compression (P-wave) and shear wave (S-wave) velocities. The dynamic elastic Young’s modulus and Poisson’s ratio are calculated from the following equations (ASTM D2845-08, 2008):

where E is the dynamic Young’s modulus,ν is the Poisson’s ratio, Vpis the P-wave velocity, Vsis the S-wave velocity, and ρ is the rock density.Fig.8 shows the values calculated for the dynamic Young’s modulus and Poisson’s ratio for all specimens.The average dynamic Young’s modulus and Poisson’s ratio were determined as 92.45 GPa and 0.25, respectively, for this rock type, however, the scatter is considerable.

Fig. 6. S-wave velocity measurement in (a) Phase-0 mode and (b) Phase-1 mode along the specimen axis.
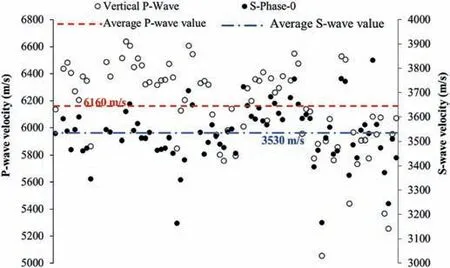
Fig. 7. Shear wave velocities for Phase-0 and vertical P-wave velocities of all tested specimens.
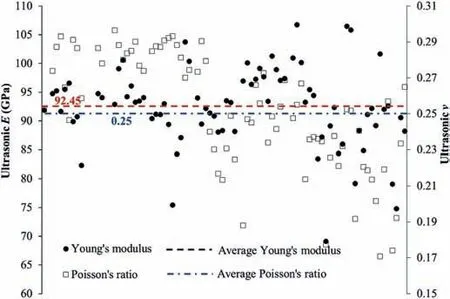
Fig. 8. Determined dynamic Young’s modulus and Poisson’s ratio of the rock specimens.
As already mentioned, an initial objective of the ultrasonic measurements was to classify the available rock specimens into different groups based on the obtained data. The data for the Pwave velocities and the Young’s modulus were selected for this purpose. Scott (2010)’s normal reference rule was used to categorize rock specimens based on the P-wave velocities and Young’s modulus.In this method,the bin width(or category)is determined according to the equation below:

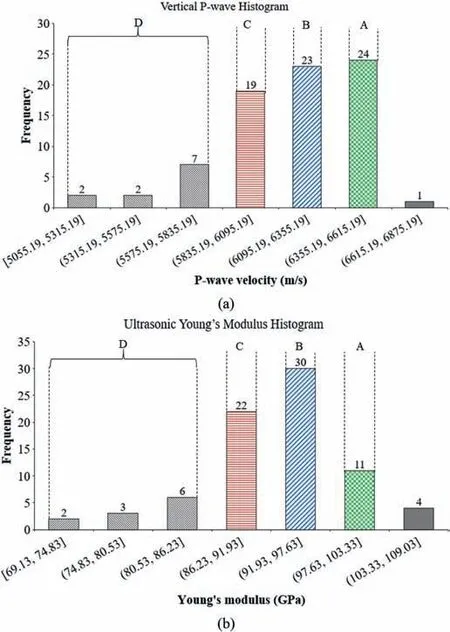
Fig.9. Histograms showing four main groups of tested rock specimens based on(a)Pwave velocities and (b) dynamic Young’s modulus.
where S is the standard deviation of the data (either the wave velocities or Young’s modulus) and n is the number of values in the data source. The histograms plotted from this method are illustrated in Fig.9.As can be seen from this figure,generally four rock types can be assigned for all rock specimens, based on their strength, and according to the P-wave velocities. This bias makes classification, comparison, and explanation simple and straightforward;otherwise,it would be very hard to compare the data if a narrow range is considered.These four groups,A,B,C and D can be described as
(1) A: very strong dolerite;
(2) B: strong dolerite;
(3) C: medium strong dolerite;
(4) D: weak dolerite (or with microcracks).
The ultrasonic parameters of the specimens of the thin section analysis (R1-R8) are approximated from the ultrasonic measurements of specimens which were cut adjacent to them.For instance,the P-wave velocity of R4 was considered to be 5900 m/s based on the P-wave velocity measured from the specimen that had been cut from the adjacent rock piece. Then, the classification based on the thin section analysis can be compared with that of the ultrasonic measurement, as shown in Table 3. It is apparent from this table that there is an agreement between these categories and rock types determined from the thin section analysis and the P-wave velocities.For instance,as can be seen in this table,R1,R2,and R3 belong to the same category based on both this section analysis and Pwave measurements. It should be mentioned that the comparison is between thin section analysis and P-wave velocity measurements.The visual categories can be very subjective,as discussed in the previous sections, and are not taken into account in the comparison.
It should be noted that this will not be true for the rock categorization based on the Young’s modulus,since Young’s modulus is calculated from both P-and S-wave velocities,whereas the S-wave measurements are very sensitive to the testing and operational conditions. Therefore, it could be said that the P-wave velocity measurements can be used to categorize rock specimens for further analysis. This is very advantageous because the ultrasonic test is less expensive,simpler,and quicker than the thin section analysis.Having the ultrasonic parameters of the rock specimens, a geologist, rock engineer or laboratory technician would be able to both have a good idea about the mechanical properties of the rock specimens and use these, along with the thin section analysis, to better categorize the rock types. A similar comparison has been drawn on the specimens used for the compression tests (Table 4).What can be clearly seen in this table is the similarity between visual category,the range of UCS,and category based on the P-wave velocity measurement for the fractured specimens. This is evident in the case of those specimens (UCT-1, UCT-2,and UCT-3), visually categorized as rock type 4, which failed at the same range of UCS between 86 MPa and 139 MPa, and also belong to the same group“B”based on the P-wave velocity measurements.However,there is an inconsistency between the results. Taking the UCT-4 specimen for example,it failed at a high value of stress(315 MPa),while the rock specimens near to it resulted in relatively low value of P-wave velocity. This contradiction indicates that there might be other factors affecting the UCS results, of which the rock-machine interaction will be discussed in the next section.
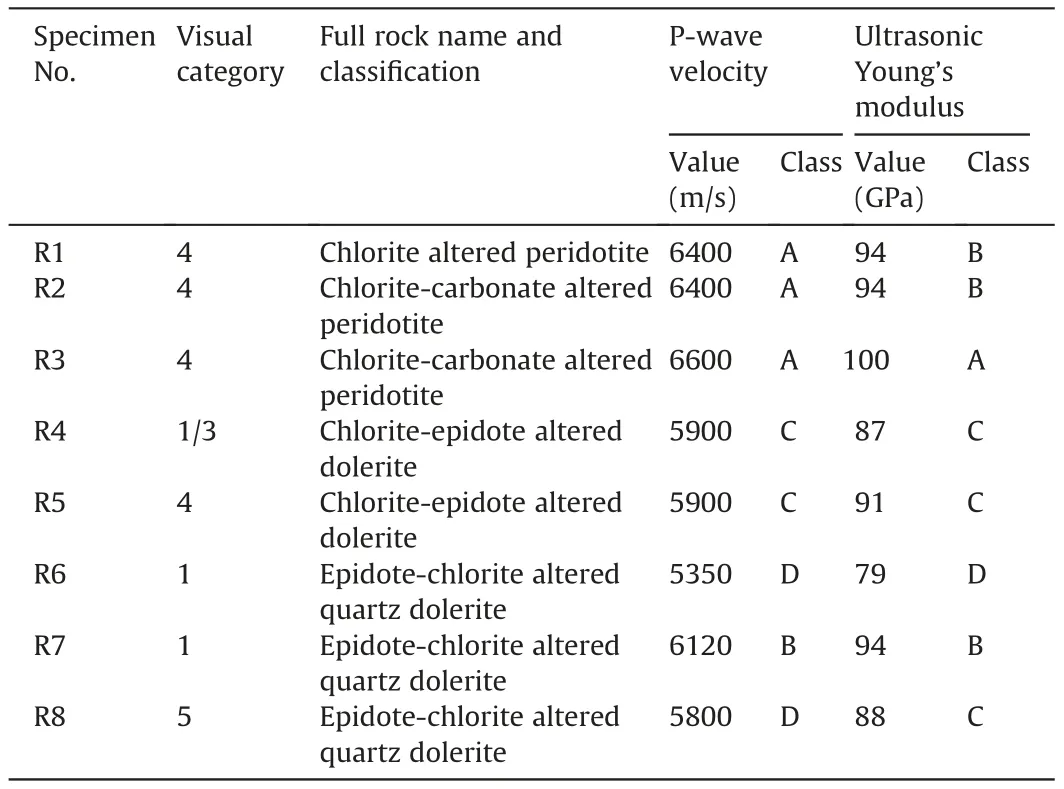
Table 3 Comparison between rock type categories based on the ultrasonic measurements and thin section analysis.
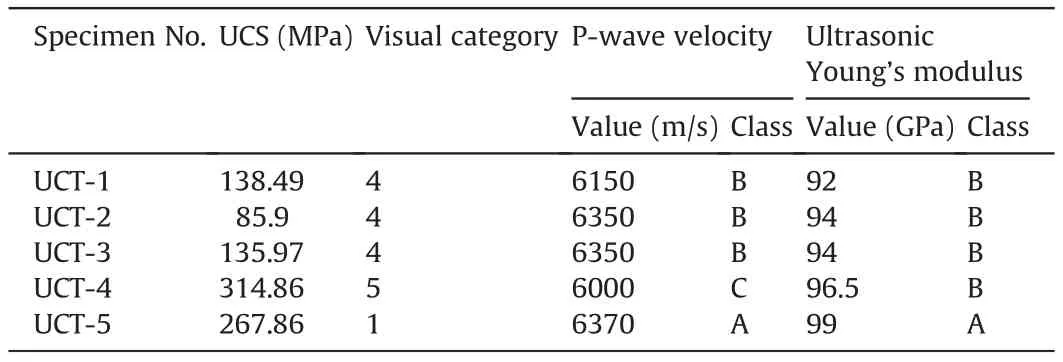
Table 4 Comparison between the visual category, UCS and category determined from the ultrasonic measurements of the rock specimens failed under unconfined compression.
4. Testing conditions
As already mentioned,all factors which might affect the testing results should be checked to obtain valid data required for a reliability-based design.Inherent variability and testing conditions can both affect the results of a physical or mechanical testing. The inherent variability which comes from different physical parameters of the testing material is somehow unavoidable but still needs precise examination. The effect of these parameters has been checked throughout the previous section. However, it is dubious whether the scatter observed in the rock UCS data is a direct consequence of the inherent variability or not.
The variability due to the testing conditions could form another source of variability of the obtained mechanical properties.Among the possible sources, the specimen-based variability coming from the shape deviation and machine-based variability coming from the equipment performance and the operational errors are discussed herein.In order to check these variabilities,a solid material with homogenous structure should be selected for uniaxial compression test in which the inherent variability is not of concern or otherwise ignorable.The testing variability could come from the shape deviation of the tested specimen including flatness of its ends,perpendicularity,and parallelism related to the inaccuracy of the specimen preparation, size effect pertinent to the different aspect ratio of the tested specimens, or the loading machine performance. For specimens with the same aspect ratios, the shape deviation and machine performance would be the remaining sources of variability affecting the test results.To check these types of variability, aluminum specimens, as a standard medium with homogenous structure, were selected for the control testing.
Five test specimens are fabricated by extrusion using 6061-T6 aluminum alloy,according to the Australian/New Zealand standard AS/NZS 1664.1:1997(1997).The specimens are exactly 39.96 mm in diameter with an L/D ratio of 2.Sixteen uniaxial compression tests have been carried out on these specimens with details outlined in Table 5.It should be noted that two strain gauges were attached on each specimen at different positions, as specified in Table 5. Two axial and two lateral strains were recorded during each test.Specimens were loaded within the elastic limit up to a maximum load level as described in Table 5.For repeatability of the obtained data, some tests have been conducted on the same specimen. Itshould be mentioned that the repeated tests were conducted within the elastic region of loading since the compression bearing capacity of these aluminum specimens was 386 MPa. Two different loading frames were used for these tests to check the variabilities attributed to the accuracy and performance of the loading machine.
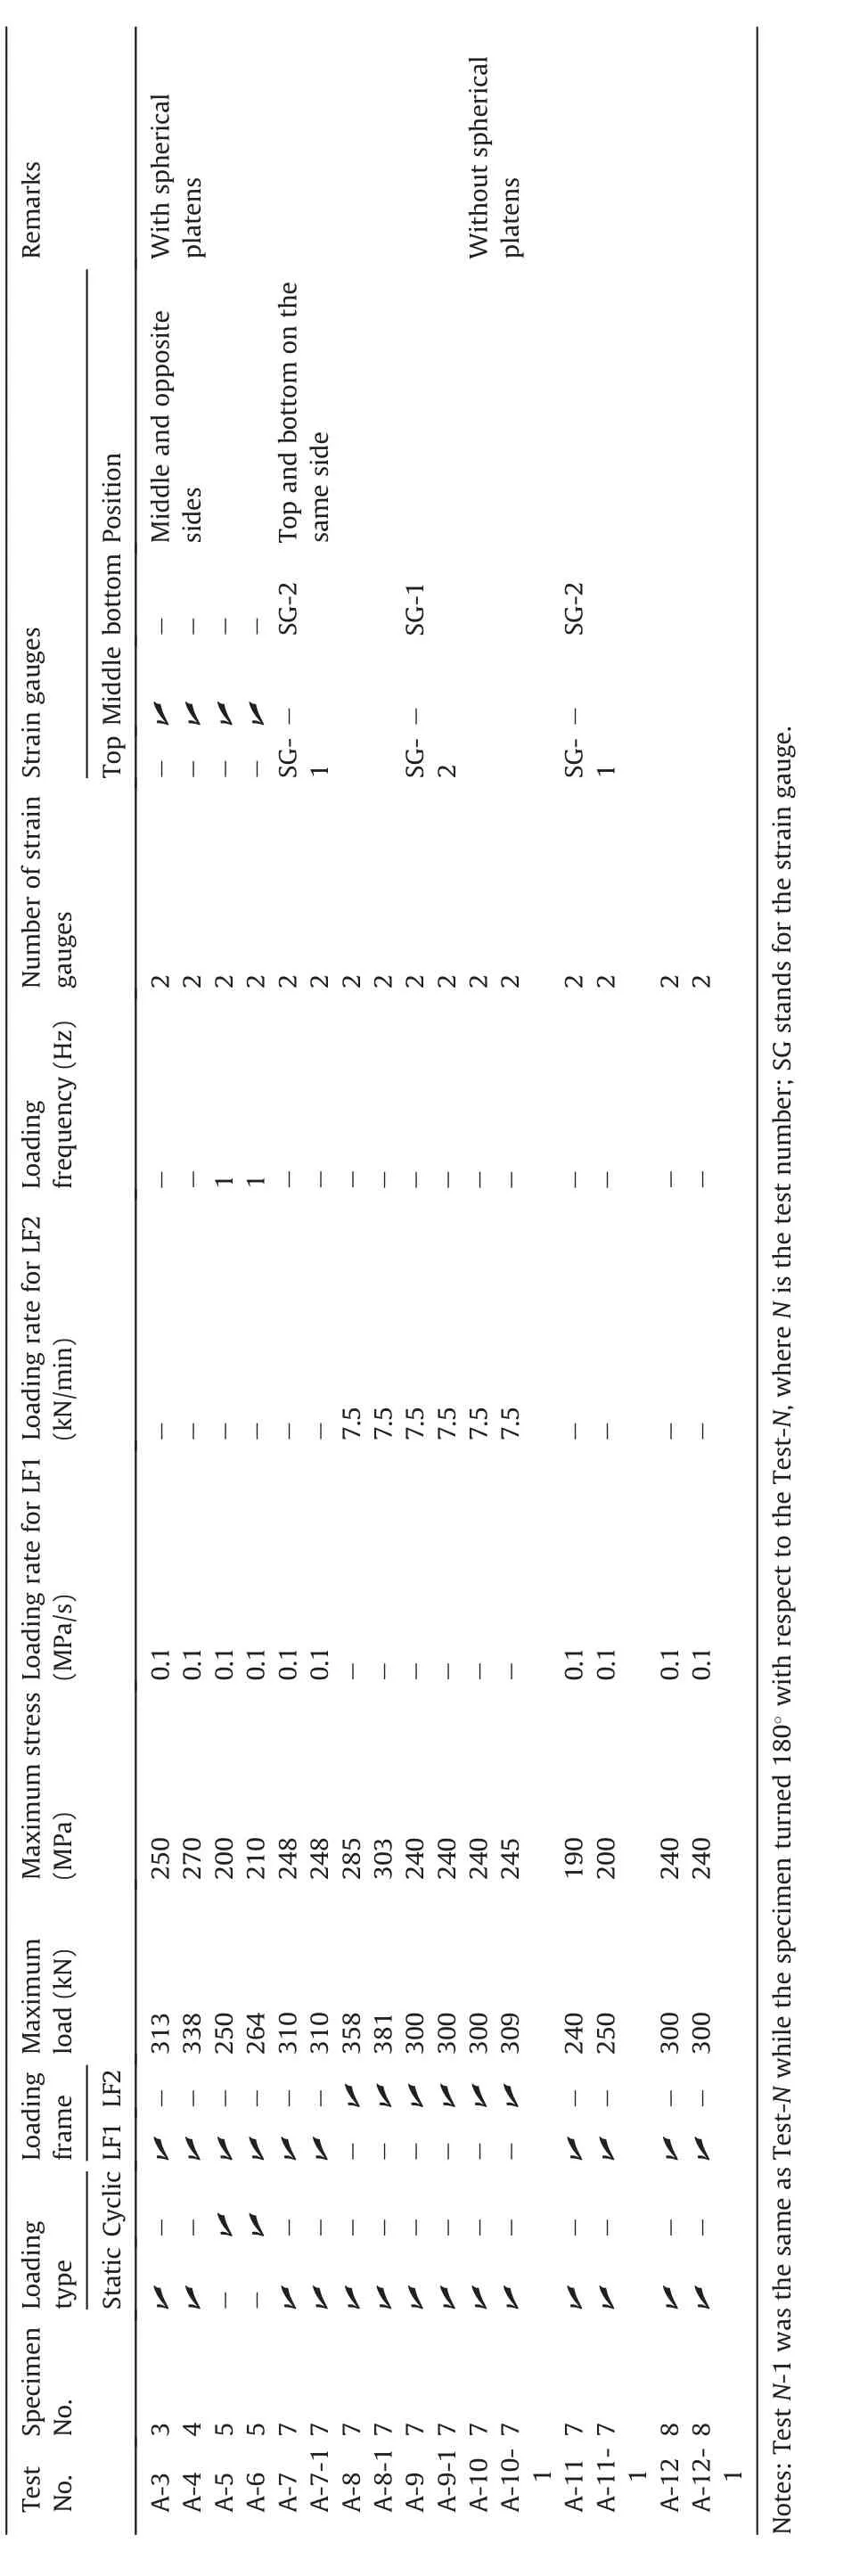
Table 5 Descriptions of the tests conducted on the aluminum specimens.
4.1. The effect of specimen shape deviation
According to the standards, there are strict requirements for the preparation of a rock specimen to determine its mechanical properties. The effects of shape deviation including flatness,perpendicularity, and parallelism of the prepared specimen on the mechanical properties have already been investigated(Hoskins and Horino,1968; Hawkes and Mellor,1970; ˇStambuk Cvitanovi'c et al., 2015). According to these investigations, the effects of the parallelism and perpendicularity of the rock specimen on its UCS would be negligible. However, the end surface flatness can be a critical parameter and needs more assessment. The effect of the end flatness on rock mechanical properties, including the UCS, is more evident for hard rocks.This is shown in Fig.10 in which a large dependency of stronger rock like granite on the specimen end surface texture variation(flatness) can be clearly seen. The end preparation has been shown to affect the UCS values of concrete by 6% for stronger specimens, whereas the specimens with low strength showed lower sensitivity to the quality of end flatness(Carino,1994).The unground rock specimens have lower strength compared to the ground and flat specimens (Fukui et al., 2005). It was also reported that the rock failure mechanism could be changed from splitting failure to shear failure in unconfined compression test because of the end effect(Gao et al.,2018).These all indicate that the specimen end flatness could greatly affect the mechanical properties of rocks. The flatness tolerance specified by ASTM D4543-08 (2008) is 0.001 in (25 μm), which is difficult to achieve,especially for hard rocks.Some attempts have been made to optimize the flatness tolerance. However, these attempts were limited to specific rock types and few specimens only. There is,therefore,a promising avenue for further research in this area to answer the question of how and to what extent the surface end flatness affects the mechanical properties of rocks covering all rock types and probably to optimize or change the specimen preparation requirements.
In this study, aluminum specimens were ground almost flat with flatness less than 0.0005 in (<10 μm) using high-quality machinery to avoid the variation resulting from the nonflatness of the specimens. On the other hand, the inherent variability of these specimens is ignorable since the aluminum alloy used is approximately homogenous with stable properties.Therefore, any difference in the results of the uniaxial compression tests conducted on these specimens could be attributed to either testing conditions (excluding shape deviation because all specimens are flat with the same aspect ratio)or the loading machine performance. For this purpose, four tests(A-3 to A-6) have been conducted either in quasi-static (monotonically loaded up to a stress level) or cyclic loading (loaded monotonically up to a stress level, unloaded again and then underwent repetitive loading-unloading stages under a constant frequency). The tests aimed to investigate: (i) correctness and precision of the testing procedure (i.e. operation errors) and (ii)whether there is any unusual behavior related to the loading frame or not. Therefore, if the deformation responses of these tests match each other, it will show that the testing conditions and machine performance are quite satisfactory and the inconsistency in the UCS results of the tested rock specimens could be caused by either the rock inherent variability or inconsistent end surface flatness. Otherwise, it could be said that the testing conditions play a part in the inconsistency of the obtained UCS data of rock together with the inherent variability.
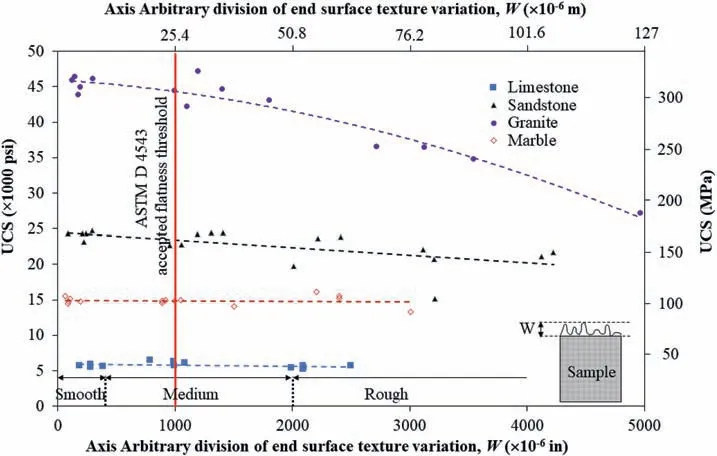
Fig.10. Effect of the specimen end surface texture variation (flatness, W) on the UCS of rock,showing great dependency of hard rocks on the specimen end flatness compared to weak rocks (modified after Hoskins and Horino (1968) and ˇStambuk Cvitanovi'c et al., 2015).1 psi = 6.895 kPa.
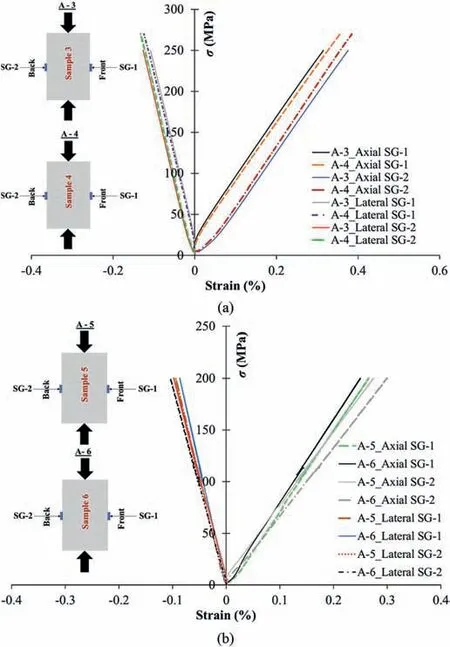
Fig.11. Stress-strain response of tests(a)A-3 and A-4,and(b)A-5 and A-6,conducted on the aluminum specimens.
The strain gauge readings of these tests showed inconsistency in the deformation response of tested specimens even for the same flat and homogenous specimen.As can be seen in Fig.11,the strain recorded by SG-1 (strain gauge attached on the middle of the specimen facing the front side of the machine) showed a noticeable difference from the strain recorded by SG-2 (strain gauge facing the back side of the machine)for all these four tests.This difference is about 20% for tests A-3 and A-6 (Table 6). Such huge differences indicate that the loading machine performance or the testing condition can be a source of variability of the test results. For further evaluations, tests A-7 and A-7-1 (with strain gauges attached on the same side of the specimen at equal distances from its top and bottom)have been conducted on the same specimen to see whether this discrepancy comes from the uneven loading of the specimen or inconsistency in the strain gauge installation. It should be noted that test A-7-1 was conducted on the same specimen (specimen No. 7) while it was turned 180°to check the loading condition of two sides of the loading frame.For these tests, the top and bottom axial strain gauges again showed different results-with 8.7%and 3.6%differences for the tests A-7 and A-7-1,respectively(Table 6).The top strain gauge(for test A-7 facing the front of the frame,and for test A-7-1 facing the back of the loading frame)showed 20%difference in recorded strain after the test.This amount was 10%for the bottom strain gauge.Hence,one side of the specimens deforms more than the other side.This could be because of either uneven loading of the frame or tilting of the loading bar with respect to the specimen end surfaces. It should be noted that the specimen and strain gauge installation were identical for these two tests. Another conclusion is that the scatter data obtained for the UCS of the rock specimens are not necessarily related to the shape deviation or rock inherent variabilities, as the loading machine also plays a role in the scatter of the results.
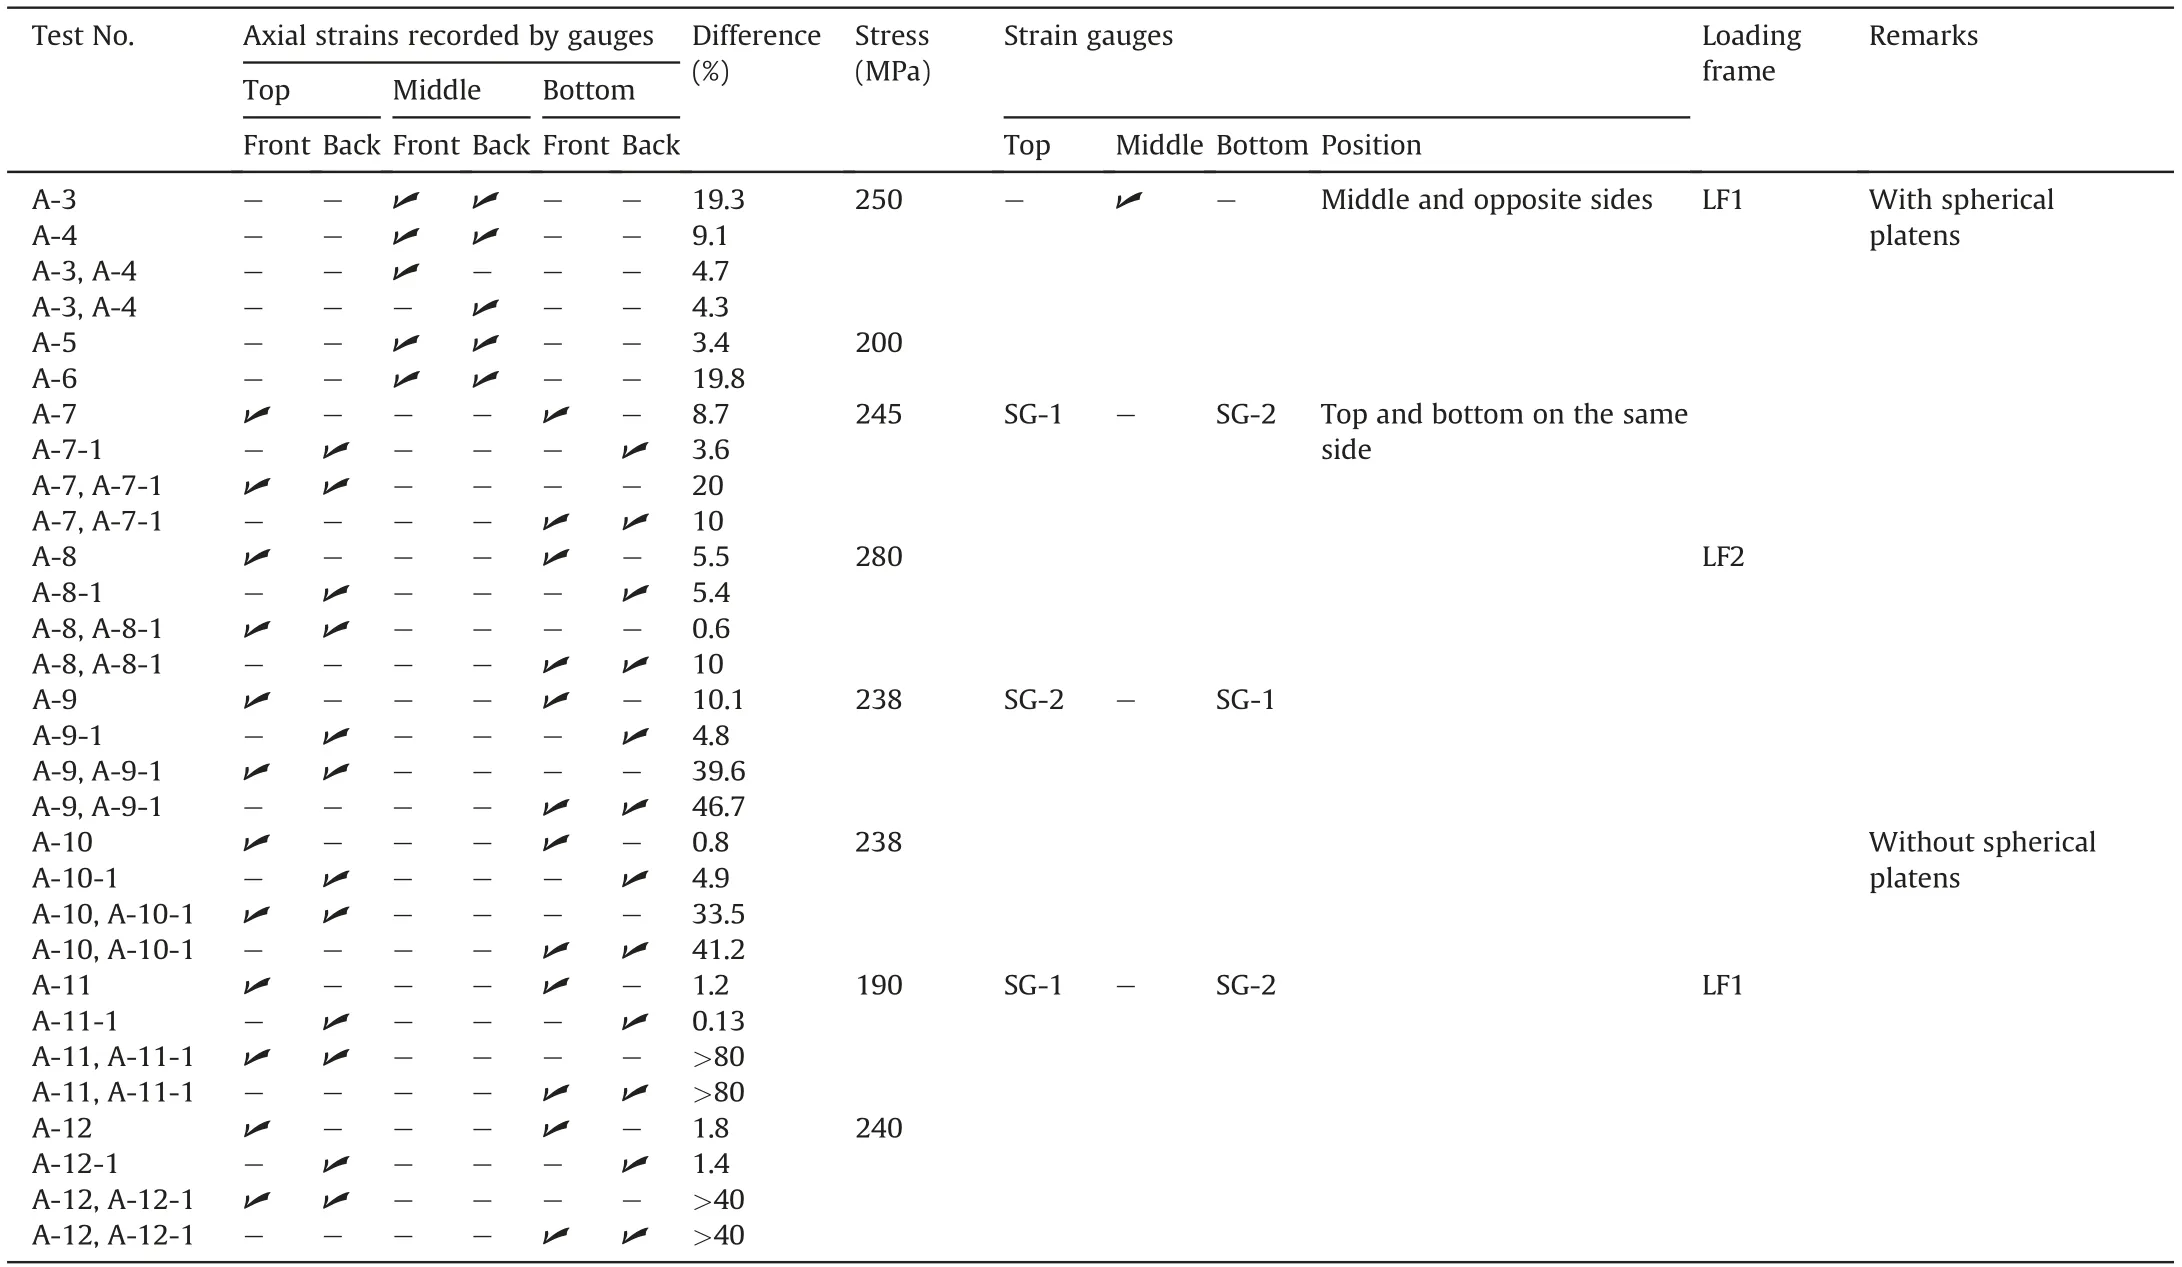
Table 6 Comparison of axial strains recorded by strain gauges attached at different points of the aluminum specimens.
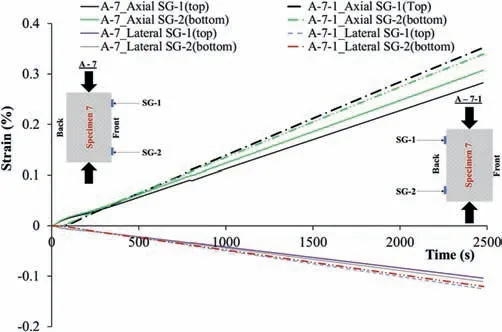
Fig.12. Strain development of tests A-7 and A-7-1 conducted on the same aluminum specimen by the loading frame LF1,showing more deformation recorded by the strain gauges facing the back of the loading frame compared to when they are facing the front of the loading frame.
4.2. Loading machine performance
Further analysis of the uniaxial compression test results carried out by the loading frame LF1 indicates that the back side of the specimens showed higher strain than the front side. It was found that this behavior is characteristic of all tests carried out by this loading frame on both rock and aluminum specimens(Figs.12 and 13).All these comparisons can be seen in Table 6.This issue was also numerically investigated which will be discussed in Section 5. For better assessment of the testing conditions,another loading frame LF2 was chosen to repeat these tests to check the observed behavior.Two tests(tests A-8 and A-8-1)with the same procedure taken during tests A-7 and A-7-1 were conducted on the same specimen (No. 7) in order to avoid any change in strain gauge installation and the specimen itself. The results showed that the strain recorded by the top strain gauge still differs about 5.5%from the bottom one(Table 6).However,their differences are lower than what have been recorded for tests A-7 and A-7-1 (8.7%). The top strain gauges for these two tests showed almost the same readings with less than 0.6% error throughout the tests, while it was more than 20%for tests A-7 and A-7-1 carried out by loading frame LF1.This could be an indication of the better performance of LF2. The bottom strain gauges for these two tests (tests A-8 and A-8-1),however,showed the same differences as recorded in tests A-7 and A-7-1(10%).Tests A-8 and A-8-1 have been repeated with the same specimen inverted so that SG-2 is at the top and SG-1 is at the bottom to see if the platens on the bottom or the spherical seat on the top contribute to the different results. These two tests were named tests A-9 and A-9-1 (Table 5). No improvement has been observed and there was still mismatch between the strains. The strains recorded by the bottom and top strain gauges still showed≥40% differences (refer to differences for tests A-9 and A-9-1 in Table 6).
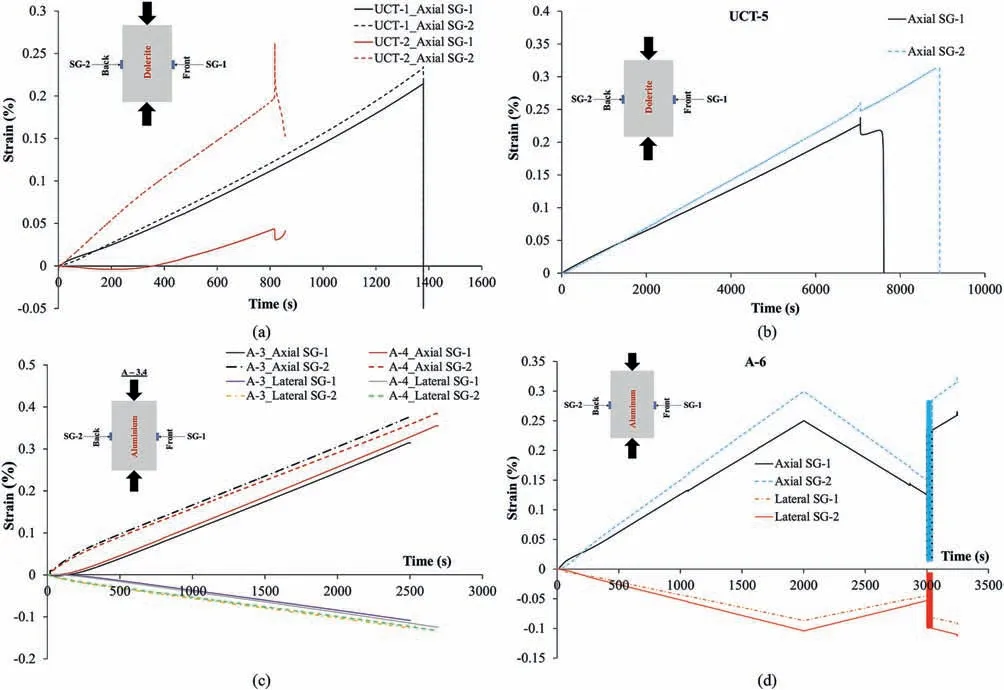
Fig.13. Strain curves of the tests:(a)UCT-1 and UCT-2 on dolerite specimens, (b) UCT-5 on dolerite specimen, (c)Tests A-3 and A-4 on aluminum specimens, and (d)Test A-6 on aluminum specimen,conducted by the loading frame LF1,indicating more strain recorded by the strain gauges facing the back of the loading frame compared when they are facing the front of the loading frame.
Although the best effort has been made to centralize the specimen, the platens and spherical seats with respect to the loading frame and one another,the effect of spherical seats on the observed strain behavior was unclear. For this purpose, six more tests have been conducted with both loading frames using flat loading platens instead of the spherical ones between the specimen end and the loading frame. As can be seen from Table 6, the results revealed a good agreement between the strain data of the top and bottom strain gauges for all these six tests(tests A-10 to A-12-1).The strain curves of tests A-10 and A-11-1 are shown in Fig.14, for example.However, the comparison between recordings of the top strain gauges(for example the top strain gauge of test A-10 with the top strain gauge of test A-10-1) with each other and the bottom strain gauges with each other for all these tests, on the other hand, still showed a poor agreement and huge differences (33.5% and 41.2%for the top and bottom strain gauges,respectively, see Table 6).
Detailed analysis of data for tests A-11 to A-12-1 conducted by loading frame LF1 revealed another observation.As can be seen in Fig.15,there is a difference between the measurements of the top and bottom strain gauges in both tests A-11 and A-12 (when the strain gauges face the front of the machine), whereas, for specimens turned 180°(the strain gauges face the back of the machine)for tests A-11-1 and A-12-1, all strain measurements are quite the same. The consistency in the last obtained data reveals that both the testing procedure and strain gauge installation were quite accurate and there was no variability because of the operation error and eccentricity of the cylinder axis. On the other hand, it also indicates that the spherical platens might be a source of variability in the obtained rock testing results and can induce non-uniform loading on the specimen. It is despite the fact that the spherical platens are especially used to compensate the variations in the parallelism of the specimen’s ends and to transmit the axial load uniformly. In summary, these observations show that although both loading frames were calibrated and the testing procedure was the same for all conducted tests, the machine performance itself and precision of its attached equipment greatly affect the testing condition and in turn rock laboratory test results. In the next section, this finding will be verified through numerical analysis.
5. Numerical analysis
In order to explore the effect of testing conditions on the obtained results, finite element method (FEM) simulations were carried out using ABAQUS3D6.14(ABAQUS,2014).For this purpose,the two tests using aluminum specimens A-11 and A-11-1 were considered. The aim of this numerical analysis was to find the effects of misalignment, non-axiality or other factors that affect the experimental measurements.

Fig.14. Strain curves obtained in the loading frames with flat loading platens:(a)Test A-10,and(b)Test A-11-1,conducted with loading fame LF2 and LF1,respectively.Good agreement is seen between the strain recordings of top strain gauges with the bottom ones when the straight platens were used instead of the spherical platens between the specimen end and loading frame.
An aluminum specimen was used in the simulation in order to eliminate any variability coming from the specimen. The mechanical properties of aluminum are homogenous and known a-priori and, hence, reliable for the simulation. The aim here is to investigate the effect of the testing conditions on the results,since there is no or ignorable contribution of inherent material variability and end flatness effects. The parameters of the generated model, dimensions,and material properties are listed in Table 7.Two contact interfaces were defined at the top and bottom of the specimen with normal and tangential properties. The pressure-overclosure behavior of the normal contact elements was considered as a hard contact during the numerical analysis. A rough contact was considered mainly due to the fact that the target loading was very high and regardless of any other factor, in real testing, the sliding between specimen and platen does not occur and is impossible at a loading above 1 MPa or even less. Hence, the contact surface becomes a rough-like condition. The bottom bar of the model was fixed in three directions(X,Y,and Z).The top plate of the model was fixed in two directions (X and Y). A constant uniform pressure of 54.125 MPa is applied on the surface of the cylindrical plate to induce the same loading condition as in the experiments. The lateral surfaces of the cylindrical specimen were free of load. The loading rate throughout the test was the same as that in the experiments. The element type C3D8 is considered for mesh generation which is defined as Continuum 3 Dimensional (3D) 8 Nodal elements. There are 1918 3D elements considered for the analysis(Fig. 16). Firstly, an ideal condition in which specimen and the loading platens are in direct contact with each other with neither non-axiality nor misalignment was simulated to obtain the strain development throughout the test. Then, back analysis was undertaken in which the top plate and bottom bar were either tilted or moved with respect to the aluminum specimen to see the effects of these defects on the strain results and to reproduce the actual strain data of tests A-11 and A-11-1.
This numerical analysis shows that the transition(movement of the center of either top plate or bottom bar with respect to the center of the specimen, i.e. eccentricity) does not affect the strain curves of the aluminum specimen throughout the test if its end surfaces are in complete contact with the top platen and bottom bar. On the other hand, the strain curves are very sensitive to the misalignment of the top plate and bottom bar.A very small angular change of touching end surfaces of these two components with respect to the specimen (tilt) greatly affects the overall trend and results of the strain development of the specimen.
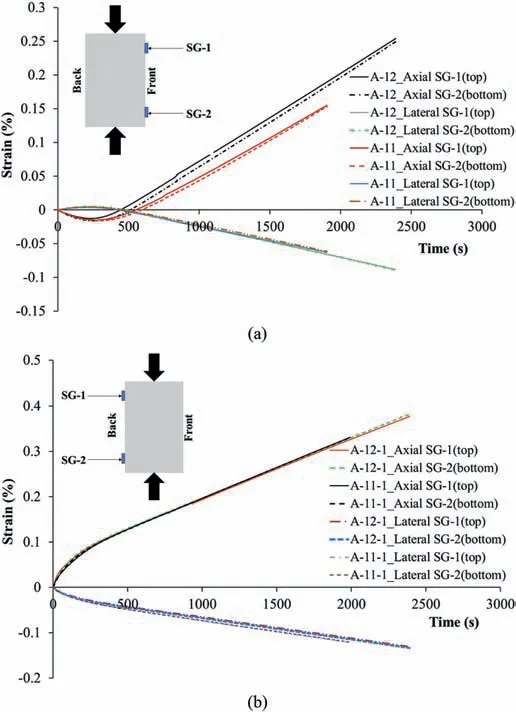
Fig.15. Comparison between strain developments of the top and bottom strain gauges when they are facing (a) the front (test A-11 and A-12), and (b) the back(tests A-11-1 and A-12-1) of loading frame LF1, conducted without spherical platens.
This model has been run with different tilt angles to reproduce the experimental results. Finally, a tilt angle of the plate of 0.106°was selected as an angle in which the numerical result is in good agreement with the experimental data.The axial and lateral strain contours of the specimen after this simulation can be seen in Fig.17.It should be mentioned that the top plate and bottom bar have been tilted from the right side(View A in Fig.17)of the model and a gap between them and the specimen has been created on the left side of the model(View B in Fig.17).Therefore,the strain results of the right and left sides of the model were compared with the experimental data of tests A-11-1 and A-11, respectively. Four measurement points of the model were exactly on the same points where the strain gauges were installed(Fig.17).The strain development of the numerical model was compared with the experimental data in Fig.18. What stands out in this figure are the curves of the strain obtained in the numerical simulation with 0.106°tilt of the top plate and bottom bar which are the same as those in the experiments.This is more obvious when the experimental and numerical data are compared with that of the ideal condition simulated numerically.The final strains of the numerical simulations differ by less than 8% from that of the experiments which are acceptable.This difference could be because of the operational errors duringthe experiments in turning the specimen 180°or installation of the strain gauge in an identical distance from the top and bottom. It can, therefore, be concluded that the discrepancy in the results,compared to an ideal condition,is mainly due to the misalignment or tilt of the top and bottom plates with respect to the specimen.

Table 7 Different components of the model generated for numerical analysis in ABAQUS,dimensions, and the material properties.
This numerical simulation strongly proves that a minor defect or inadequate precision of the equipment setup can affect the experimental results.This finding clearly explains that testing conditions are of great importance and as such they need to be carefully examined.
Therefore, it is concluded that some modifications need to be made to the relevant standards to address the required precision and performance of the testing equipment before the commencement of any rock testing.Such probable guidelines would not only minimize the operational errors,but also assure an experimentalist that the rock testing equipment is sufficiently accurate to carry out a test and to obtain valid data.
6. Pre-existing microcracks
In the previous sections, it was presumed that either the inherent rock properties or the testing conditions might affect the obtained test results. There might also be other factors like preexisting microcracks which cannot be considered as an inherent feature; however, they can be formed either during the mineralization due to temperature and pressure gradient or during the operational activities of core taking and specimen preparation.Such microstructural features and initial damage can noticeably affect the laboratory test results (Eberhardt et al., 1998; Pakzad et al., 2018). In this study, the CT, as a non-destructive technique,was used to characterize some of the rock (dolerite) specimens.Even qualitatively,the CT can provide useful information about the invisible rock features like cracks, heterogeneity, and overall change in texture.This test showed that there might be some preexisting microcracks inside the rock specimens which can neither be detected by the thin section analysis since it might be outside the sections taken for this analysis nor by the ultrasonic measurements because of the insufficiently wide frequency band of the transducers used for the purpose. Moreover, such microcracks could not be detected by the ultrasonic measurements since they have not had noticeable effect on the ultrasonic measurements and all obtained P-wave velocities varied by less than 2% from the average value. It should also be mentioned that it is almost impossible to detect such tiny cracks visually. For example, an inclined tiny crack was detected inside a dolerite specimen, while it has neither been detected visually nor through the ultrasonic test.As shown in Fig.19, this crack starts from the bottom of the specimen and extends almost toward the middle. This crack could greatly affect the strength properties of the rock specimen. Therefore,CT scanning is an excellent tool to detect invisible rock features required to be explored for better understanding of rock behavior.
7. Conclusions
This study set out to explore the affecting factors behind the variations in UCS results for dolerite rock specimens. Another objective of this study was to see the difference between the rock specimen categorizations made,based on the inherent parameters,including mineralogy and ultrasonic elastic constants. Although these categorizations are trivial and by no means new, the integration of this technique with others (e.g. cross-checking between the categorization based on visual inspection,thin section analysis and ultrasonic measurement) may provide new insights. This will be beneficial for an experimentalist to categorize a set of real specimens from the field. In general, it seems that in any rock engineering project,the rock specimens selected for the experimental analysis need precise examinations rather than simply visual inspections. These examinations include but are not limited to analyzing the inherent properties such as mineralogy and ultrasonic elastic constants. The ultrasonic measurement of P-wave velocity has been found to be a straightforward and quick way of having a proper estimation of the mechanical properties of rock specimens.The rock categorization based on the ultrasonic P-wave velocities has been determined to be as accurate as the thin section analysis,which suggests that they can be used together to obtain a more accurate preliminary evaluation of the rock types before carrying out any experimental tests.
It has been found that, among all variability sources investigated, the test results were affected by the specimen shape deviation, mineralogical differences due to the different kinds of the alterations,and testing conditions.The rocks’inherent variability is unavoidable since rocks vary in spatial and time domain;however,the variability because of the specimen preparation could be at least reduced to an acceptable level. Here, we raise the possibility that the existing standard for the specimen preparation,especially the end flatness, might not be good enough. An FEM analysis was implemented to check the effect of the testing conditions - specifically the loading plate deviation - on UCS results of aluminum specimens (microstructurally homogeneous specimens prepared according to ASTM standard) and it has been found that the tilt/misalignment of the top plate and bottom steel bar with respect to the specimen was the main reason of the discrepancies in the results. Therefore, the testing condition and loading machine performance have been found to act as hidden factors often not seen but affecting the laboratory test results.It seems that the standards for rock specimen preparation and test instructions need to be modified to answer the questions of how and to what extent they can affect the laboratory test results for all types of rock testing.More research could provide such information to establish a greater degree of test accuracy - this could include conducting comprehensive tests on different rock types considering the effects of specimen shape deviation, especially the end flatness, the loading frame precision, the design and setup considerations of the spherical seats. Therefore, control tests with minimal variation in specimen preparation, using a homogenous fabricated medium alongside the back analysis using FEM,are highly recommended to improve the loading quality.
The spherical seats also need to undergo quality control to monitor the change in deformational behavior of the specimen,by conducting some tests with and some tests without them. The interface friction between the spherical seats themselves and between the specimen and loading platens should also be reduced. Using lubricants, which has been recommended by the relevant standards, might help but it does not remove the specimen-platen friction and the end effect completely. This has also been addressed in other investigations(Xu et al.,2017).Using hydraulic spherical seats instead of the mechanical ones could be of assistance.
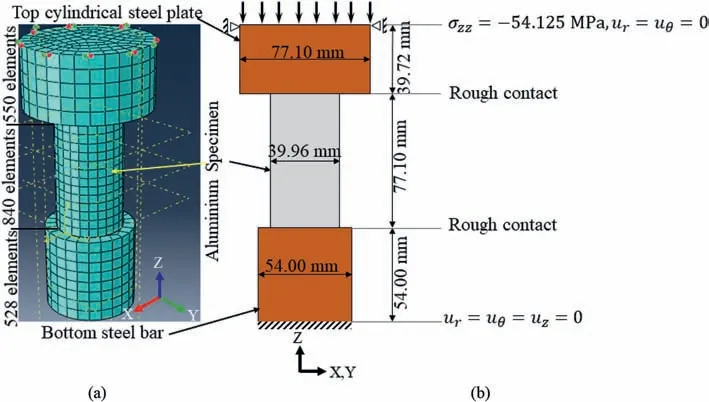
Fig.16. Numerical uniaxial compression test set-up for the aluminum specimen:(a)FEM model,and(b)Specimen and platen dimensions with boundary conditions.Rough contact is a contact on which all relative sliding movement between two surfaces is prevented by specifying an infinite coefficient of friction.
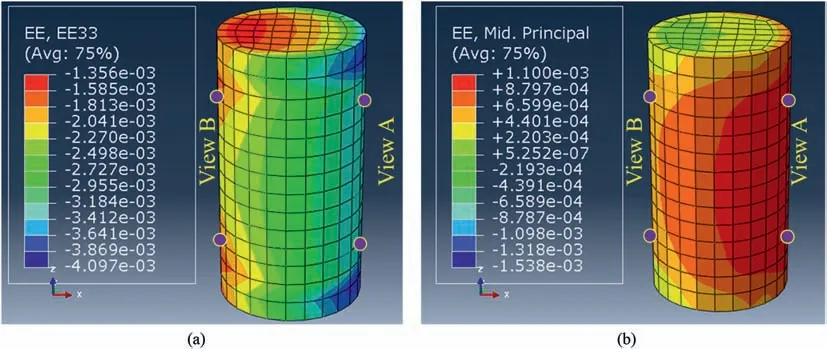
Fig.17. Results of the FEM modeling:(a)The axial and(b)lateral strain contours of the aluminum specimen with 0.106° angular tilt of the top plate and bottom bar with respect to the specimen; four measurement points are also shown.
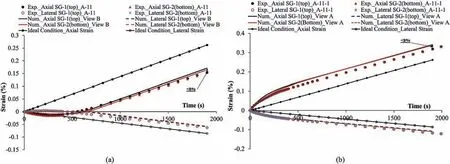
Fig.18. Comparison of the strain curves obtained from the numerical simulations in both ideal conditions and with misalignment with the experimental data for(a)test A-11 and(b) test A-11-1. Exp. and Num. stand for experimental and numerical, respectively.
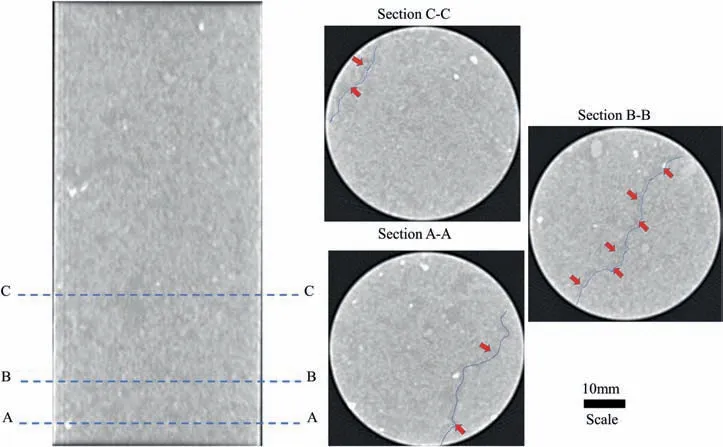
Fig.19. CT scanning slices for a dolerite specimen showing a tiny pre-existing microcrack inside the specimen.
Finally, it has been emphasized that while it is almost impossible to identify pre-existing microcracks either visually or through the thin section analysis and even the ultrasonic measurements,they may play a considerable role in rock test results. The CT scanning technique would allow experimentalists to detect such defects inside the rock specimens. It is recommended that this technique should be included into the relevant standards as an accurate way for pre-assessment of the rock specimens.
Improving the quality of rock testing and reducing the scatter of the results will improve our understanding of the mechanics of rock deformation and failure and will assist in avoiding large-scale rock failures.
Declaration of competing interest
The authors declare that they have no known competing financial interests or personal relationships that could have appeared to influence the work reported in this paper.
Acknowledgments
This research was funded by both the Curtin Strategic International Research Scholarship (CSIRS) and Mining Research Institute of Western Australia (MRIWA)-project M474 scholarship. The support provided by both institutions is highly acknowledged.The authors also would like to thank the departments of Mining and Metallurgical Engineering and Petroleum Engineering of Western Australian School of Mines (WASM), Curtin University for the provided laboratory facilities. We are thankful to Prof. Ernesto Villaescusa and Mr. Pat Hogan for their supports throughout the laboratory experiments. The collaborations of the Norton Gold Fields company in providing rock cores and the Commonwealth Scientific and Industrial Research Organization (CSIRO) of the Western Australia in providing access to a CT scanner are also highly appreciated. The third author would also like to acknowledge the support from the Australian Research Council through project DP190103260.
 Journal of Rock Mechanics and Geotechnical Engineering2021年5期
- Journal of Rock Mechanics and Geotechnical Engineering的其它文章
- Surface characteristics analysis of fractures induced by supercritical CO2 and water through three-dimensional scanning and scanning electron micrography
- Prediction of fracture and dilatancy in granite using acoustic emission signal cloud
- Hysteresis in the ultrasonic parameters of saturated sandstone during freezing and thawing and correlations with unfrozen water content
- Coupled Eulerian-Lagrangian simulation of a modified direct shear apparatus for the measurement of residual shear strengths
- A novel true triaxial test system for microwave-induced fracturing of hard rocks
- Hydromechanical behavior of unsaturated expansive clay under repetitive loading
