Isotropic compression behavior of granular assembly with non-spherical particles by X-ray micro-computed tomography and discrete element modeling
Nn Zhng, Ahmrez Heyt, Shoyng Hn,b, Runlin Yng,Hétor Gelber Bolños Sos, Jun José González Cárens, Guio Egr Sls Álvrez
a Department of Civil and Environmental Engineering, Colorado School of Mines,1500 Illinois St., Golden, CO, 80401, USA
b Key Laboratory of Ministry of Education for Geomechanics and Embankment Engineering, Hohai University, Nanjing, 210098, China
c School of Civil and Resource Engineering, University of Science and Technology Beijing, Beijing,100083, China
d Universidad Nacional de San Agustín de Arequipa, Arequipa, Peru
Keywords:X-ray computed tomography (μCT)Discrete element modeling (DEM)Isotropic compression Particle surface curvature Particle morphology
ABSTRACT The particle morphological properties,such as sphericity,concavity and convexity,of a granular assembly significantly affect its macroscopic and microscopic compressive behaviors under isotropic loading condition. However, limited studies on investigating the microscopic behavior of the granular assembly with real particle shapes under isotropic compression were reported. In this study, X-ray computed tomography (μCT) and discrete element modeling (DEM) were utilized to investigate isotropic compression behavior of the granular assembly with regard to the particle morphological properties,such as particle sphericity, concavity and interparticle frictions. The μCT was first used to extract the particle morphological parameters and then the DEM was utilized to numerically investigate the influences of the particle morphological properties on the isotropic compression behavior. The image reconstruction from μCT images indicated that the presented particle quantification algorithm was robust, and the presented microscopic analysis via the DEM simulation demonstrated that the particle surface concavity significantly affected the isotropic compression behavior. The observations of the particle connectivity and local void ratio distribution also provided insights into the granular assembly under isotropic compression. Results found that the particle concavity and interparticle friction influenced the most of the isotropic compression behavior of the granular assemblies.
1. Introduction
Granular media subjected to isotropic compression is accomplished by particle rearrangement (Nakata et al., 2001a, b; Mesri and Vardhanabhuti, 2009), which is achieved through particle deformation, particle rotation and particle interlocking. Particle rearrangement of the granular assembly is attained by overcoming the interparticle friction, interlocking and particle rotation; and particle morphological behaviors are extremely significant for the isotropic compression behaviors, packing properties and shearing behaviors of a granular assembly(Cho et al.,2006;Liu and Lehane,2012; Ng et al., 2018; Gong et al., 2019). The influence of particle morphology on shearing and packing behaviors has been investigated both experimentally and numerically by several researchers(Liu and Lehane,2012;Zhao et al.,2015,2017a,b,2018a,b,c;Chen et al., 2021; Hu et al., 2021), among which particle roundness, angularity, particle aspect ratio and blockiness were investigated.Moreover, the effect of size polydispersity on the compaction behavior was investigated (Kumar et al., 2014; Mutabaruka et al.,2019), and isotropic compression behavior of granular assembly with real sand particle features was studied without considering the particle surface curvatures (Zhang et al., 2020a,b). Others studies examined the particle geometry and stress states on the shearing behavior of the granular media with relative limited characterization of surface textures (Xie et al., 2017; Deng et al.,2021). In addition, the effect of particle sphericity on the fabric and mechanical behaviors was examined (Liu et al., 2019; Zhou et al., 2019; Talafha and Oldal, 2021) by considering that particles only have convex hulls (Wang et al., 2021). Although extensive studies have addressed the influence of particle morphology on packing and shearing behaviors, only a few of them investigated the compression behavior of a granular assembly by considering the real particle morphologies in association with the particle local curvatures.
In the past few decades, X-ray computed tomography (μCT)technology, which was first applied in the medical field, is now being used in engineering practice and is contributing in areas such as the visualization and quantification of not only cementitious materials(Lu et al.,2017)but also granular materials(Fonseca et al.,2013a, b). Limited work was reported to investigate the onedimensional consolidation behavior of the granular assemblies by using μCT (Reed et al., 2006; Al Mahbub and Haque, 2016). Prior studies of particle morphologies extracted from μCT were widely reported in the literature(Hall et al.,2010;Zhao et al.,2015;Li et al.,2016; Zhao and Wang, 2016; Su and Yan, 2018; Zhou et al., 2018a;Yang et al.,2019;Wu et al.,2020).A μCT-scanned granular assembly can be reconstructed by stacking the two-dimensional (2D) image slices into a three-dimensional (3D) array, and the morphological properties of each particle can be quantified by segmenting the images according to the 3D array. Commonly used approaches include spherical harmonic analysis (Garboczi, 2002; Zhou et al.,2018b; Wu et al., 2020; Xiong et al., 2020) of the surface voxel coordinates and Fourier transform technique (Podsiadlo and Stachowiak, 2000a, b). Morphological factors are dimensionless numbers applicable to particles with all geometric shapes, which are independent of scales and particle orientations (Underwood,1970). The particle morphological descriptors were, such as sphericity and roundness, calculated from the particle surface cloud points by surface reconstruction extraction or spherical harmonics(Xiong et al., 2020).
The particle surface voxel coordinates in Cartesian space can be obtained from μCT,which were used to generate the 3D surfaces via surface reconstruction. The surface voxel coordinates were imported into a commercial code(Meshlab)for processing and editing 3D triangular meshes(Cignoni et al.,2008)to generate the enclosed surfaces via Delaunay triangulation(Chew,1989).Prior to meshing,surface voxel coordinates were required to be filtered to remove the singularity points followed by the simplification and reconstruction. Therefore, the surface triangular can infinitely approximate the real surfaces and capture the corresponding surface textures,such as convexity and concavity. Thereafter, the enclosed meshes were developed with the supported format (Sereolithography file,STL)for the import of particle flow code(PFC5.0)for use in discrete element modeling (DEM) simulation. The DEM simulations presented in this paper used PFC5.0 software (Itasca, 2015) by importing the enclosed surface meshes, which then were filled with overlapping spherical particles to construct certain clump templates to simulate real particle morphologies. The macroscale behaviors of granular assemblies under confining stresses result in microscopic response (Brewer,1965; Oda,1976; Alam et al., 2018).Particle sphericity, surface texture and interparticle friction contribute to the macroscopic behaviors of a granular assembly.The smaller-scale effect of particle surface texture as interparticle friction and larger-scale effect as particle roughness are comparable to interface friction and roughness.
Particle morphological properties are significantly important for granular assemblies with non-spherical particles. Influential factors, such as particle shape and particle angularity, were studied.However, very little work in the literature focused on comprehensive analysis of the influence of the properties on isotropic compression behaviors. Besides the compression from particle rearrangements that resulted in the shrinking of void spaces, the occupancy of surface concave hulls could be an important influential factor that contributes to the compression,due to significant amount of concave hulls for the granular assemblies with nonsphere particles. On the other hand, limited work was found to investigate the influence of surface curvatures (e.g. convexity and concavity) on the compression behaviors of the granular assemblies with non-spherical particles. Therefore, besides examining the influence of particle sphericity on the compression behavior of the granular assembly with non-spherical particles, an inclusive analysis was conducted to explore the influence of particle surface curvatures on the compression behavior of the granular assembly with non-spherical particles.The μCT was employed to scan Ottawa 20-30 sands in a cylindrical container with a dimension of 5 mm(D)×5 mm(H).In order to capture the surface textures of the sand particles,the scanning resolution was set at 10 μm.Thus,there were a total of 500 slices of grayscale images for the whole sample.The grayscale images then were binarized to save computational resources and to perform the morphological image processing(MIP),such as image erosion,image dilation, and image opening/closing.
2. Particle extraction of Ottawa sands by using μCT
2.1. MIP
Fig. 1 shows the diagram of the particle extractions of the Ottawa sands from the μCT images via MIP. The grayscale images(Fig. 1a) were binarized by applying a global threshold with a luminance threshold of 0.5 to consist of only white and black pixels(Fig. 1b) before being stacked as 3D images. The global image threshold was selected by referring to Otsu’s method (e.g. Otsu,1979) according to the discriminant criterion. After being stacked as a 3D image/matrix (Fig. 1c), the granular assembly was represented by only black and white pixels.MIP then was performed to identify the particle surface pixels and extracted to separated particles(Fig.1e).The Ottawa sands were placed into a plastic cylinder and compacted with vigorous vibration followed by one week’s settlement to avoid the potential movements during μCT scanning prior to image acquisition. The sample preparation method for obtaining μCT images presented in this paper was different from that reported in Zhou and Wang (2017) and Zhou et al. (2018a),where the sand particles were manually set separately by embedding them in a jelly phase.Therefore,the accurate determination of particle size distribution was limited.The μCT images reported did not show an accurate particle gradient or particle size distribution.
Due to that the sand particles were in contact with one another,the μCT images were required to be segmented into separated particles.There are several types of segmentation techniques,such as region-based segmentation, edge detection segmentation and segmentation based on clustering. Typically, classic watershed segmentation was applied for the image segmentation (Beucher,1992; Osma-Ruiz et al., 2007; Sun et al., 2019). Instead of using watershed segmentation, in this study, the authors utilized the morphological processing techniques, such as erosion, dilation,opening and closing, to segment the contact particle due to the accessibility for implementation. In this study, image erosion and opening were required first to segment into different separated particles. The disk-shaped structuring element with a radius of 5 pixels was used for first erosion followed by opening the binary images. Image erosion removed the small-scale details from the binary images while simultaneously reducing the size of the object without changing the surface topographic properties. The images were then opened by using the same structural element to avoid the boundary losses.The particles then were separated by using the identical structural element during the image morphological analysis. The ultimate erosion was performed to erode each separated particle to a single point for labeling separated particles.The particle edges then were detected and assigned the same label as the corresponding ultimate erosion point to represent each particle for the calculation process of the morphological parameters that followed.Fig.2 details the MIP procedures applied in this study.
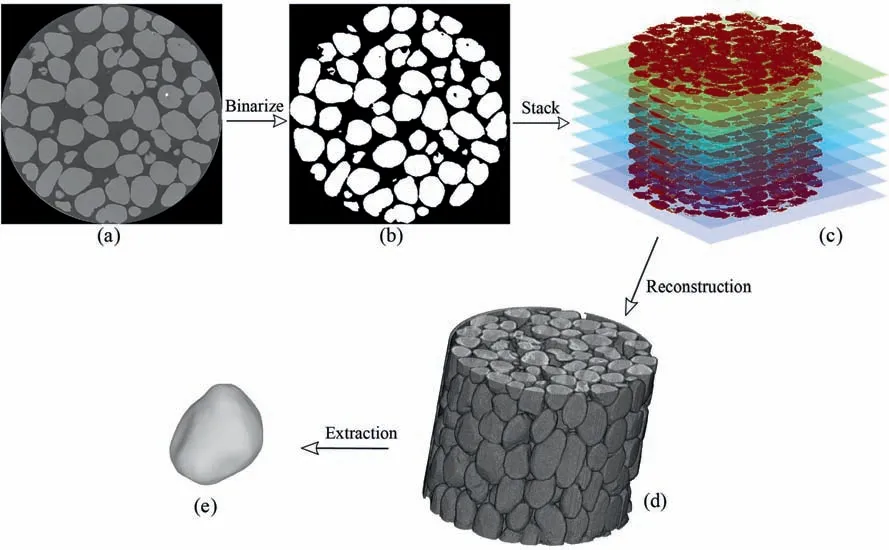
Fig.1. Particle shape extraction scheme: (a) Grayscale image slice, (b) Binarized image, (c) Stacked images, (d) 3D reconstructed images, and (e) Extracted particles.
2.2. MIP verification
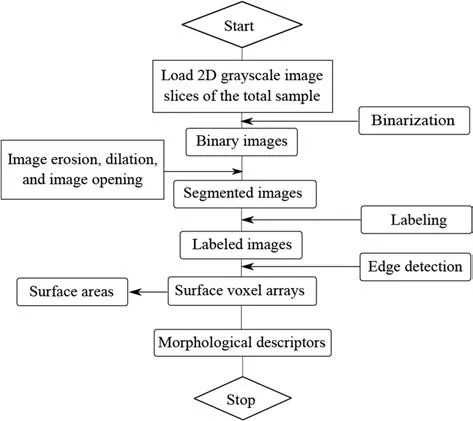
Fig. 2. Morphological image processing procedures.
The MIP algorithms were verified by comparing the grain size distributions obtained from the μCT data to the experiments of the Ottawa 20-30 sands. For the selected μCT small sample, using image erosion and other MIP introduced above,43 closed particles were separated.The particle diameters were determined by setting the volumes of the spheres with diameters D equal to the real particle volumes.The particle sizes obtained from MIP ranged from 0.4 mm to 0.82 mm.The grain size distributions from experimental test, fitted equation from Fredlund et al. (2000), and image processing in this study are shown in Fig. 3. The coefficient of uniformity obtained from image processing is Cu=1.27,the coefficient of curvature is Cc= 1.03, and the median grain size D50= 0.75 mm.
The comparisons of Cu,Ccand D50between the image processing and the laboratory tests are shown in Table 1. Image processing provided a larger coefficient of uniformity compared to the laboratory tests. Due to the resolution of the image, there were disturbances when preparing the sample, which caused some particles to be inadequately separated and relatively smaller particles were not counted.There were grade gaps for the smaller and larger particles, as shown in Fig. 3. The missing smaller particles resulted in the relatively smaller D10(which is the particle diameter that defines 10% finer from the grain size distribution curve),leading to the larger Cu. The equivalent diameters of the particles obtained from μCT images were different from those from experiments which result in relatively narrower particle size. In general,the grain size distribution obtained from image processing was consistent with those from the performed laboratory tests.
The performed MIP algorithms were also verified by comparing the particle equivalent diameters with the ones obtained from marker-controlled watershed segmentation put forward by Wählby et al. (2004) and utilized by Wu et al. (2020) and Xiong et al. (2020) to successfully segment the CT-scanned specimen with quartz particles. In order to conduct the marker-controlled watershed segmentation, a distance map representing the distance between each pixel and its corresponding surface boundaries was created.Fig.4 compares the particle sphericities between two different segmentation methods. Results show that the particle equivalent diameters from two different methods have a good compatibility.
Particle sphericity or roundness then was calculated according to the particle surface coordinates and particle information.Referring to Wadell (1935), particle sphericity φ can be defined as the ratio of the surface areas between a sphere which has the same volume as the given particle and the surface area of the particle:

where V is the particle volume, and S is the particle surface area.Fig. 5 shows the particle sphericity distribution of the granular assembly scanned by μCT. The particle sphericities of the Ottawa sands were found to be linearly distributed from 0.917 to 0.977,which were slightly larger than the reported results in the literature(Lee et al., 2007; Kim and Santamarina, 2008; Zheng and Hryciw,2016). Granular assemblies with five different sphericities(φ = 0.917, 0.949, 0.962, 0.964 and 0.977) shown in Fig. 5 were selected for analysis in the following DEM analysis.
Obviously, φ is a measurement of the ratios between areas;however, the convexity or concavity surface curvatures of real Ottawa sands cannot be effectively captured. For convex particles,particle sphericity is another element of particle angularity, as shown in Zhao et al.(2015)and Chen et al.(2020);however,using only convex particles cannot capture the surface textures of real Ottawa sand particles. In real particles, those with convex and concave hulls behave like interlocking gears to withstand shearing and compression.
3. Surface curvatures of the enclosed particles
As introduced above, particle sphericity was used to evaluate how closely the particle resembled the sphere. However, its proximity did not capture the influences of particle surface textures on the consolidation or shearing behavior of the granular assembly.Concavity and convexity were significant to the granular particle’s behavior with regard to the interlocking among particles during consolidation and shearing.The surface curvatures of the particles were therefore introduced to explain the influence of surface texture on the mechanical behaviors during isotropic compression of the granular assembly. Surface textures were quantified by calculating the surface mean curvatures using the 3D surface coordinates introduced above. Particle convexity and concavity presented in this paper were defined as the average positive and negative values of the mean curvature,respectively.Therefore,the correct calculation of mean curvature of the selected particles was significant to obtain the particle convexity and concavities.
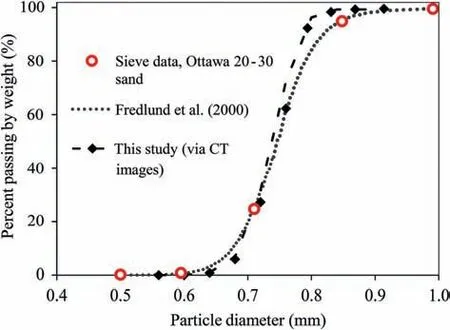
Fig.3. Grain size distribution of Ottawa 20-30 sands obtained from various methods.
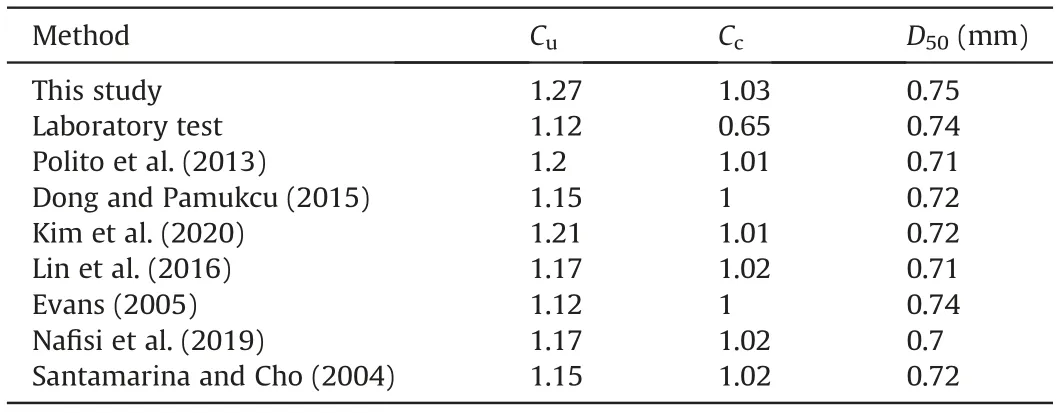
Table 1 Comparisons between image processing and laboratory tests.
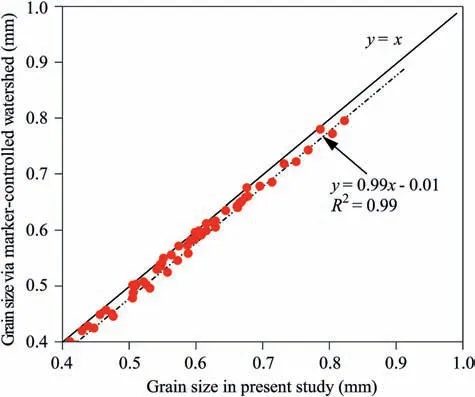
Fig. 4. Particle sphericities between two different segmentation methods.
The particle surface pixels obtained in Section 2 were mapped into Cartesian space for calculating the surface curvatures. Let κ1and κ2be the two principal curvatures of surface U(u,v) shown in Fig.6,two different surface curvatures,i.e.mean curvature(H)and Gaussian curvature (K) are calculated as

The values of the mean curvatures of a point on the surface U have significant geometric meanings (O’neill, 2006). The negative values of mean curvatures indicate that there are concave hulls existing within the surface. In the spatial surface shown in Fig. 6,the mean curvature of the surface R3at a point p can be given as

where E,F and G are the coefficients of the first fundamental form;and N,M and L are the coefficients of the second fundamental form.Two parametric variables, i.e. u and v, are typically used to represent the surface S. Suppose x: U→R3is a regular patch, the shape operator S of x in the basis of {xu, xv} is given as
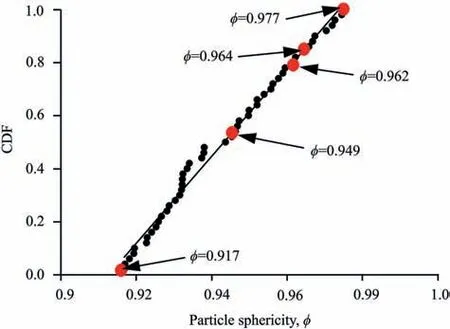
Fig.5. Particle sphericity accumulative distribution obtained from μCT.CDF represents the cumulative distribution function.
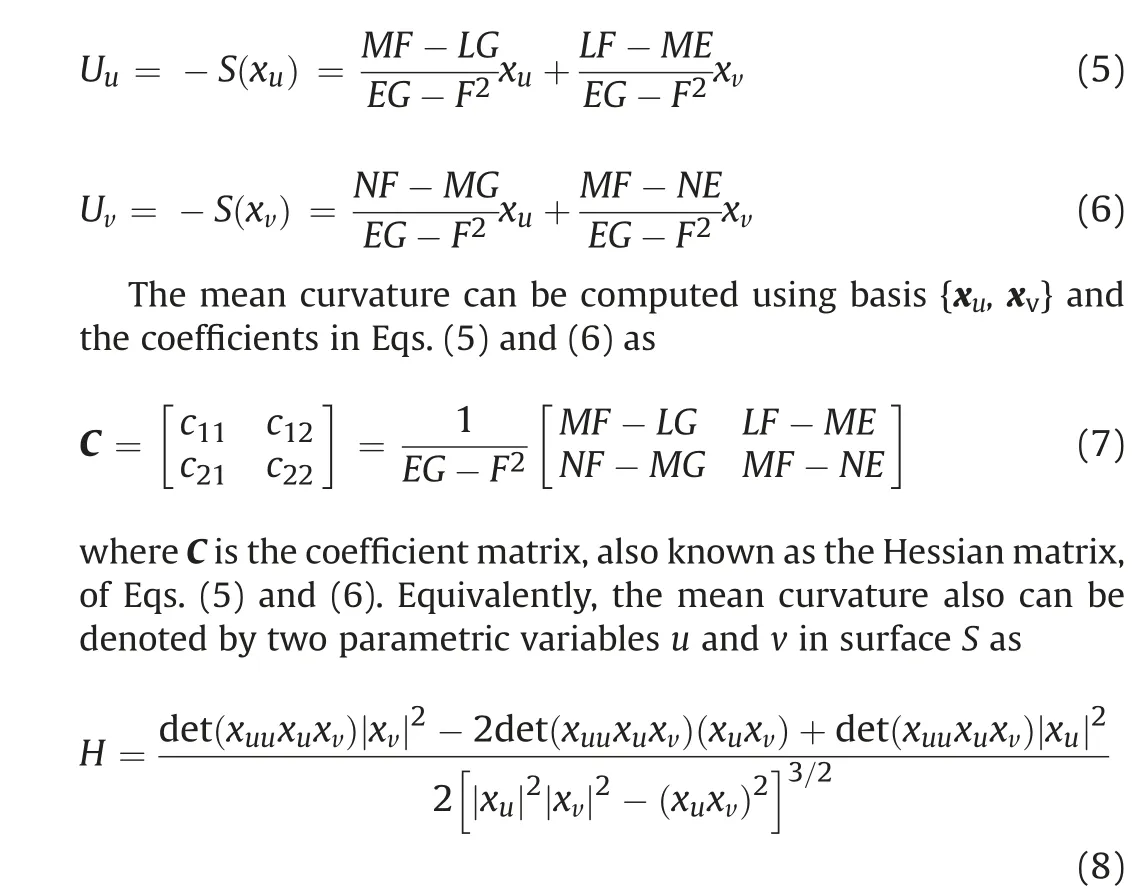
Fig. 7 shows the mean curvature distributions of the selected particles. The results show that the trends of particle sphericity were not consistent with the trends of the mean curvatures(e.g.the average mean curvature at the smallest sphericity φ=0.917 was the largest).There were both convex and concave hulls of the selected particles. The mean curvature distributions for similar sphericities were different (e.g. the average mean curvatures at φ = 0.962 and 0.964 were equal to 8.907 and 6.121, respectively).
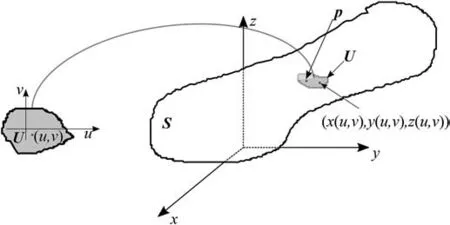
Fig. 6. Surface diagram.
4. Discrete element modeling
The particle surface voxel coordinates in the Cartesian space were extracted via the 3D image reconstruction shown in the section above.Five different particles with different morphological properties were selected in this study to perform the DEM simulations, as shown in Figs. 5 and 8. First, the particle surface coordinates were imported to Meshlab (Cignoni et al., 2008) to generate the 3D closed surface meshes by using Delaunay triangulation, and then exported as STL file. PFC5.0 supports STL file to generate the particle templates with different shapes, as shown in Fig.8.The particle geometries shown in Fig.8 are the closed surface(STL file) extracted from 3D image reconstructions, which then were used in the simulations in this study. The radius ratio of the smallest to largest pebble was kept as 0.5 for all the clump template. PFC5.0 has different resolution setups to ensure that the particle clumps mimic the real particle shapes by determining the angular measure of smoothness,d,in the range between 0 and 180.The results show that a higher d produced higher similarity to the real particles of Ottawa sands and thus better captured the surface textures. However, these results were more computationally expensive.
In order to better capture the surface textures,the resolutions of the clump templates needed to be large enough. Fig. 8 shows that the surface morphological features were precisely captured when the resolution distance d was between 150 and 170. Referring to Gao and Meguid (2018) and Liu et al. (2017), the clump template can approximately identically capture the surface geometries of the particles when the resolution distance equals 150. Therefore, the distance in the DEM simulations was selected as 160 to represent the clump templates as real Ottawa sand particles. At such resolution distance, the particle morphological properties can be captured precisely. For each simulation, particles with the same shape but different sizes were randomly distributed within a cube.The geometry of the 3D DEM model is shown in Fig. 9. The cubic assembly was filled with particle templates with different diameters with respect to the particle size distribution of the Ottawa 20-30 sands shown in Fig. 9, which were generated by filling the spherical particle with STL-enclosed particles with a user-defined porosity (n = 0.75). Note here that the diameters of the real particles in the simulations were defined as equivalent diameters,which were calculated by ensuring that the volume of the spheres with the equivalent diameters is equal to the volume of the corresponding real particles (Nie et al., 2020). Density scaling was employed to decrease the computational expense (Belheine et al.,2009; Zhao et al., 2018a).
The particle numbers for granular assemblies with different particle morphological features were set relatively the same (relative error±1%)to ensure that the initial void ratios were relatively similar. The particle numbers for all the simulations were within the range from 4612 to 4654 bonded by 241,160 to 251,211 spherical particles with an average of 53 spherical particles to bond one clump, respectively, which were sufficient to obtain isotropic consolidated states (Ng, 2009; Yimsiri and Soga, 2010; Zhao et al.,2018a, b). The DEM model consisted of clump templates and model boundaries. The clump templates were randomly distributed within the cube with a certain level of overlap initially. The assemblies then were cycled to numerical equilibrium to ensure that the overlapped particles were released and distributed without overlapping.Therefore,the initial porosity for the isotropic compression of the granular assemblies was equal to the userdefined porosity during particle generation, and different interparticle friction coefficients then were set up. A numerical servocontrol mechanism was used in all the simulations by adjusting the positions of the boundary walls until the target isotropic confining stresses and the corresponding equilibrium were reached with the same tolerance (±0.5%).
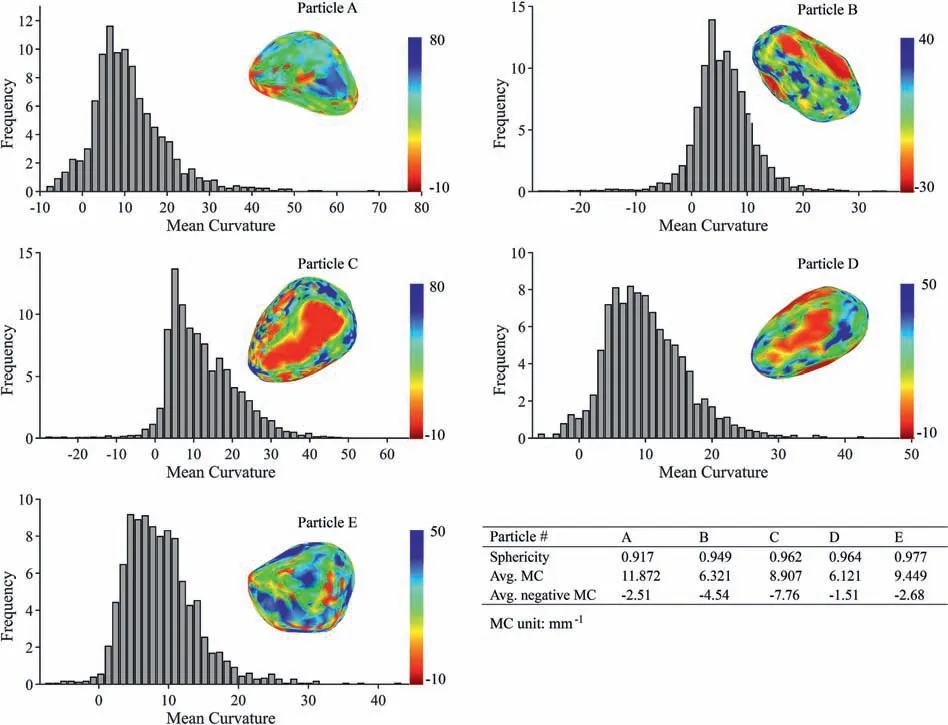
Fig. 7. Particle mean curvature distributions for selected particles. Color bar indicates the mean curvature (MC) of each patch of the particle surface.
A linear spring contact model is used in the study with a Coulomb’s friction law to govern the particle sliding (Zhao et al.,2017a,b; Zhang and Evans, 2017, 2019; Zhang et al., 2019; Zhang et al., 2020a,b). The linear spring contact model can yield similar results as using nonlinear Hertz-Mindlin contact model (Zhao et al., 2018a, c). The particle parameters are selected according to the literature (Cho et al., 2006; Fu et al., 2017; Zhao et al.,2017a,b; Ma et al., 2018; Zhang et al., 2019). The shear and normal contact stiffnesses were selected as ks=8×10⁷N/m and kn= 1 × 10⁸N/m, with ks/kn= 0.8 in the range suggested by Cundall and Stack (1979). We refer to the smaller-scale effect of particle surface texture as interparticle friction and larger-scale effect as particle roughness as comparable to interface friction and roughness reported by Zhang and Evans (2018) for the granular-continuum interface shearing.The interparticle frictions are set as one of the dominant parameters as μp= 0.31, 0.45 and 0.62 referring to the interparticle friction coefficient reported in the literature (Liu and Matsuoka, 2003; Muthuswamy and Tordesillas, 2006; Guo and Su, 2007; Antony and Kruyt, 2009;Zhang and Evans, 2016), where the interparticle friction coefficient μpis reported from 0 to 0.8. The particle roughness effect is interpreted by considering the differences of the surface curvatures. The interparticle friction coefficient is commonly used to control the relative density of the granular assembly for DEM simulation of shearing (Rothenburg and Kruyt, 2004; Fu et al.,2017; Zhao et al., 2018a; Zhou et al., 2018a,b).
The particle diameters of five different sets of particles were modified according to the equivalent diameters of the nonspherical particles to ensure that the particle size distributions were the same as that of real Ottawa 20-30 sands.The particles in Fig. 9 are colored according to the equivalent diameters with the same particle sphericity for one simulation. The particle sphericities of the selected particles were calculated by Eq.(1)as φ=0.917,0.949, 0.962, 0.964 and 0.977. A total of 15 simulations were conducted at six different work stations (Xeon E3-1240 v3 and Xeon Sliver 4216 CPUs) to investigate the influence of particle morphologies on the isotropic compression behaviors of a granular assembly. The particles for each simulation were generated with the same porosity initially and then cycled to their equilibrium.There were approximately 181 core-hours simulation conducted for all the selected cases with the iteration of each simulation approximately equal to 1.4 million times.
5. Results and discussion
5.1. Compression index, Cc
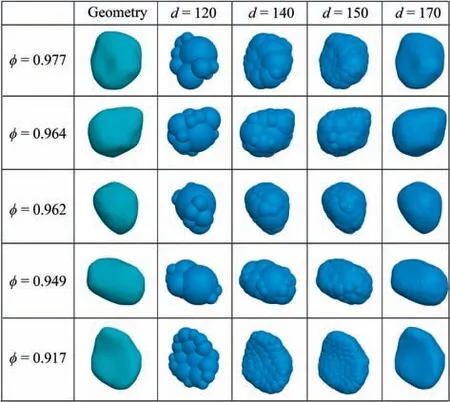
Fig. 8. The selected particle shapes of Ottawa sands under different generation resolutions when dmin/dmax = 0.5, where dmin and dmax are the radii of the smallest and largest pebbles within each template, respectively.
Fig.10 shows the e-log10P′curves of the granular assembly as a function of the particle sphericities for different types of interparticle friction,where e is the void ratio,and P′is the confining stress.After assigning different interparticle frictions,the void ratio of the granular assembly for different particle sphericities and interparticle frictions changed tremendously from an initial porosity of 0.75 to ranges from 0.62 to 0.73 when the confining stress was kept equal to 40 kPa. The large difference may have resulted from the different forming skeletons within different granular assemblies.The results show that the larger the interparticle friction,the larger the void ratio of the granular assembly. We assumed that preconsolidation stress was induced by the generation of particles and cycling the granular assemblies until their equilibrium, which may have resulted from certain amounts of particle overlaps.The elog10P′curves shown in Fig.10 have curvature transitions.Referring to Casagrande (1936) and Zhang and Evans (2018), the preconsolidation stress was recognized as between 1 MPa and 2 MPa, where an abrupt onset of increased deformability was recognized for all the simulations. The pre-consolidation pressure,which was named by Mesri and Vardhanabhuti (2009) as “yield stress”, has been associated with the particle generation mechanism where significant overlaps existed before the samples were cycled to their equilibrium.
Results in Fig.10 indicate that there was an inflection point that marked the "yield point" of the compression as reported by Mesri and Vardhanabhuti (2009). The inflection point was recognized as approximately in between 1 MPa and 2 MPa. According to the definition, the tangential line at higher level estimates the coefficient of compression. Therefore, the compression index, Cc= Δe/Δlog10σ′p, was estimated by calculating the slopes of the tangent line of the compression curve (as indicated by Fig.10), which was approximated to the slope of the connecting line between P′= 10 MPa and 50 MPa in linear-log space (Roberts,1958; Mesri and Vardhanabhuti, 2009; Holtz et al., 2011; Zheng et al., 2017).Fig.11a shows the compression index and particle surface concavity as a function of particle sphericity for different interparticle frictions. The bar on the secondary axis shows the particle surface concavities, which were defined as the average values of the negative surface mean curvatures calculated from all the vertex of the enclosed meshes shown in Fig.7.Fig.11b directly plots the Ccas a function of particle concavity for different interparticle frictions.Results evidently indicate that the larger the particle concavity,the larger the compression index,Cc.On the other hand,particles with large surface concavities have more concave hulls that could contribute to the compressive behavior of the granular assembly.As mentioned above, the particle surface mean curvatures were not consistent with the particle sphericity. The results in Fig.11 show that the compression index first increased with the particle sphericity, then dropped sharply, and followed by a relative plateau.
The compression index was not found to have a certain relationship with particle sphericity;however,the trend was consistent with the average value of the negative surface mean curvatures,the surface concavity of the selected particles, which is shown as the bars in Fig. 11. Table 2 shows the quantification of the particle surface texture for different particle sphericities. As defined in Section 3, the convexity and concavity of the particle surfaces correspond to the local mean curvatures of the selected particles.Results show that the larger the absolute value of concavity, the larger the compression index, Cc. In other words, the granular assembly was more compressible if there were more surface concave hulls.The convex hulls of the particle penetrated/filled the concave hulls of the neighboring particles comparable to cogwheels,which is the main influential factor of isotropic compression behavior for a granular assembly with non-spherical particles. Therefore, further interpretations will be based on the influence of particle concavity on the compression behavior of the granular packing.
5.2. Particle connectivity
Particle connectivity frequency, Pc, was introduced to interpret the contact networks according to Liu and Matsuoka (2003) and Mutabaruka et al. (2019), which was defined as the frequency distributions of the particles with different contact numbers.Comparable to coordination numbers, the particle connectivity number is another mathematical descriptor to define the packing density of a granular assembly (Mutabaruka et al., 2019). As discussed in Section 3, the selected particles were generated by bonding numerous spherical particles into one single non-spherical particle as the template to generate the granular assemblies as shown in Fig. 9. The distance selected for the five particles in the DEM simulations was 160,which can identically capture the surface textures of the real particles (Liu et al., 2017; Gao and Meguid,2018). The contact detection of each particle was obtained from the enclosed spherical particles. Therefore, total contact numbers can be obtained as the summation of the contacts from each enclosed spherical particles(Liu et al.,2017;Zhang et al.,2020a,b).For a granular assembly with non-spherical particles, due to the existing interlocks among the convex and concave hulls, the particle connectivity did not dominate the force transmission of the granular assembly. However, connectivity was found to be significant for non-mechanical transmissions among the particles within a granular assembly, such as thermal conductivity (Pestana and Whittle,1995).
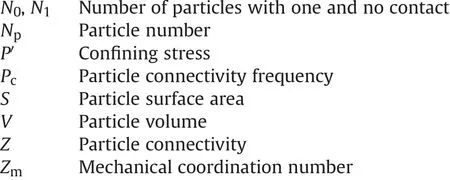
According to Liu and Matsuoka(2003),the coordination number was calculated by multiplying the particle connectivity frequency with the corresponding contacts as Z = ∑C(CPc), where C is the contact number. Since the particles with zero and one contact do not contribute to the mechanical stability of a granular assembly,its stability can thus be calculated without considering Pcfor zero and one contact as Zm=∑C(CPc)(C>1).The mechanical coordination number calculated herein is an alternative approach reported by Thornton (2000), where the mechanical coordination number is defined as

where N1and N0are the numbers of particles with one and no contact, respectively; and Npis the particle number. Fig.12 shows the correlations of mechanical coordination numbers between the two different methods. The results calculated according to Thornton (2000) (ordinates shown in Fig.12) is a little larger than the results calculated from particle connectivity. The results from the two different methods were linearly correlated with a coefficient of correlation of 0.986.
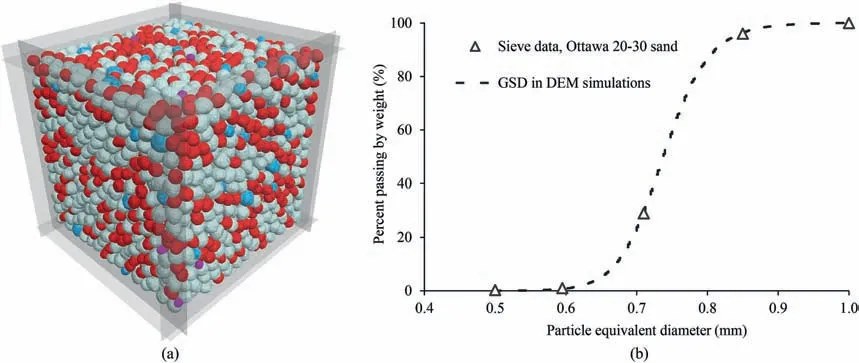
Fig. 9. (a) The geometry of the DEM model and (b) the particle size distribution of the granular assembly.
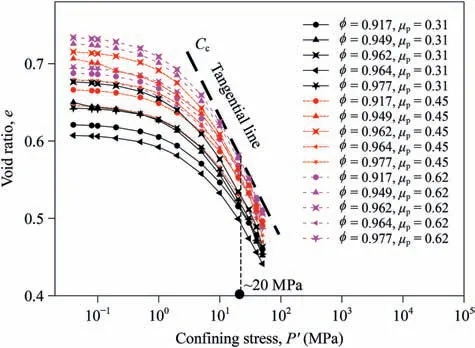
Fig. 10. e-log10P′ curves for different particle sphericities with different interparticle friction coefficients.
Fig. 13 illustrates the evolution of the normalized mechanical coordination number as a function of confining stress for different interparticle frictions and particle concavities. The mechanical coordination numbers were multiplied with the corresponding absolute value of concavities. For all the selected samples with different interparticle frictions,Zm|H-|increased with the increase of particle concavity. Zm|H-| values were observed to be closely correlated to the surface curvatures, especially the concave hulls.The samples with the lowest particle concavity had the smallest normalized mechanical coordination numbers for all the selected confining stresses, and the samples with the largest particle sphericities had the smallest Zm|H-|for all the selected interparticle frictions. This demonstrates that particle concavity was the dominant parameter that determined Zm|H-| due to the potential changes of particle interlocks that could contribute to the evolution of Zm|H-|.
5.3. Contact force distribution

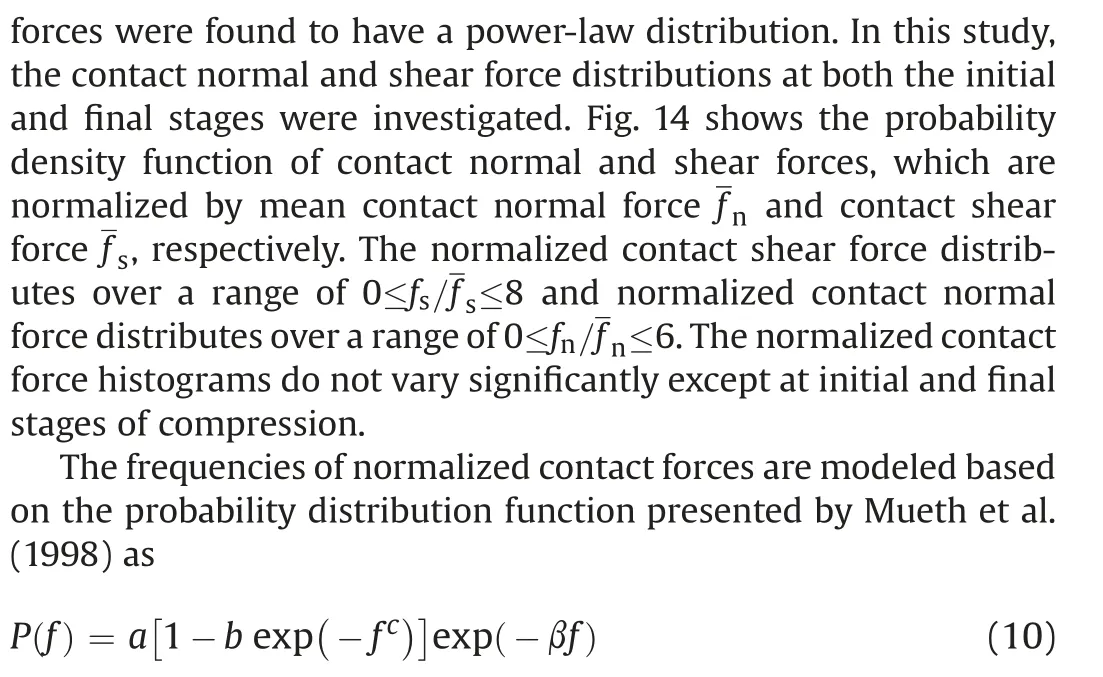
where P(f)is the probability density function; and a,b,c and β are the fitting parameters. The bold lines shown in Fig. 14 are the contact shear and normal force distributions under lower confining stresses (P′= 40 kPa), and the dashed lines are the best fits of normalized contact normal and shear forces for Eq. (10) at high confining stresses(P′=2000 kPa).The probability densities of the normalized contact forces exhibited obvious changes between the low and high confining stresses (i.e. larger confining stresses had narrower normalized contact forces), which is consistent with the results presented by Khalili et al. (2017). Table 3 list the fitting parameters of normalized contact force for different parameters.
5.4. Local void ratio distribution
Void ratio is one of the major physical parameters governing the mechanical or compression behavior of a granular assembly(Frost and Kuo,1996; Evans and Frost, 2010). Local void ratio of sand assembly was first quantified by Oda (1976) using 2D image processing techniques. The mechanical behavior of a granular assembly depends on the particle and void arrangements to a large extent; therefore, the distribution of the local void ratio is a significant factor that describes its mechanical behaviors(Dong et al.,2016;Zhao et al.,2018c).The local void ratio is defined as the ratio of the volume of the void space that surrounds the particle to the volume of the particle(Evans,2005;Al-Raoush and Alshibli,2006).
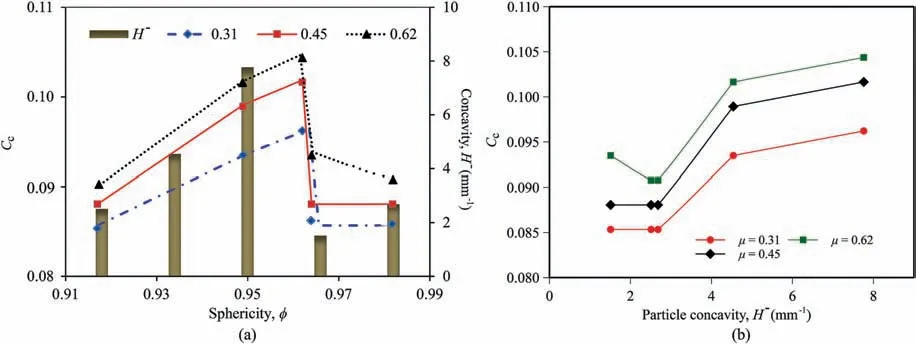
Fig.11. (a) Coefficient of compression, Cc, and concavity, H-, as a function of particle sphericity; and (b) Coefficient of compression, Cc, as a function of particle concavities for different interparticle frictions.
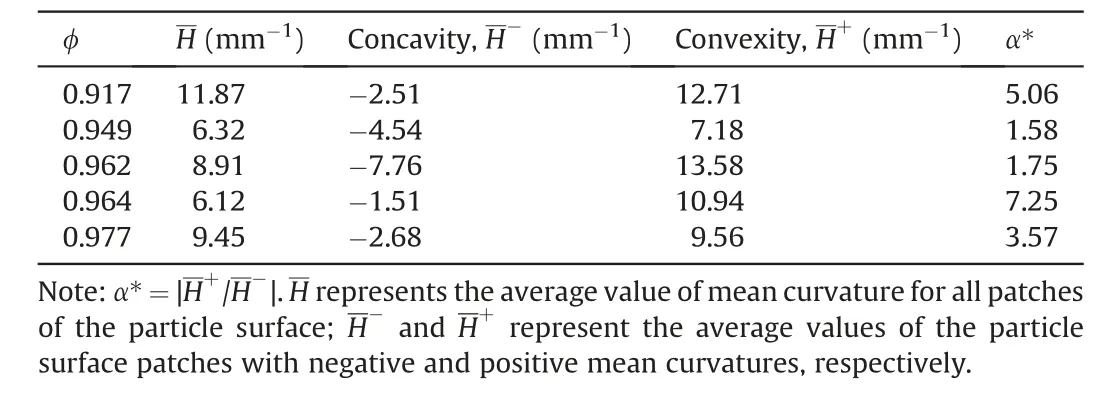
Table 2 Particle surface texture quantification for different particle sphericities.
The spatial coordinates (e.g. x, y, z, r) of the pebbles, which construct the particles,were exported from PFC5.0 and imported to MATLAB to generate 2D binary images for calculating the local void ratio of the granular assembly. There are two predominant approaches to obtain local void ratio distributions for binary images,both of which were based on Oda (1976)’s method. Voronoi tessellation was also utilized to obtain the local void ratio of the granular assembly (Alshibli and El-Saidany, 2001; Zhao et al.,2018c). Evans and Frost (2010) proved that 2D simulations exhibit void-scale behaviors comparable to the 3D physical counterparts.Therefore,the local void ratio distribution obtained in this study is based on the segmentation of 2D binary images.A total number of 100 slices of 2D cross-sectional images were selected perpendicular to the z-direction with identical intervals. Fig.15 shows a diagram of segmentation for 2D binary images.The image was divided into different polygons enclosed by straight lines connecting the gravity centers of the particles (Oda,1976; Al-Raoush and Alshibli, 2006;Evans and Frost,2010).As mentioned above,the gravity centers of each particle were the ultimate eroded points of each particle,which were obtained by performing MIP. The local void ratios of each polygon were measured by counting the void and solid pixels.The local void ratios of a granular assembly for different confining stresses were obtained by counting 100 slices of its 2D images for estimation. Fig. 16 shows the local void ratio distribution of the granular assemblies for different particle sphericities. The probability density distributions were fitted to the generalized extreme value distribution as
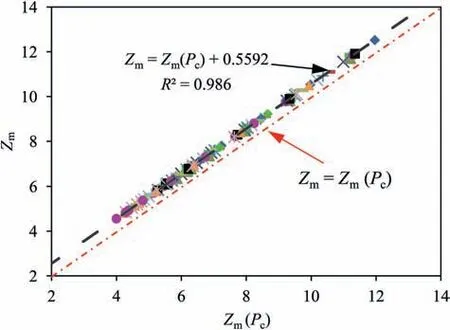
Fig.12. Mechanical coordination number correlations between two different methods.

where σ is the scale parameter,μ is the location parameter,and k is the shape parameter. The results show that a granular assembly with larger particle sphericity had the lowest value.The μ value was found to be the smallest when φ =0.977. The influence of particle sphericity on the local void ratio distribution is not obviously observed.
The location parameter μ of the generalized extreme value distribution is a reflection of the void ratio.Fig.17a shows the μ as a function of particle concavity for different confining stresses. Results show that μ decreases with the increase of particle concavity.Larger concavity corresponds to more concave hulls of the particle surface. Fig. 17b shows the correlations between the location parameter μ and the global void ratio. The global void ratio had a linear relationship with location parameter μ as e = 0.83μ + 0.21 with a coefficient of determination of R2=0.932.The μ values were smaller than the global void ratios for all the scenarios in this study.The results reveal that at each isotropic compression status, the granular assembly reached the same isotropic stress when subjected to identical isotropic compression values. Notwithstanding,the sample configurations, particle rearrangements, and corresponding microscopic fabrics(e.g.local porosity,connectivity)were different due to the particle morphological properties.
6. Conclusions

Fig.13. Evolution of the normalized mechanical coordination number under different confining stresses for different concavities at different interparticle friction coefficients: (a)μp = 0.31, (b) μp = 0.45, and (c) μp = 0.62.
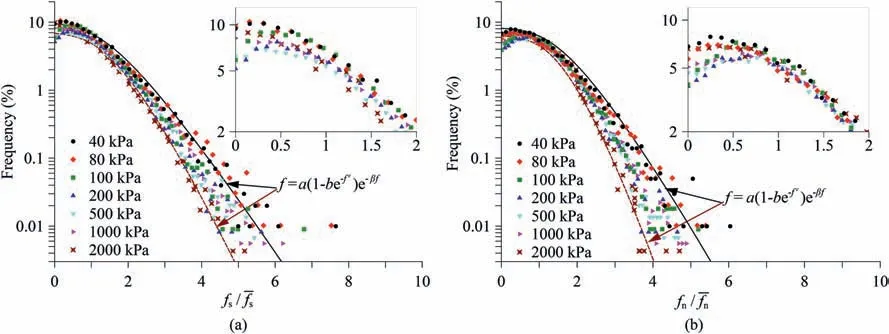
Fig.14. Frequencies for different confining stresses (H- = 2.51, μp = 0.45): (a) Normalized contact shear force distribution, and (b) Normalized contact normal force distribution.

Table 3 Fitting parameters of normalized contact force for different parameters.
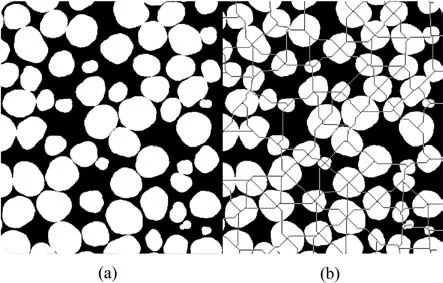
Fig.15. Comparison of 2D binary images (a) before and (b) after being segmented.
In this study, the influences of particle sphericity, interparticle friction and particle surface curvature on the isotropic compression behaviors of granular assemblies with non-spherical particles were investigated. The particle shapes were based on Ottawa 20-30 sands extracted from μCT images and MIP. The extracted particles from the μCT images then were used for DEM simulation. Microscopic insights were reported by drawing from the particle-scale responses of the granular assembly. The main conclusions can be drawn as follows:
(1) A new,easy-implemented image processing technique based on morphological image analysis was introduced. The introduced technique was verified by comparing the particle size distribution obtained herein and the sieve analysis from laboratory test, and also the equivalent diameters between the introduced technique and watershed segmentation were compared. The particle size distribution obtained from MIP of μCT images was consistent with the laboratory tests.
(2) For the granular assembly with non-spherical particles, the particle concavity was found to have significant influences on compression behavior which is directly related to the compression index in e-log10P′space for the granular assembly with all the interparticle frictions. The larger the particle concavity, the larger the compression index of the granular assembly.
(3) The particle connectivity or coordination number of the granular assembly was found to be largely influenced by the confining stress and the particle concavity for all the selected interparticle frictions. However, particle concavity had the dominant influence on the mechanical coordination number of the granular assembly. Granular assemblies with analogous particle concavity behaved in a manner comparably equivalent as the function of confining stress.
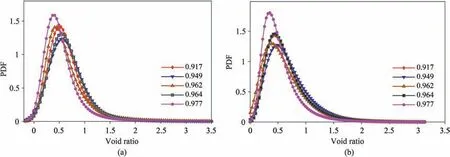
Fig.16. Local void ratio distribution of the granular assembly with different particle sphericities for confining stress equal to (a) 100 kPa and (b) 2000 kPa. PDF stands for the probability density function.
(4) The normalized contact forces were distributed differently between the low and high confining stresses but were distributed more narrowly for granular assemblies at high confining stress. The local void ratio for all the particle sphericities was fitted approximately into generalized extreme value distributions without being evidently influenced by the sphericity or concavity. However, the location parameter μ,which determines the average value of the local void ratio, was related to the particle sphericity and surface curvature. Larger particle sphericity had a smaller μ value.
Declaration of competing interest
The authors declare that they have no known competing financial interests or personal relationships that could have appeared to influence the work reported in this paper.
Acknowledgments
The financial support provided by the Universidad Nacional de San Agustín (UNSA) through the joint Center for Mining Sustainability with the Colorado School of Mines is highly acknowledged.The authors would thank the Information and Technology Solutions (ITS) at Colorado School of Mines for the computational assistances provided for this work. The authors also highly acknowledge the anonymous reviewers for their constructive comments that improved this work to a better level.
 Journal of Rock Mechanics and Geotechnical Engineering2021年5期
- Journal of Rock Mechanics and Geotechnical Engineering的其它文章
- Surface characteristics analysis of fractures induced by supercritical CO2 and water through three-dimensional scanning and scanning electron micrography
- Prediction of fracture and dilatancy in granite using acoustic emission signal cloud
- Hysteresis in the ultrasonic parameters of saturated sandstone during freezing and thawing and correlations with unfrozen water content
- Coupled Eulerian-Lagrangian simulation of a modified direct shear apparatus for the measurement of residual shear strengths
- A novel true triaxial test system for microwave-induced fracturing of hard rocks
- Hydromechanical behavior of unsaturated expansive clay under repetitive loading
