
Temperature and current sensitivity extraction of optical superconducting transition-edge sensors based on a two-fluid model∗
2021-09-28 02:18YueGeng耿悦PeiZhanLi李佩展JiaQiangZhong钟家强WenZhang张文ZhengWang王争WeiMiao缪巍YuanRen任远andShengCaiShi史生才
Chinese Physics B 2021年9期
关键词:张文
Yue Geng(耿悦),Pei-Zhan Li(李佩展),Jia-Qiang Zhong(钟家强),Wen Zhang(张文),†,Zheng Wang(王争),Wei Miao(缪巍),Yuan Ren(任远),and Sheng-Cai Shi(史生才),‡
1Purple Mountain Observatory,Chinese Academy of Sciences,Nanjing 210023,China
2University of Science and Technology of China,Hefei 230026,China
3Key Laboratory of Radio Astronomy,Chinese Academy of Sciences,Nanjing 210023,China
Keywords:transition-edge sensor,single-photon detector,two-fluid model
1.Introduction
Superconducting transition-edge sensors(TESs)are capable to resolve the energy of a single optical/near-infrared(NIR)photon and have been used in quantum information,[1]biological imaging,[2]and fluorescence microscopy.[3]Optical TESs have exhibited a system quantum efficiency of nearly 100%at optical/NIR wavelengths.[4,5]Titanium(Ti)TES with a critical temperature(TC)of 470 mK shows a time constant as short as 0.2µs,[6]making MHz counting rate possible in photon metrology fields,while high-energy resolution(ΔE)is necessary for quantum-key distribution applications.To improveΔE,one can develop optical TESs with small heat capacity(C)or low TC.For a 25-µm square tungsten TES with a TCof 178 mK,aΔE of 0.29 eV has been achieved,[4]while a 10-µm square Ti/Au bilayer TES with a TCof 105 mK exhibits aΔE of 0.113 eV.[7]The theoreticalΔE can be written as[8]


2.Extraction of parameters
Firstly,we introduce the two-fluid model that separates the sensor’s current into a superconducting component and a quasiparticle component,from whichαIandβIcan be calculated,and then C is extracted in combination with the measured pulse response.
2.1.Two-fluid model
In the two-fluid model,the total current through a TES is described as a combination of a normal and a supercurrent,I0=CIIC+V0/(CRRn),[11]where CIis the supercurrent to critical current(IC)ratio and CR=2NρΛQ/Rn,in whichρis the normal-state resistance per unit length,ΛQis the charge imbalance relaxation length,and N is the number of phase-slip lines.The TES resistance can be expressed as[12]

where IC0is the zero-temperature ICof the film.[11]The twofluid model relatesαIandβIto the two key parameters
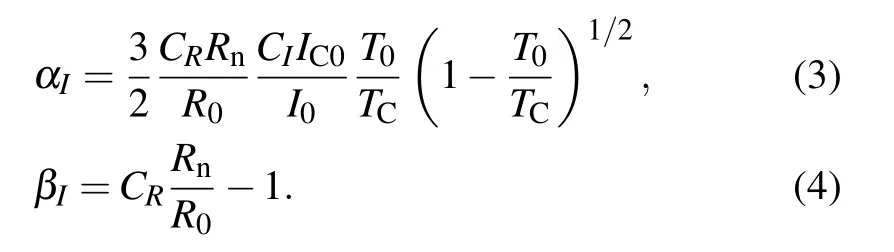
The results of this model agree well with experimental results[13,14]by treating CIand CRas constants across the transition.Here we treat them as variables and fit the data points on the I–V curves to Eq.(2)to obtain these parameters as a function of reduced resistance(R0/Rn)based on the twofluid model.SubsequentlyαIandβIcan be calculated using Eqs.(3)and(4)from CIand CRobtained above.
2.2.Optical TESs and measurement setup
The optical TESs were made of a 30.3-nm-thick Ti film deposited using electron-beam evaporation in high vacuum,[15]and active areas between 5×5µm2and 20×20µm2are patterned by optical lithography using lift-off process.An optical cavity consisting of a dielectric mirror(DM)and antireflection(AR)coatings is integrated with the TESs to improve the absorption efficiency.[16]The TES device is mounted in a dilution refrigerator at a base temperature of 20 mK,and a 110 mΩshunt resistor in parallel with the TES is used to realize the constant voltage bias.The TES current is read out by a superconducting quantum interference device(SQUID)current amplifier with a flux-locked loop.We have tested several Ti TESs with different active areas,Rnand TC,and obtained similar results.Therefore we just compare the calculated parameters with the measured ones for a 20-µm square Ti TES device below.
2.3.CIIC0 and CR

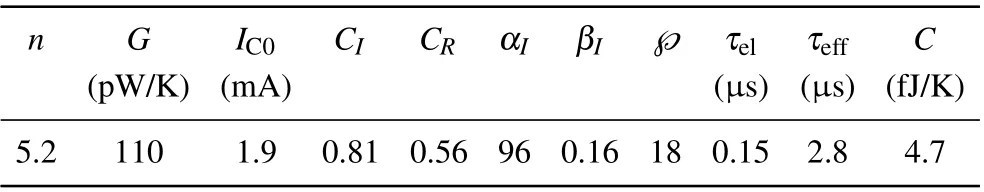
Table 1.Parameters of the 20-µm2 Ti TES at R0=0.48Rn and 100 mK.
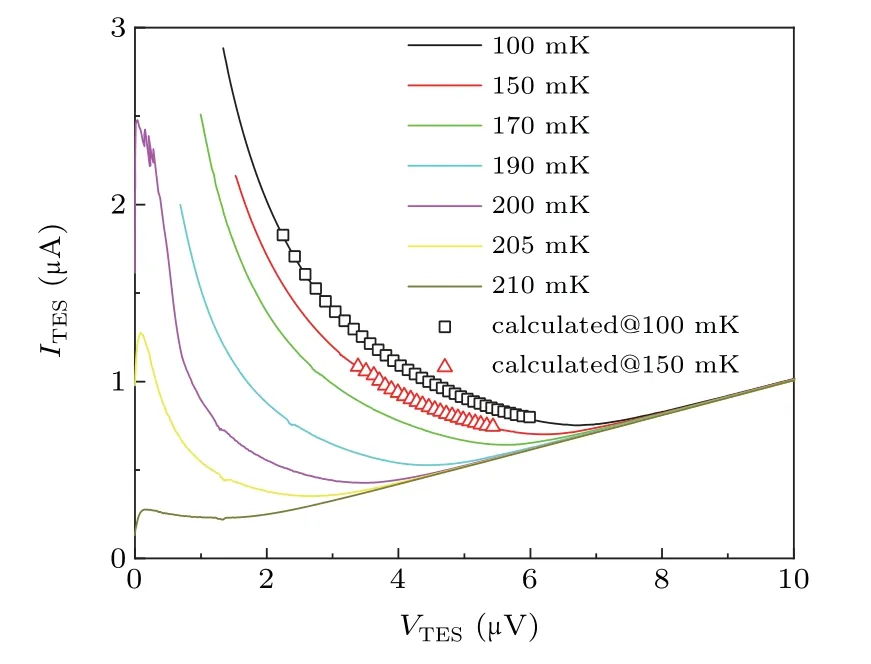
Fig.1.Measured and calculated current–voltage curves of the Ti TES at different bath temperatures.

Fig.2.Extracted CIIC0 and CR of the optical TES as a function of R0/Rn at 100 mK.
Suppose that CIIC0and CRchange with working points(I0,V0,R0),then we can fit the data points on the I–V curve at a bath temperature of 100 mK to obtain CIIC0and CR.As shown in Fig.2,CIIC0decreases with the resistance while CRincreases as expected.
2.4.αI andβI

Fig.3.CalculatedαI andβI as a function of R0/Rn for the Ti TES at 100 mK.
Since CIIC0and CRare known,αIandβIcan be calculated using Eqs.(3)and(4).As shown in Fig.3 the resistance dependence ofαIandβIis similar to that predicted by complex impedance measurements in other experiments.[10,17]
2.5.Thermal capacity
The response of the Ti TES to 1550-nm photons irradiated by an ultra-short pulsed laser source is measured.The output response curves are recorded by a digital oscilloscope(see Fig.4(a)).By fitting the response curve to a double-exponential function,[18]electrical time constant(τel)and effective thermal time constant(τeff)are determined to be 0.15µs and 2.8µs,respectively.τeffis theoretically described as[8]


Fig.4.(a)Measured pulse response of the Ti TES at 0.48 Rn and 100 mK.(b)Obtained heat capacity as a function of R0/Rn for the Ti TES at 100 mK.

3.Discussion
With the extracted parameters,we calculate the I–V curves,α,pulse response height,andΔE,and compare them to the measurement results.As shown in Fig.1,the calculated I–V curves of the TES at 100 mK and 150 mK fit well with the measured data points.The total sensitivityαtotal,obtained through the derivative of the measured I–V curve(i.e.,(dV/dI−R0)/(dV/dI+R0)),is a function ofαIandβI[10]

Figure 5 showsαtotalfrom the measured I–V curve as well as from the extractedαIandβI,which is clearly in good agreement except for a little discrepancy when biasing at lower R.
Another consistency check has been done with respect to the pulse response height.The pulse response can be expressed as[8]
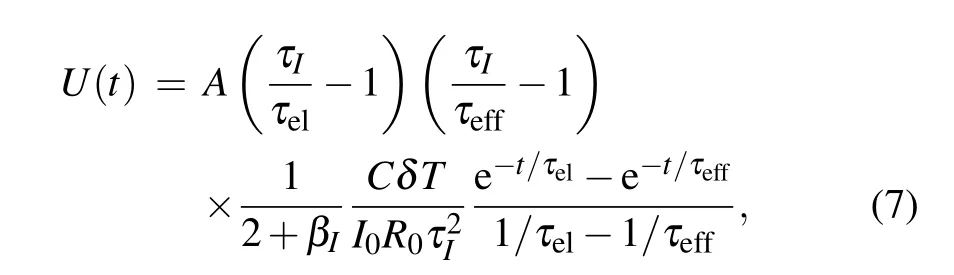
where A is the gain of readout electronics andτI=τ/(1−℘)is the current-biased thermal time constant with the intrinsic time constant(τ=C/G).We calculate the pulse response height in response to a 1550-nm photon(Eγ=CδT=0.8 eV),and plot the calculated height as a function of R0/Rnin Fig.6,where the measured height is also plotted for comparison.The difference between them comes from the energy collection efficiency.
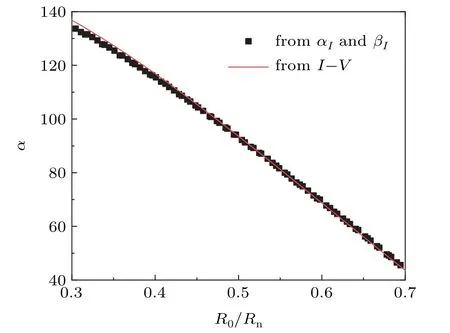
Fig.5.Total sensitivityαtotal from the two-fluid model and calculated from I–V of the TES at 100 mK.
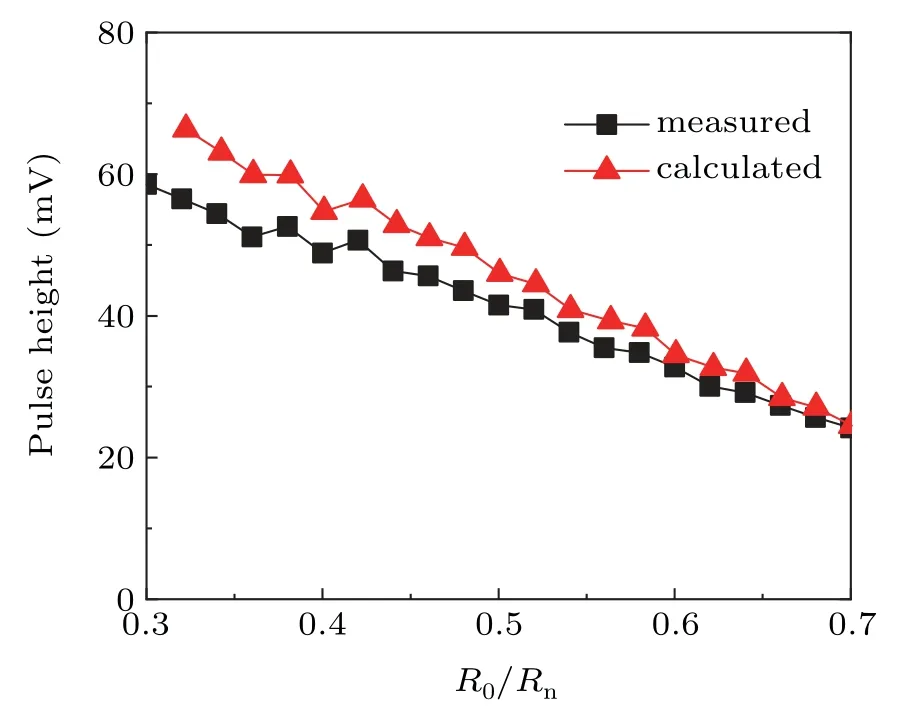
Fig.6.Measured and calculated pulse height of the TES at 100 mK.
Figure 7(a)illustrates the pulse height distribution of the optical TES in response to the 1550-nm pulsed laser source,attenuated to an average ofµin=1.79 photons per pulse.Our optical TES can discriminate each photon state,up to 4 photons per pulse.The coherent laser source has a possibility of producing an n-photon state given by Poisson distribution,while the detected signal satisfies a Gaussian distribution.Therefore,the pulse height distribution can be modeled as a convolution of Poisson distribution with Gaussian distribution[21]
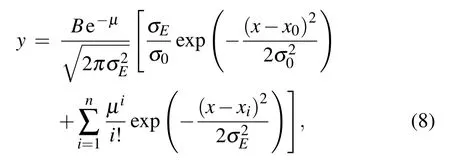
where B is a normalization factor,µis the average number of detected photons per pulse of the incident light,and i is the number of absorbed photons that generate the signal centered on amplitude equal to xi.The same variance(σE)for each peak is assumed except for the first one in which we use an appropriate spread(σ0),corresponding to the case of no-photons detected.ΔE is related toσEby
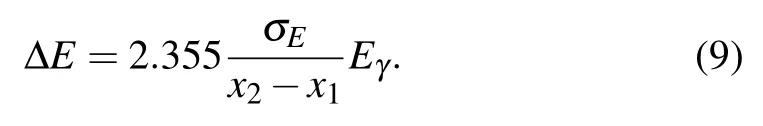
By fitting the measured data to Eq.(8),we obtainµ=1.09.Therefore,the system quantum efficiency isηsys=µ/µin=61%.The measuredΔE is 0.52 eV using Eq.(9).We subsequently measureΔE at other working points.As shown in Fig.7(b),ΔE is relatively flat at a working point below 0.5Rn,and above 0.5RnΔE increases.Theoretical energy resolution(ΔEth)is calculated according to Eq.(1)given the parameters obtained from the two-fluid model.As shown in Fig.7(b),ΔEthis about 0.27 eV at low resistance.There is a significant difference between theoretical and measuredΔE.The current noise of~20 pA/Hz0.5measured in the TES at Rnis much higher than the SQUID’s nominal current noise of~5 pA/Hz0.5,which indicates that some excess noise comes from our refrigerator and electronics.[22]As a result,it gives rise to a higher measured value ofΔE than the theoretical one.To further improveΔE,it is necessary to decrease its C(i.e.,the volume of the active area)or TCby baking the TES.[22]

Fig.7.(a)Pulse height histogram.(b)Measured and calculatedΔE.
4.Conclusion
In this paper,we extracted the key parameters of optical TESs based on the two-fluid model by treating CIand CRas variables in the transition,which gives a similar accuracy to complex impedance measurement.With this method,the calculated I–V curves and pulse responses are consistent with the measured ones.The theoreticalΔE of 0.27 eV is about 52%of the measured one,which can be attributed to the excess readout noise.In order to further improveΔE,we will fabricate optical TESs with smaller active area or depress TCby baking it in air.
Acknowledgment
The authors would like to thank Jin-Feng Wang of Nanjing Institute of Astronomical Optics and Technology and Wei-Dong Shen of Zhejiang University for fabricating the optical cavity of TESs.
猜你喜欢
Chinese Physics B(2023年1期)2023-02-20
共产党员·下(2022年4期)2022-05-17
大观·东京文学(2020年3期)2020-05-25
恋爱婚姻家庭(2019年10期)2019-11-04
歌海(2019年2期)2019-06-11
延河·绿色文学(2019年4期)2019-05-08
延河(下半月)(2019年4期)2019-04-23
恋爱婚姻家庭(2019年28期)2019-01-28
戏剧之家(2017年14期)2017-09-11
- Chinese Physics B的其它文章
- Multiple solutions and hysteresis in the flows driven by surface with antisymmetric velocity profile∗
- Magnetization relaxation of uniaxial anisotropic ferromagnetic particles with linear reaction dynamics driven by DC/AC magnetic field∗
- Influences of spin–orbit interaction on quantum speed limit and entanglement of spin qubits in coupled quantum dots
- Quantum multicast schemes of different quantum states via non-maximally entangled channels with multiparty involvement∗
- Magnetic and electronic properties of two-dimensional metal-organic frameworks TM3(C2NH)12*
- Preparation of a two-state mixture of ultracold fermionic atoms with balanced population subject to the unstable magnetic field∗