非小细胞肺癌中免疫相关基因的预后作用
2021-09-13 02:06:04崔笑廖正凯
中国医药生物技术 2021年4期
崔笑,廖正凯
·论著·
非小细胞肺癌中免疫相关基因的预后作用
崔笑,廖正凯
430071 湖北,武汉大学中南医院肿瘤放化疗科
构建非小细胞肺癌免疫基因预后模型,验证其与预后的相关性。通过 ssGSEA 对 TCGA 数据库中非小细胞肺癌样本进行免疫细胞浸润相关性的分析,将肿瘤样本分为高免疫组和低免疫细胞浸润组,并经过 ESTIMATE 算法、免疫基因相关性分析及 CIBERSORT 算法进一步验证分组效果。使用 R 软件“limma”包筛选高、低免疫组及癌和癌旁各自的差异基因,取交集基因进行功能聚类分析。应用单因素 Cox 回归分析与预后相关的基因,通过 Lasso 回归和多因素 Cox 回归分析构建预后模型,并使用 Kaplan-Meier 验证模型与患者生存的预后相关性。单因素 Cox 分析和多因素 Cox 分析验证了免疫基因预后相关模型为独立预后因素,ROC 分析进一步验证其对生存预测的准确性。根据转录组测序结果将所有样本分为高免疫细胞浸润组和低免疫细胞浸润组,不同组别间 HLA 家族基因和 PD-L1 表达量有显著差异。对筛选出的免疫相关差异基因进行蛋白互作网络分析和细胞功能聚类分析,并构建免疫基因预后模型。Kaplan-Meier 验证了该模型与患者生存具有预后相关性。ROC 曲线验证该模型为预后相关因素。非小细胞肺癌中差异表达基因与免疫相关基因的交集可用于构建免疫预后模型,确认其具有免疫预后功能。
非小细胞肺癌; TCGA 数据库;免疫相关基因;预后模型
肺癌是世界上发病率和死亡率最高的恶性肿瘤,而且具有高度的侵袭性。2018 年全球肺癌的新发确诊病例约 210 万例,而死亡病例约 180 万例,是癌症相关死亡的主要类型[1]。肺癌的病理类型可大致分为非小细胞肺癌(non-small cell lung cancer,NSCLC)和小细胞肺癌(small cell lung cancer,SCLC)。其中,NSCLC 约占原发性肺癌的 80% ~ 85%,且大多数患者在诊断时已发展至中晚期[2]。尽管 NSCLC 的治疗方法正在不断改善,但其预后仍然不容乐观,生存率仍然很低[3]。近年来,大量研究表明,肿瘤细胞的增殖、侵袭、转移、免疫逃逸、肿瘤血管生成等生物学行为均受肿瘤微环境调控。据报道,与 UICC/AJCC TNM 分类等对比,免疫应答相关的指标与预后的相关性更强,是更好的提示预后的指标,也提示了免疫生物学标志物在肺癌预后中的重要意义。基于此,本项研究深入探讨了肿瘤组织及癌旁组织中的免疫应答基因和相应的临床预后因素等相关内容,为肿瘤免疫标志物的临床应用和免疫治疗提供了理论依据。
肿瘤微环境中免疫细胞浸润会影响癌症免疫治疗的预后和结果[4-7]。肺癌微环境中的免疫细胞主要由 T 细胞、巨噬细胞、肥大细胞、少量浆细胞、NK 细胞和髓样来源的细胞组成[8-11]。荟萃分析表明肿瘤浸润淋巴细胞(TIL)在癌症中的预后特征是 CD3+和 CD8+TILs 与较好的预后相关。最近更多的研究表明,通过细胞毒性 T 细胞(CD8 T),记忆 T 细胞(CD45RO+)和 T 辅助细胞等积极因素,更强的 TIL 浸润可以改善总生存期[12]。其中,TIL 是重要的免疫微环境的组成成分,有望成为治疗效果的预后指标和预测性生物指标。
本研究中,将 TCGA(https://portal.gdc.cancer. gov)数据库中的肺癌病例分为高和低免疫细胞浸润组(简称高免疫组和低免疫组),然后对其评分并比较各组之间的差异。人白细胞抗原(HLA)家族基因和程序性死亡配体 1(PD-L1),在癌症组织中显示出差异。通过筛选与预后相关的免疫基因构建免疫预后模型,并使用多种方法进一步验证该模型的预后作用。
1 材料与方法
1.1 数据收集与整理
从 TCGA 数据库中获得肺癌患者临床病例数据和 HTSeq-FPKM 数据。通过 R 软件分析肺癌的免疫细胞浸润和免疫相关基因等数据,构建免疫相关基因的预后模型,并进一步验证该模型的有效性。本研究收集了535 份肺腺癌(LUAD)肿瘤组织和 59 份癌周正常组织样本,502 例肺鳞状细胞癌(LUSC)组织和49 例癌周正常组织样本。通过“GSVA”软件包对每例样本 FPKM 数据进行分析和评分,根据单样本基因富集分析(ssGSEA)结果,使用“hclust”包对结果处理并将肿瘤样本分为高免疫组和低免疫组[13]。患者的总生存天数应≥ 30 d,以进行与预后相关的进一步分析。
1.2 免疫指标评分与分组验证
基于 FPKM 转录组表达数据,使用 R 软件中的 ESTIMATE 算法,以肿瘤组织中的免疫细胞和基质细胞为基础计算每个样本的基质、免疫、ESTIMATE 评分和肿瘤纯度评分,以验证 ssGSEA 分组的准确性。同时分析各组免疫相关基因如HLA家族基因和PD-L1的基因表达水平,以再次验证分组结果。
1.3 筛选差异表达基因
根据每个样本转录组测序结果使用维恩分析筛选出差异表达基因(DEGs),并通过 R 软件“limma”包[14]进行高免疫组和低免疫组的比较。|logFC| > 0.5 且错误发现率(FDR)< 0.05 具有统计学意义。
1.4 GO 富集分析
通过 ImmPort 数据库(https://www.immport. org/home)获得免疫相关基因(IRG)。使用多个软件包(Bioconductor 的“colorspace”“stringi”“ggplot2”“DOSE”“clusterprofiler”“enrichplot”)对免疫相关基因进行功能富集分析,以根据 GO 类别对基因进行解释生物过程,分子功能和细胞成分等功能。蛋白质-蛋白质相互作用(PPI)网络由 STRING 网站(https://string-db.org/)和 Cytoscape 软件[15]建立。其中,使用 Metascape(http:// metascape.org)[16]进行 PPI 分析,应用分子复合物检测(MCODE)算法来识别蛋白质在 PPI 网络中紧密连接的邻域相关蛋白。
1.5 筛选预后标记的免疫相关基因
1.6 生存分析
根据预后模型中免疫相关基因的表达水平计算每个样品的风险评分,并通过中位风险评分将所有样品分为高风险组和低风险组。使用 Kaplan-Meier 生存分析评估不同组患者的OS。通过 R 软件“survminer”包选择最佳的 cut-off 值,进行 Kaplan-Meier 生存分析以比较高风险评分和低风险评分组别间的总生存期差异。
2 结果
2.1 免疫相关群体的构建和确证
从 TCGA 数据库中获得了肿瘤组织和癌旁组织的免疫相关数据。根据免疫细胞和基质细胞的表达水平,将所有 LUAD 和 LUSC 样本分为高免疫组和低免疫组。ESTIMATE(使用表达数据估计恶性肿瘤组织中的基质细胞和免疫细胞)算法验证了上述分组结果的可靠性。正如预期的那样,低免疫细胞组的肿瘤纯度更高,而高免疫组的 ESTIMATE 得分、免疫得分和基质分数更高,箱形图显示了两个免疫相关组之间得分的显著差异(图 1)(< 0.001)。
2.2 免疫相关基因与免疫细胞之间的差异分析
为验证上述分组的准确性,对高免疫组和低免疫组的HLA家族基因和 PD-L1 的表达水平进行进一步验证。发现与低免疫浸润组相比,高免疫浸润组的HLA家族基因(图 2A)和 PD-L1(图 2B)的表达水平明显更高(均< 0.001)。此外,不同组别中 TIICs 亚型的富集水平也不同(图 2C,< 0.05)。
2.3 筛选DEG 和功能特征分析
分析 LUAD 的 535 个样本和癌旁 59 个样本,以及 LUSC 502 个样本和癌旁 49 个样本之间的差异表达基因(|log2FC| > 2 且FDR < 0.05),发现分别有2748 和 3633 个基因存在差异表达。比较高免疫组和低免疫组后,分别在 LUAD 和 LUSC 中筛选出 3952 和 1808 个差异表达的免疫相关基因。根据以上结果,借助双向 Venn 分析,重叠部分包括LUAD 中 749 个(12.6%)基因和LUSC 中 578 个(11.9%)基因(图 3A)。在 LUAD 中,GO 分析显示差异基因主要与吞噬作用、体液免疫反应、蛋白激活级联、补体激活、基于免疫球蛋白家族结构域构建的免疫受体重组的适应性免疫反应、淋巴细胞介导的免疫、免疫球蛋白复合物和抗原结合有关(图 3B)。LUSC 中最重要的功能包括白细胞迁移、免疫反应等的中性粒细胞激活、细胞外基质调节等(图 3C)。LUAD 中上调基因包括 CCL25、CCL23、SAA1、FPR2、EDN2,下调基因包括 MMP7、MMP3、MMP1、CCL7。LUSC 中,上调基因包括 PPBP、CXCR1、CXCL2、FPR2、FPR1、S1PR1、AGTR2、P2RY14、S1PR4、C5AR1、CCL25、CCL23,下调基因包括 CYP27B1、CYP27A1、CYP4B1、CYP2B6、CYP2W1。此外,通过 Metascape 和 Cytoscape 软件分析 DEG,建立PPI 网络(图3D,E)。
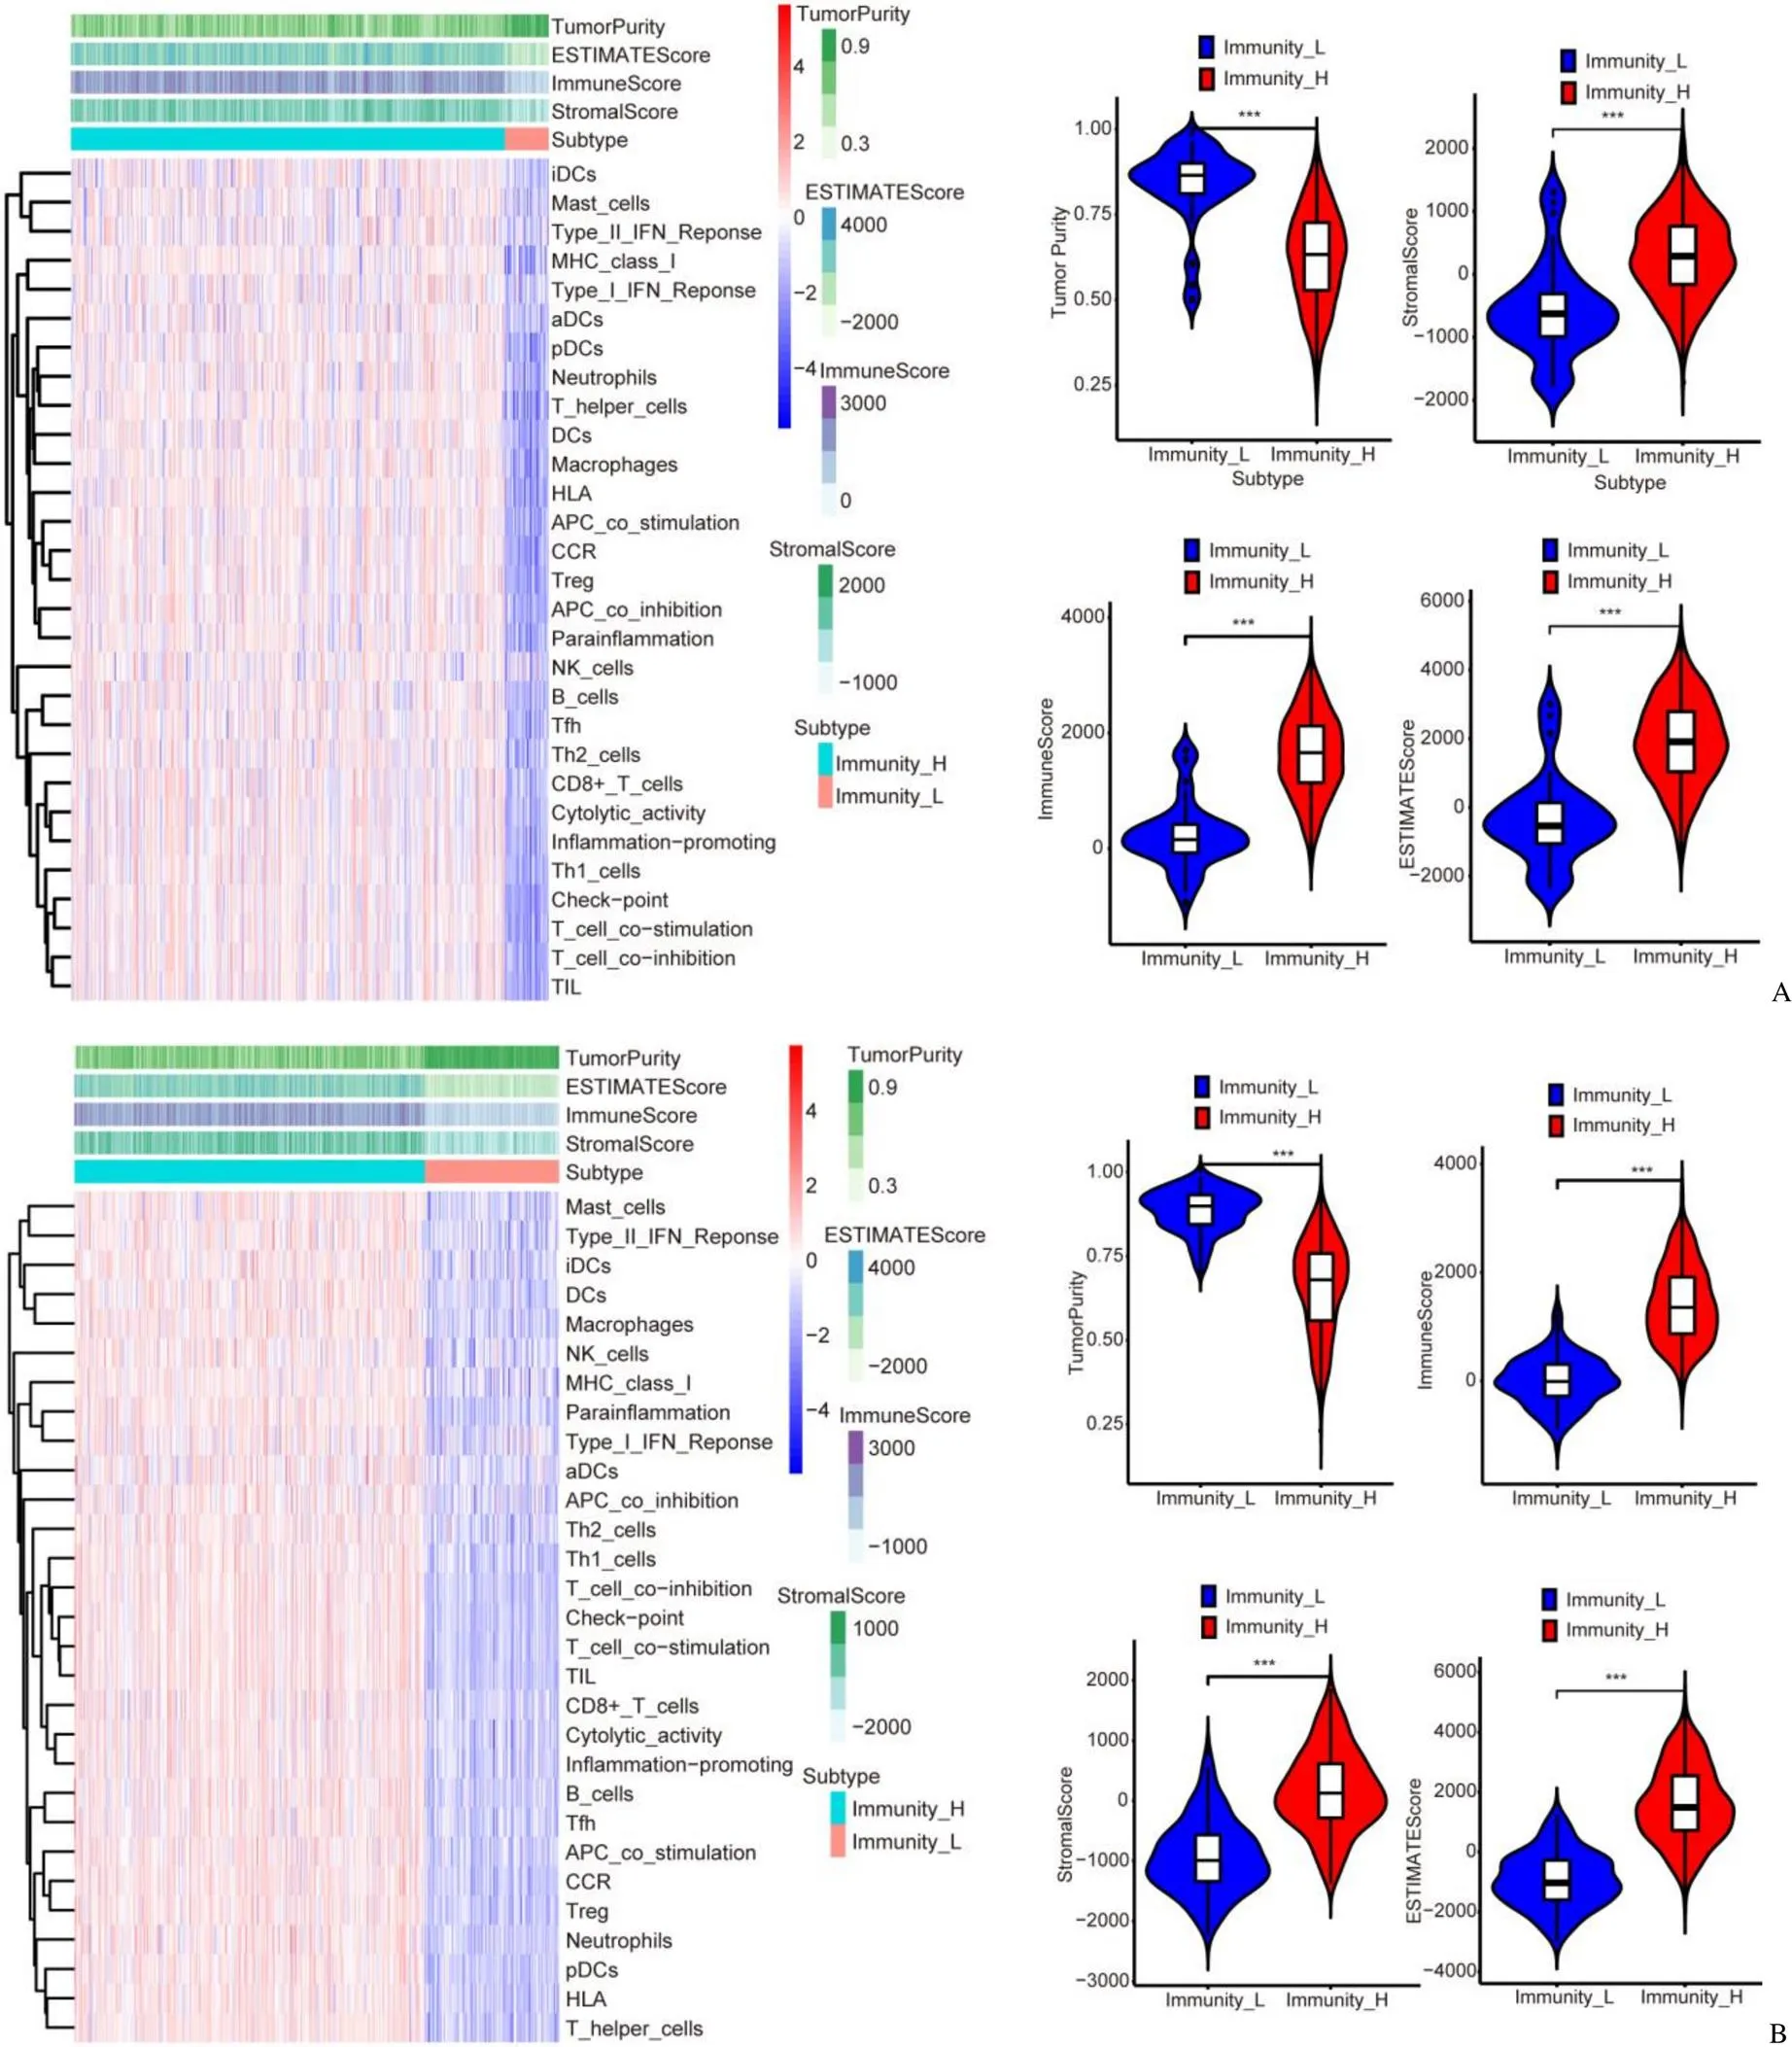
图1 根据免疫细胞和基质细胞的表达水平对 LUAD(A)和 LUSC(B)免疫细胞浸润分组并验证(低免疫组的肿瘤纯度更高,而高免疫组的免疫评分、基质评分和 ESTIMATE 评分更高,***P < 0.001)
Figure 1 According to the expression levels of immune cells and stromal cells, LUAD (A) and LUSC (B) samples divided into a high immune cell infiltration group and a low immune cell infiltration group (Tumor purity of the low-immune group was higher, while the immune score, stromal score and ESTIMATE score of the high-immune group were higher,***< 0.001)
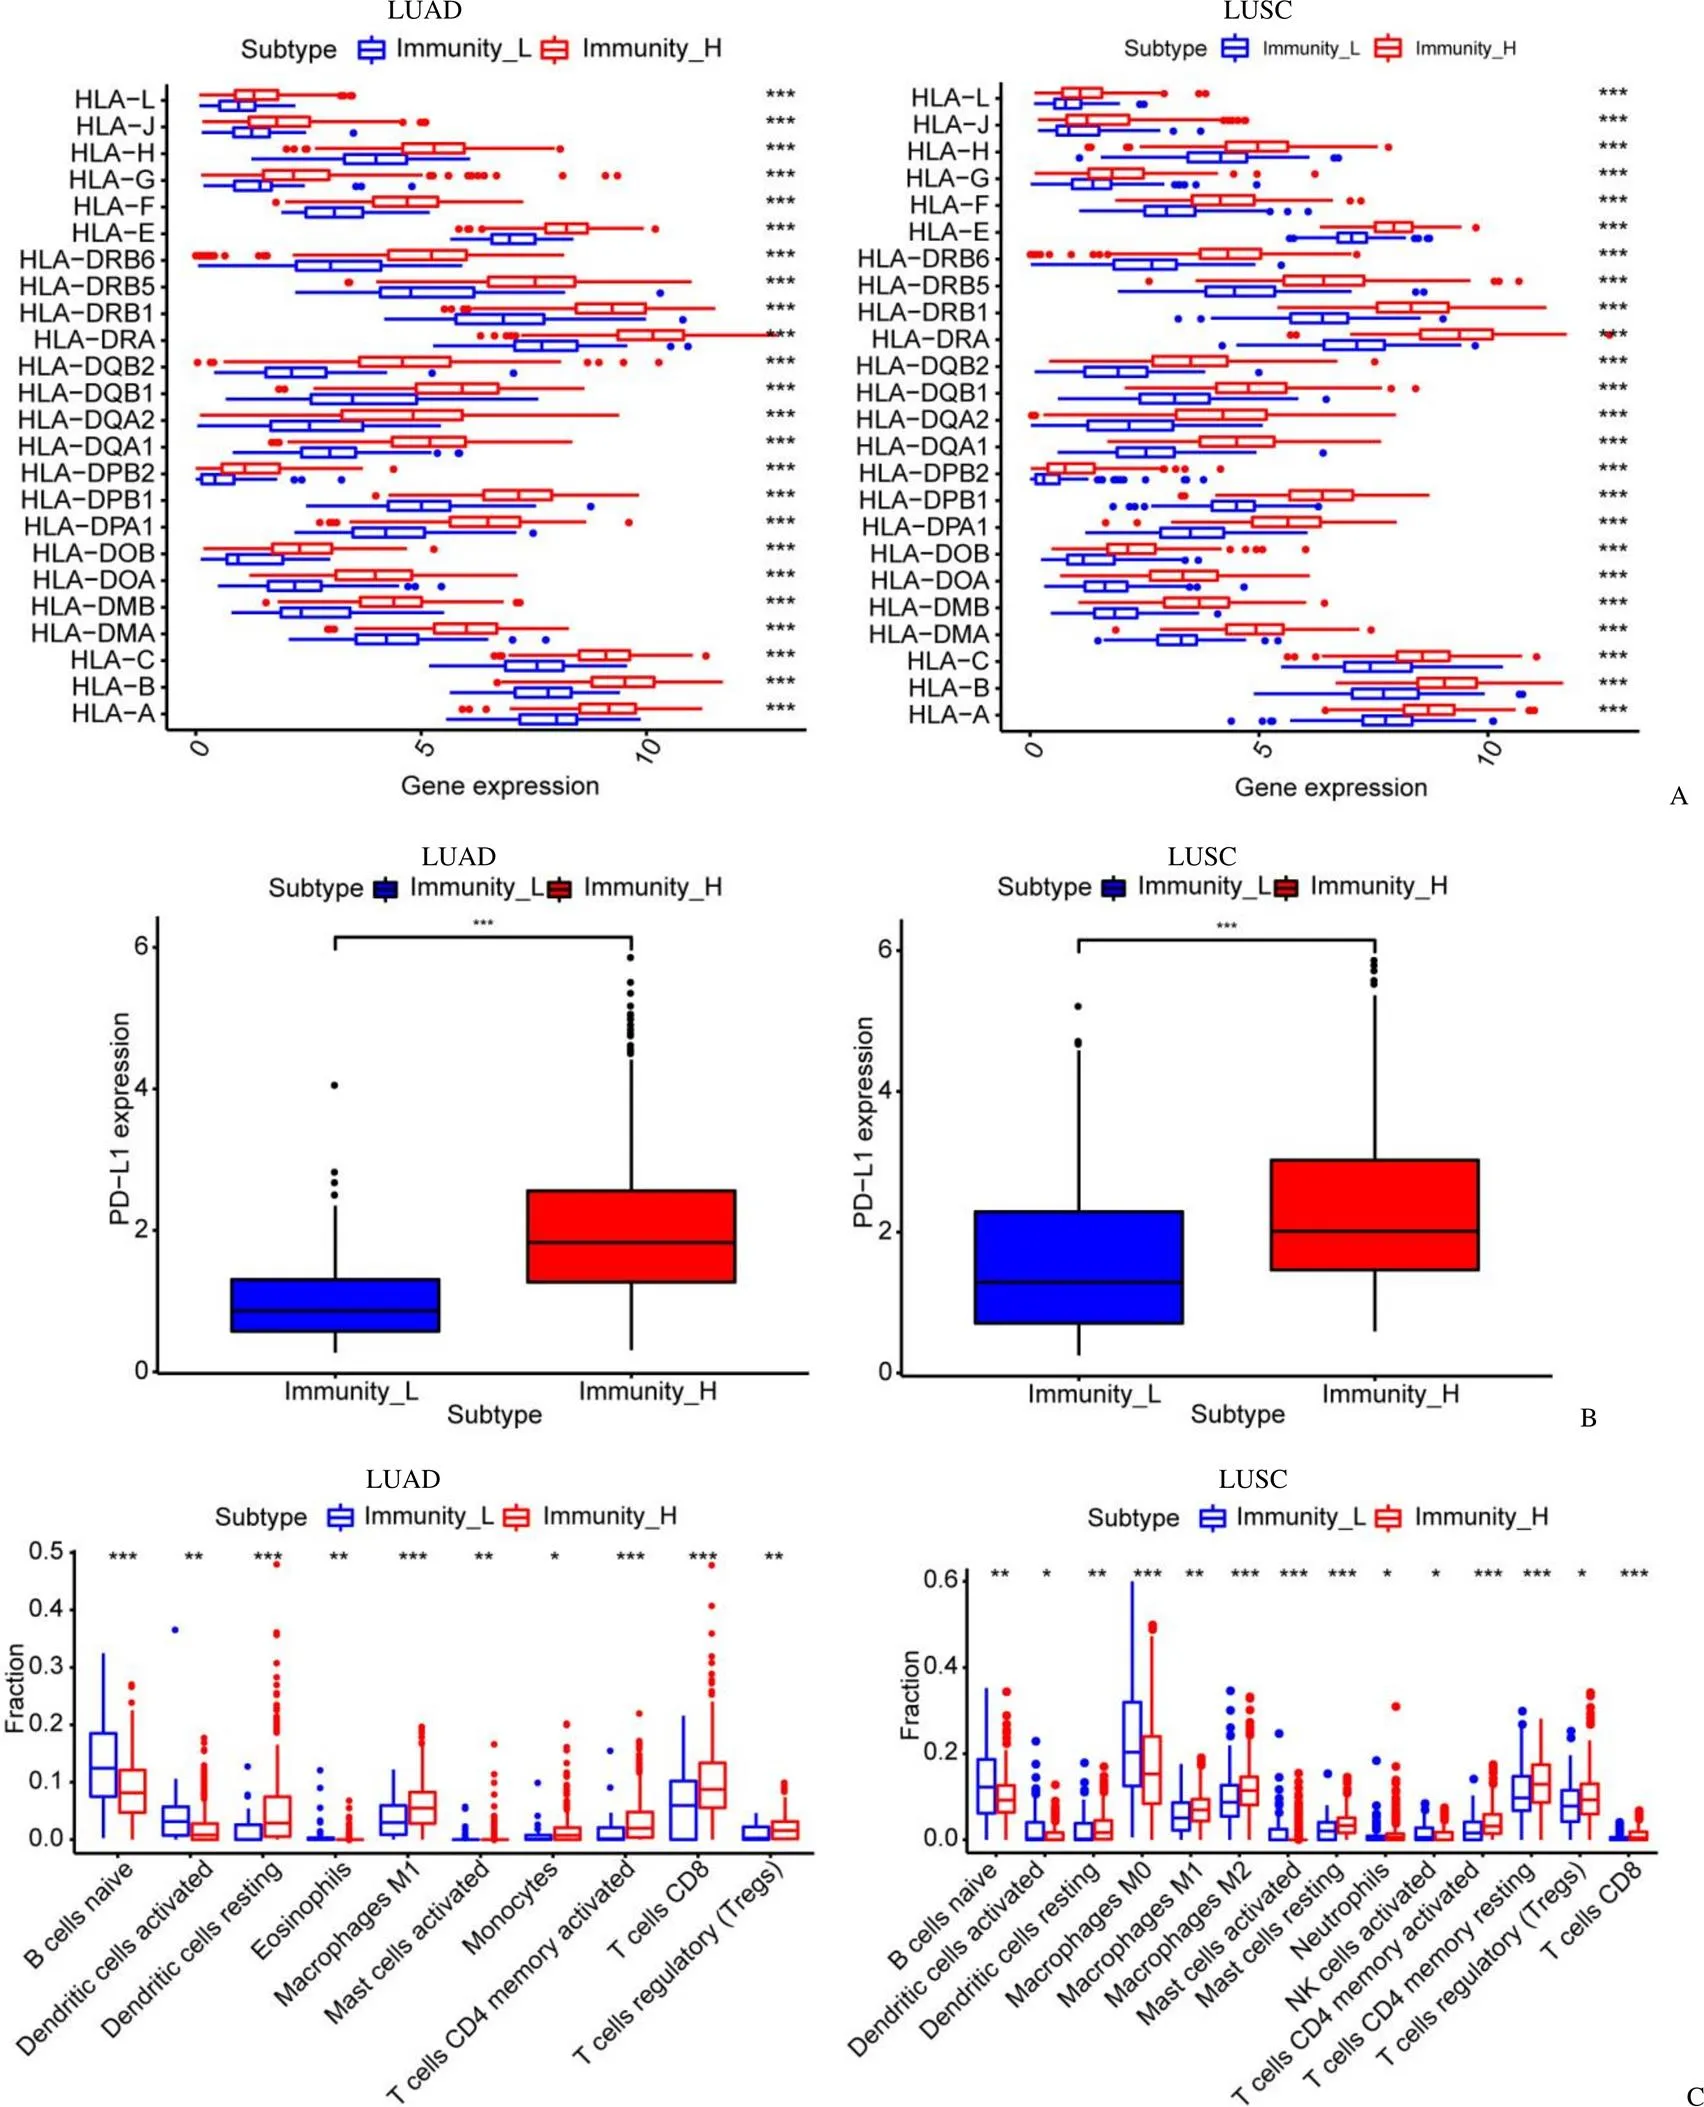
图2 HLA 家族基因和PD-L1 在免疫细胞中具有显著差异[在高免疫细胞浸润组(红色)中,HLA 家族基因和PD-L1 的表达在CIBERSORT 图(A)和箱图(B)中均较高;高免疫细胞浸润组(红色)和低免疫细胞浸润组(蓝色)之间各类免疫细胞的比例不同(C)]
Figure 2 HLA family genes and PD-L1 shows a significant difference in immune cells [The expression of HLA family genes and PD-L1 in high immune cell infiltration group (red) were all accordingly higher, both in CIBERSORT chart (A) and box-plot (B); It also meaningfully showed the different proportion of each immune cell between the high immune cell infiltration group (red) and the low immune cell infiltration group (blue) (C)]
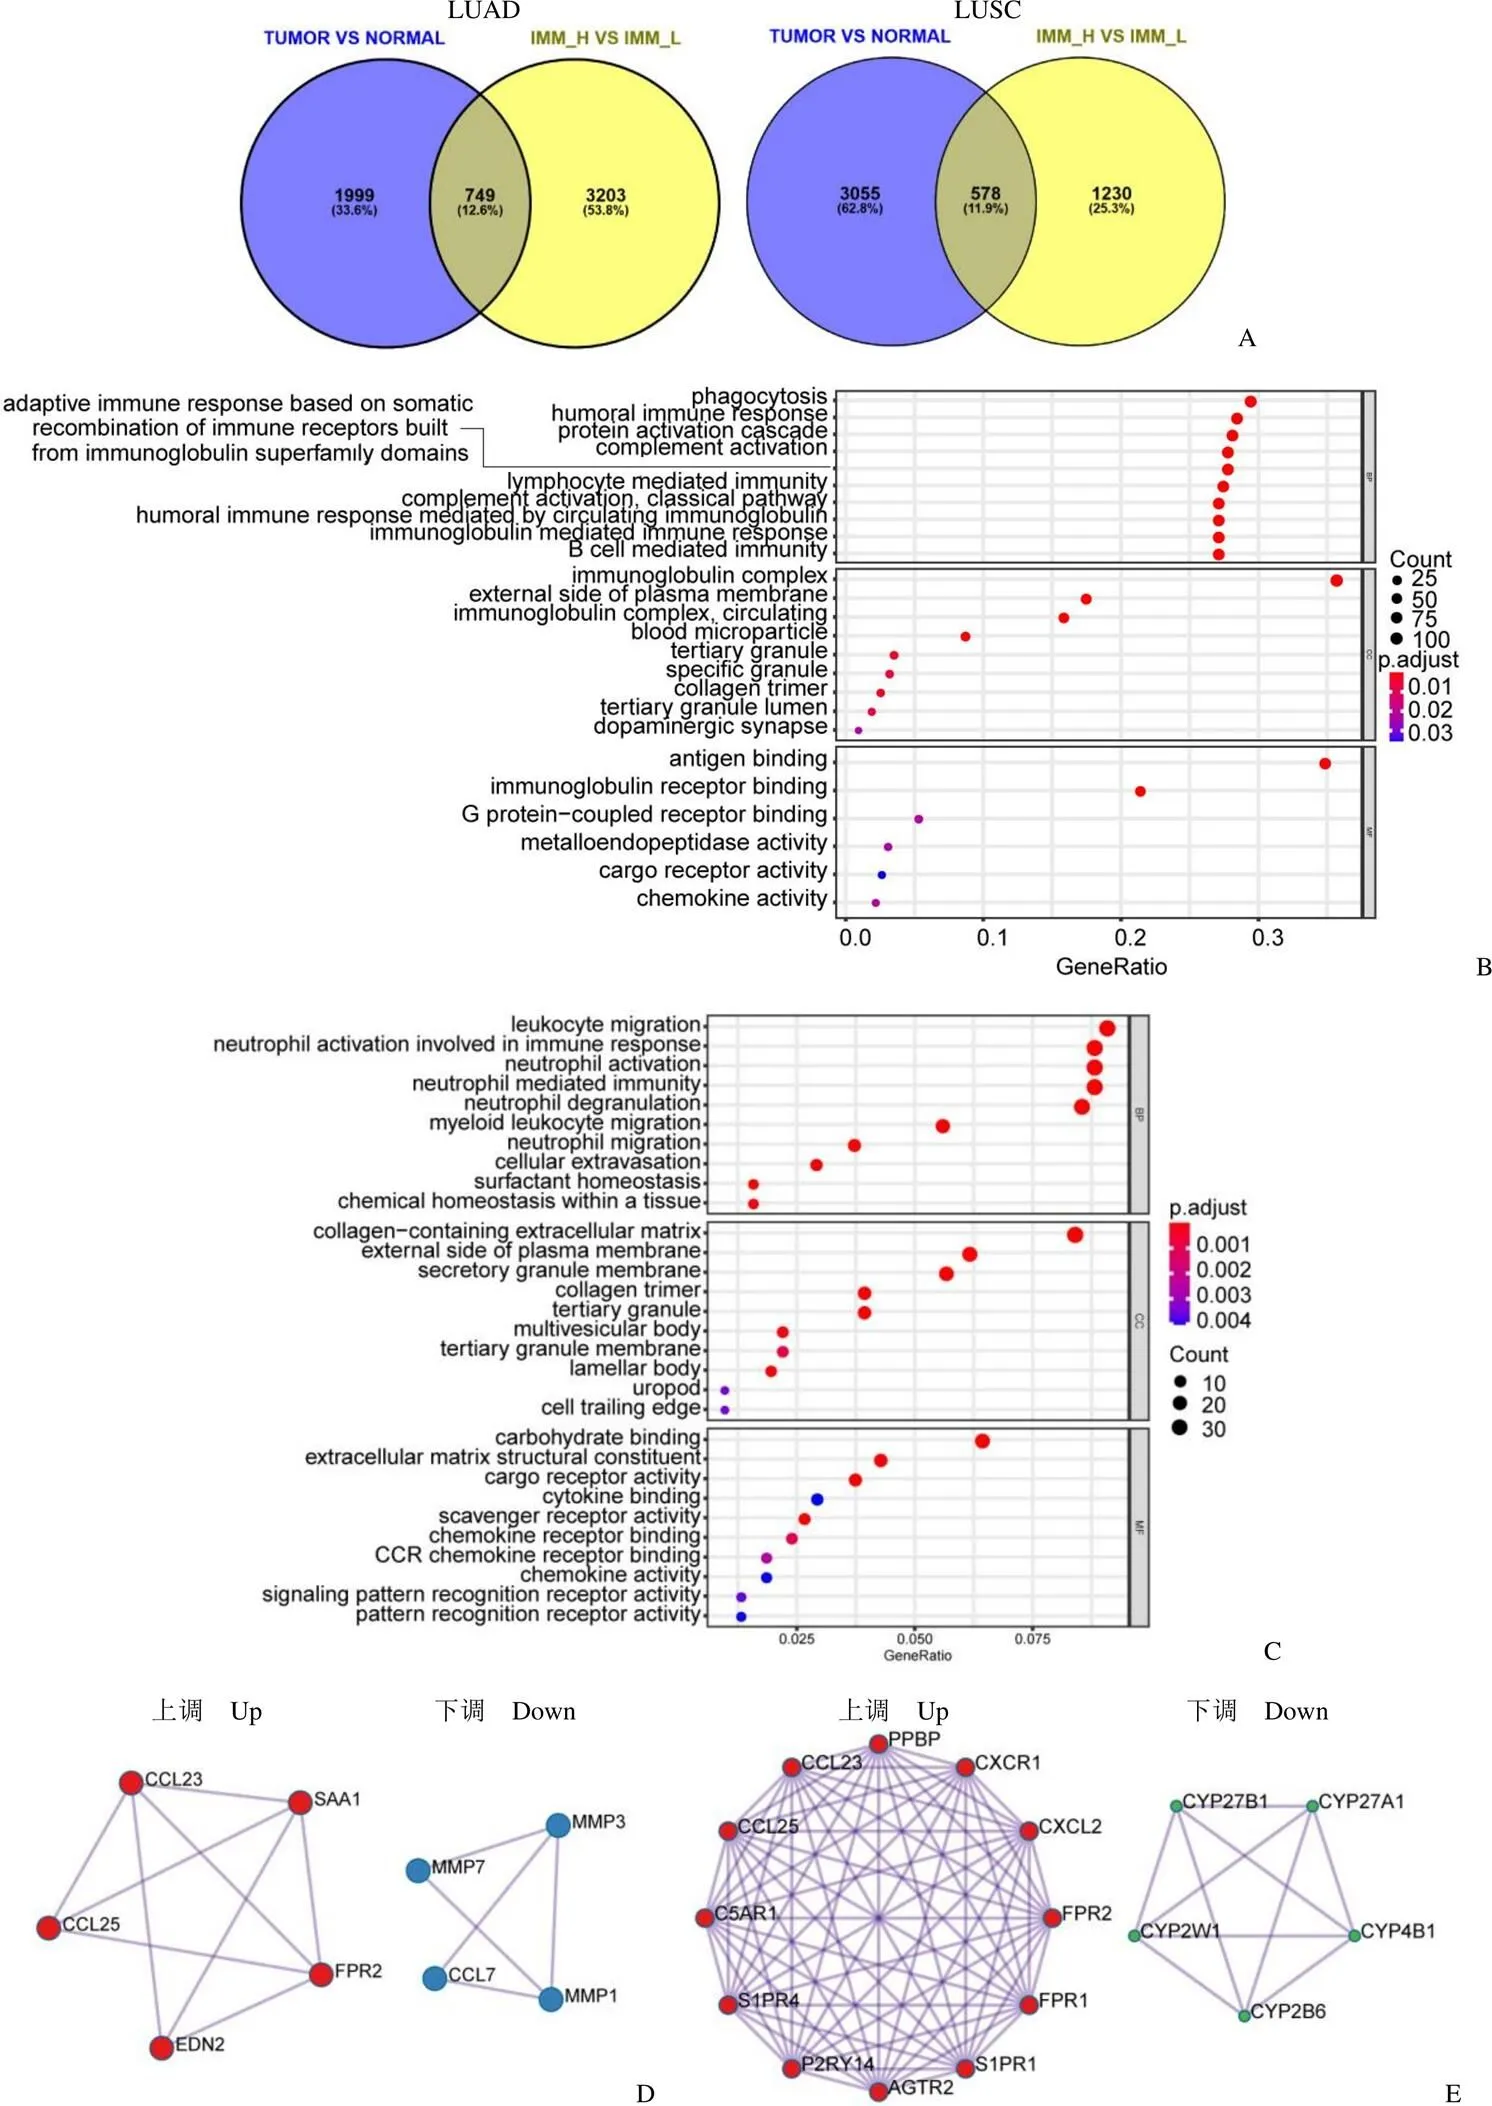
图3 差异基因和功能聚类分析(A:通过双向 Venn 分析筛选出差异表达基因;B:GO 数据库分析 LUAD 中差异基因功能;C:GO 数据库分析 LUSC 中差异基因功能;D:LUAD 核心基因PPI 网络分析;E:LUSC 核心基因PPI 网络分析)
Figure 3 Identification of the DEGs and functional analysis (A: Differentially expressed genes were determined in the tumor group in LUAD and LUSC; B: GO analyses of the DEGs of LUAD; C: GO analyses of the DEGs of LUSC; D: Protein-protein interaction network of LUAD; E: Protein-protein interaction network ofLUSC)
2.4 筛选预后相关免疫基因并构建预后模型
根据以上所有研究结果和数据,在 LUAD 中,通过单变量 Cox 回归分析从所有 749 个 DEG 中选择了 18 个(< 0.01),并通过 Lasso Cox 回归分析选取了 17 个基因。最后,经过多变量 Cox 回归分析后,使用 9 个关键基因(MYBPC1、AC005291.2、KRT6A、AL606489.1、SFTPA2、SPN、NT5E、INSL4 和 RAB3B)构建了预后模型。在 LUSC 中,通过单变量 Cox 回归分析从 578 个 DEG 中筛选出 19 个 DEG(< 0.01),通过 Lasso Cox 回归分析筛选出 11 个基因,最后6 个关键基因为MMP12、TUBA3E、PTGIS、PLA2G1B、SLC16A4 和 ODAPH 构建预后模型(图 4A)。以上均通过 10 轮交叉验证(图 4B)。根据这些基因的表达水平计算每个样本的风险评分,并通过中位风险评分将所有样品分为高风险组和低风险组。使用 Kaplan-Meier 生存分析评估不同组患者的OS。低风险组(蓝色)患者的OS高于高风险组(红色),表明筛选出的关键基因具有预后功能(< 0.001)(图 4C)。
Figure 4 Analysis of the correlation between survival and prognosis in lung cancer [A: The Lasso Coxshows 17 genes of LUAD and 11 genes of LUSC genes most correlated with prognostics; B: The optimal values of the penalty parameter were determined by 10-round cross-validation; C: In survival probability observation high-risk group (red) got a much worse overall survival (OS) than the low-risk group (blue)]
2.5 免疫细胞浸润相关的预后模型构建及评估
LUAD 和 LUSC 患者的风险评分分布(图5A,B)及相应的生存状态(图5C,D),提示高风险组患者的总生存期更短。图 5E 和图 5F 分别展示了 LUAD 和 LUSC 中不同风险分组的各个预后模型基因的表达热图。
单因素和多因素 Cox 回归分析用于验证上述免疫基因构建的预后模型是肺癌的独立预后因素,而与年龄、性别、临床分期和病理分级等临床特征无关。无论是在 LUAD 中还是在 LUSC 中,在高表达和低表达组中,根据风险评分免疫基因预后相关模型都是肺癌患者的独立预后因素。在单变量 Cox 回归分析中,风险评分和 95%CI 的风险比(HR)分别为 1.235 和 1.090 ~ 1.400(< 0.001),在多变量 Cox 回归分析中,风险得分和 95%CI 的风险比(< 0.05)为 1.204 和 1.048 ~ 1.384(图 6A,C)。在 LUSC 中,风险变量和 95%CI 的危险比(HR)在单变量 Cox 回归分析中(< 0.001)为 1.022 和 1.013 ~ 1.031,在多变量 Cox 回归分析中(< 0.001)为 1.019 和 1.009 ~ 1.029(图 6B,D)。为了验证敏感性和特异性,进行了时间依赖性受体工作特征(ROC)分析,并且风险评分的 ROC 曲线下面积()分别为 0.75 和 0.629(图 6E,F),提示预后特征是高度可靠的。
Figure 5 Analysis of risk score in lung cancer [Synthesize the information of each sample of observer, perform their risk scores, and make a risk score chart (A, B); The scatter plot of the sample survival overview of both LUAD (C) and LUSC (D); The green and red dots represent survival and death, respectively. With view of the Heatmap, the gene expression levels of the high- and low-risk groups are divided into 14 levels. The high- and low-risk groups can be distinguished by the color bar at the top, pink or blue. The gene expression levels can be observed through the example from green to red on the right (E, F)]
Figure 6 Analysis of the heterogeneity of the characteristics of different cases in lung cancer [The univariate (A, B) and multivariate (C, D) Cox regression evaluated the independent prognostic of the risk score value except for age, gender, stage, and TNM stage. Calculate thefor the above items of the total survival risk score according to the ROC curve (E, F)]
3 讨论
NSCLC 是全球最具侵略性的癌症之一,具有高发病率和致死率。近年来,包括化学疗法、放射疗法、靶向疗法和免疫疗法在内的治疗方法的创新并未从根本上改善 NSCLC 的疗效,预后仍然很差。面对这种情况,个体化治疗的概念变得越来越重要,选出特定的生物学特性或生物标记物迫在眉睫。因此,我们使用 TCGA 进行了生物信息学分析,筛选可以预测 NSCLC 患者预后的免疫相关基因。
研究表明,癌症的恶性取决于肿瘤细胞的固有特征以及肿瘤微环境中的成分,包括免疫细胞、间充质细胞、内皮细胞、炎性介质和细胞外基质分子。肿瘤浸润免疫细胞和基质细胞是非肿瘤细胞的两种主要类型,已被证明是诊断和预后评估的关键因素[4, 18-21]。TILs 在多种癌症中表现良好,尤其是细胞毒性 T 细胞、记忆 T 细胞和 T 辅助 1 细胞与多种癌症的临床预后呈正相关,包括黑色素瘤、头颈癌、乳腺癌、膀胱癌、尿路上皮癌、卵巢癌、结直肠癌、肾癌、前列腺癌和肺癌[5-7]。TILs的类型和密度已成为大肠癌和肺癌临床分期和预后的重要生物标志物[12-13]。因此,肿瘤浸润免疫细胞(TIIC)和基质细胞在诊断、预后预测以及个体治疗策略中都至关重要。每种 TIIC 都有特定的功能,具体取决于细胞中成千上万基因的表达,为此,TIIC 中的基因表达为进一步研究提供了更准确的基础。在本研究中,通过使用转录组测序数据,特别是关于基因的转录组测序数据以及从 TCGA 获得的 NSCLC 的临床病理特征,我们分别筛选和验证了与 LUAD 和 LUSC 免疫细胞浸润相关的预后标志基因。
基于肺癌的 TCGA 数据集,我们首先构建并验证了按免疫细胞或基质细胞浸润程度分类的两个免疫相关组,并通过 HLA 和 PD-L1 的表达验证了 NSCLC 中免疫微环境的异质性,比较两组中 HLA 家族基因和 PD-L1 的不同表达,验证了两个免疫相关组的可靠性。我们在 TCGA 数据集中获得并筛选了具有预后价值的 DEG,然后进行功能分析,并为这些基因构建了 PPI 网络。根据免疫相关的差异基因应用单因素和多因素 Cox 回归分析等方法构建预后分析模型,并使用 Kaplan-Meier 等多种方法验证预后模型是肺癌的独立且稳定的预后指标。LUAD 中的 9 个基因和 LUSC 中的6 个基因作为肺癌的预后标志物,它们在肿瘤免疫应答中具有特定作用,例如 NT5E 下调了体内和体外胶质母细胞瘤的生长,并作为分子诊断和预后的血清学指标临床上结肠癌的发生具有相关性[22]。SPN 的过表达会引起抑癌蛋白 p53 和 ARF 的激活,它也是肺癌的潜在治疗靶点[23]。同样,我们确定包括 MMP12 和 SLC16A4 在内的 6 个基因作为 LUSC 的预后标志。MMP12 促进肿瘤在肺组织中的增殖[24],MMP12 的高表达与胃癌有关,而SLC16A4 是胰腺癌细胞代谢和存活的关键调节剂,与侵袭性肿瘤生物学特征有关,并预示着尿路上皮癌不良预后[25]。
简而言之,我们首先在 LUAD 和 LUSC 中筛选了与免疫浸润密切相关的差异表达基因,然后使用这些差异基因构建并验证了与肿瘤微环境相关的免疫预后模型,可作为肺癌的潜在免疫预测因子。该研究还需要进一步的前瞻性研究来支持结果并优化我们的预后模型。总之,本研究为肺癌的预后提供了一系列新的免疫相关生物标志物,以补充传统的临床预后因素并改善治疗效果。
[1] Bray F, Ferlay J, Soerjomataram I, et al. Global cancer statistics 2018: GLOBOCAN estimates of incidence and mortality worldwide for 36 cancers in 185 countries. CA Cancer J Clin, 2018, 68(6):394-424.
[2] Siegel RL, Miller KD, Jemal A. Cancer statistics, 2019. CA Cancer J Clin, 2019, 69(1):7-34.
[3] Herbst RS, Morgensztern D, Boshoff C. The biology and management of non-small cell lung cancer. Nature, 2018, 553(7689):446-454.
[4] Becht E, Giraldo NA, Germain C, et al. Immune contexture, immunoscore, and malignant cell molecular subgroups for prognostic and theranostic classifications of cancers. Adv Immunol, 2016, 130: 95-190.
[5] Petitprez F, Vano YA, Becht E, et al. Transcriptomic analysis of the tumor microenvironment to guide prognosis and immunotherapies. Cancer Immunol Immunother, 2018, 67(6):981-988.
[6] Fridman WH, Zitvogel L, Sautès-Fridman C, et al. The immune contexture in cancer prognosis and treatment. Nat Rev Clin Oncol, 2017, 14(12):717-734.
[7] Ladányi A. Prognostic and predictive significance of immune cells infiltrating cutaneous melanoma. Pigment Cell Melanoma Res, 2015, 28(5):490-500.
[8] Bremnes RM, Al-Shibli K, Donnem T, et al. The role of tumor-infiltrating immune cells and chronic inflammation at the tumor site on cancer development, progression, and prognosis: emphasis on non-small cell lung cancer. J Thorac Oncol, 2011, 6(4):824-833.
[9] Ishibashi Y, Tanaka S, Tajima K, et al. Expression of foxp3 in non-small cell lung cancer patients is significantly higher in tumor tissues than in normal tissues, especially in tumors smaller than 30 mm. Oncol Rep, 2006, 15(5):1315-1319.
[10] Kataki A, Scheid P, Piet M, et al. Tumor infiltrating lymphocytes and macrophages have a potential dual role in lung cancer by supporting both host-defense and tumor progression. J Lab Clin Med, 2002, 140(5):320-328.
[11] Salgaller ML. The development of immunotherapies for non-small cell lung cancer. Expert Opin Biol Ther, 2002, 2(3):265-278.
[12] Fridman WH, Pagès F, Sautès-Fridman C, et al. The immune contexture in human tumours: impact on clinical outcome.Nat Rev Cancer, 2012, 12(4):298-306.
[13] Newman AM, Liu CL, Green MR, et al. Robust enumeration of cell subsets from tissue expression profiles. Nat Methods, 2015, 12(5): 453-457.
[14] Ritchie ME, Phipson B, Wu D, et al. Limma powers differential expression analyses for RNA-sequencing and microarray studies. Nucleic Acids Res, 2015, 43(7):e47.
[15] Shannon P, Markiel A, Ozier O, et al. Cytoscape: a software environment for integrated models of biomolecular interaction networks. Genome Res, 2003, 13(11):2498-2504.
[16] Zhou Y, Zhou B, Pache L, et al. Metascape provides a biologist-oriented resource for the analysis of systems-level datasets. Nat Commun, 2019, 10(1):1523.
[17] Zhang M, Wang X, Chen X, et al. Novel immune-related gene signature for risk stratification and prognosis of survival in lower-grade glioma. Front Genet, 2020, 11:363.
[18] Keung EZ, Gershenwald JE. Clinicopathological features, staging, and current approaches to treatment in high-risk resectable melanoma.J Natl Cancer Inst, 2020, 112(9):875-885.
[19] Galon J, Pagès F, Marincola FM, et al. The immune score as a new possible approach for the classification of cancer. J Transl Med, 2012, 10:1.
[20] Galon J, Lugli A, Bifulco C, et al. World-wide immunoscore task force: meeting report from the "melanoma bridge", Napoli, November 30th-December 3rd, 2016. J Transl Med, 2017, 15(1):212.
[21] Ros-Martínez S, Navas-Carrillo D, Alonso-Romero JL, et al. Immunoscore: a novel prognostic tool. Association with clinical outcome, response to treatment and survival in several malignancies. Crit Rev Clin Lab Sci, 2020, 57(7):432-443.
[22] Kordaß T, Osen W, Eichmüller SB. Controlling the immune suppressor: transcription factors and microRNAs regulating CD73/NT5E. Front Immunol, 2018, 9:813.
[23] Manne U, Gary BD, Oelschlager DK, et al. Altered subcellular localization of suppressin, a novel inhibitor of cell-cycle entry, is an independent prognostic factor in colorectal adenocarcinomas. Clin Cancer Res, 2001, 7(11):3495-3503.
[24] Roman J. On the "TRAIL" of a killer: MMP12 in lung cancer. Am J Respir Crit Care Med, 2017, 196(3):262-264.
[25] McDonald PC, Chafe SC, Brown WS, et al. Regulation of pH by carbonic anhydrase 9 mediates survival of pancreatic cancer cells with activated KRAS in response to hypoxia. Gastroenterology, 2019, 157(3):823-837.
Prognostic role of immune related genes in non-small cell lung cancer
CUI Xiao, LIAO Zheng-kai
Author Affiliation: Department of Radiation and Medical Oncology, Zhongnan Hospital of Wuhan University, Hubei 430071, China
To explore the prognostic value of immune-related genes in non-small cell lung cancer.The non-small cell lung cancer samples in the TCGA database were analyzed for the correlation of immune cell infiltration through ssGSEA and divided into the high and low immune cell infiltration group which further verified by ESTIMATE algorithm, immune gene correlation analysis and CIBERSORT algorithm. The differential genes of the high and low immune groups, the tumor and its surrounding normal tissues were screened by the R software "limma" package and the intersection genes were performed by functional cluster analysis. Univariate Cox regression analysis was used to analyze genes related to prognosis, Lasso regression and multivariate Cox regression analysis were used to construct a prognostic model, and Kaplan-Meier was used to verify the prognostic correlation between the model and patients’ survival. Univariate Cox analysis and multivariate Cox analysis verified that the immune gene prognosis-related model is an independent prognostic factor, and ROC analysis further verified its accuracy of survival prediction.According to the results of transcriptome sequencing, all cases were divided into the high immune cell infiltration group and the low immune cell infiltration group. There were significant differences in the expression of HLA family genes and PD-L1 between the groups. The selected immune-related differential genes were performed by protein interaction network analysis and cell function cluster analysis, and a prognostic model of immune genes was constructed. Kaplan-Meier verified that the model possessed a prognostic correlation with patient survival. The ROC curve verified that the model was a prognostic-related factor.The intersection of differentially expressed genes and immune-related genes in non-small cell lung cancer can be used to construct an immune prognostic model to confirm that it has immune prognostic function.
NSCLC; TCGA; immune related genes; prognostic signature
LIAO Zheng-kai, Email: zliao@whu.edu.cn
廖正凯,Email:zliao@whu.edu.cn
2021-03-10
10.3969/j.issn.1673-713X.2021.04.006
猜你喜欢
动物医学进展(2024年4期)2024-04-10 01:50:04
保健医苑(2023年2期)2023-03-15 09:03:04
中国临床医学影像杂志(2022年2期)2022-05-25 13:24:34
中学生数理化·高一版(2021年2期)2021-03-19 08:32:00
心电与循环(2020年1期)2020-02-27 07:48:24
知识经济·中国直销(2018年8期)2018-08-23 09:16:16
数学学习与研究(2017年3期)2017-03-09 18:12:42
中国老区建设(2016年1期)2016-02-28 09:32:00
医学研究杂志(2015年12期)2015-06-10 06:57:46
郑州大学学报(医学版)(2015年1期)2015-02-27 14:50:26