MADCR:Mobility Aware Dynamic Clustering-Based Routing Protocol in Internet of Vehicles
Sankar Sennan,Somula Ramasubbareddy,Sathiyabhama Balasubramaniyam,Anand Nayyar,Chaker Abdelaziz Kerrache,Muhammad Bilal
1 Deparment of of Computer Science and Engineering,Sona College of Technology,Salem 636005,India
2 Deparment of Information Technology,VNR Vignana Jyothi Institute of Engineering and Technology,Hyderabad 500090,India.
3 Graduate School,Duy Tan University,Da Nang 550000,Vietnam
4 Faculty of Information Technology,Duy Tan University,Da Nang 550000,Vietnam
6 Laboratoire d’Informatique et de Math´ematiques,Universit´e Amar Telidji de Laghouat,Laghouat,Algeria.
6 Department of Computer Engineering,Hankuk University of Foreign Studies,17035,Yongin-Si,South Korea
Abstract: Internet of Vehicles (IoV) is an evolution of the Internet of Things(IoT)to improve the capabilities of vehicular ad -hoc networks (VANETs) in intelligence transport systems.The network topology in IoV paradigm is highly dynamic.Clustering is one of the promising solutions to maintain the route stability in the dynamic network.However,existing algorithms consume a considerable amount of time in the cluster head (CH) selection process.Thus,this study proposes a mobility aware dynamic clustering -based routing (MADCR) protocol in IoV to maximize the lifespan of networks and reduce the end-to-end delay of vehicles.The MADCR protocol consists of cluster formation and CH selection processes.A cluster is formed on the basis of Euclidean distance.The CH is then chosen using the mayfly optimization algorithm(MOA).The CH subsequently receives vehicle data and forwards such data to the Road Side Unit(RSU).The performance of the MADCR protocol is compared with that ofAnt Colony Optimization (ACO),Comprehensive Learning Particle Swarm Optimization (CLPSO),and Clustering Algorithm for Internet of Vehicles based on Dragonfly Optimizer(CAVDO).The proposed MADCR protocol decreases the end-toend delay by 5–80 ms and increases the packet delivery ratio by 5%–15%.
Keywords:clustering protocol;Internet of things;Internet of vehicles; optimization algorithm; Mayfly algorithm
I.INTRODUCTION
The Internet of Things(IoT)is one the emerging technologies that connect billions of devices over the Internet and enable them to communicate with one another without human support.In our day-to-day life,we use devices such as laptops,television sets,smart phones,and vehicles [1,2].In recent years,IoT has become a popular research area in the industry and academia.IoT enabling technologies include wireless sensor networks,cloud computing,embedded systems,communicational protocols,and big data analytics.IoT applications include smart homes,smart retail,smart grids,and smart farms[3].
In IoT,one important research area is the Internet of Vehicles(IoT),which is derived from vehicular ad-hoc networks (VANETs).Amid the rapid growth of sensor technologies,large volumes of data aregenerated in IoV.The requirements of IoV need to be fulfilled to effectively handle transportation systems.IoV-based intelligent transportation systems have been introduced by various companies in different countries [4–6].IoV applications include traffic guidance systems,toll plazas,traffic flow monitoring,and intelligent vehicle control systems.Figure 1 shows the workflow architecture of IoV.Generally,vehicles are embedded with sensors.Vehicles are created by a cluster,and a cluster head(CH)is selected among the nodes in the cluster.The CH receives data packets from vehicles and exchanges the data withthe roadside unit (RSU).The RSU is directly connected to 5G-enabled Internet[7].In IoV,routing is one of the prominent processes to exchange data from one vehicle to another.IoV routing is categorized into three types,namely,unicast,multicast,and broadcast.Multicast routing is categorized into two types,namely geocast and cluster-based routing [8–11].Cluster-based routing decreases latency and the energy usage of vehicles in anetwork.However,cluster creation,CH selection,and reclustering do not provide efficient solutions for exchanging data between vehicles[12–15].
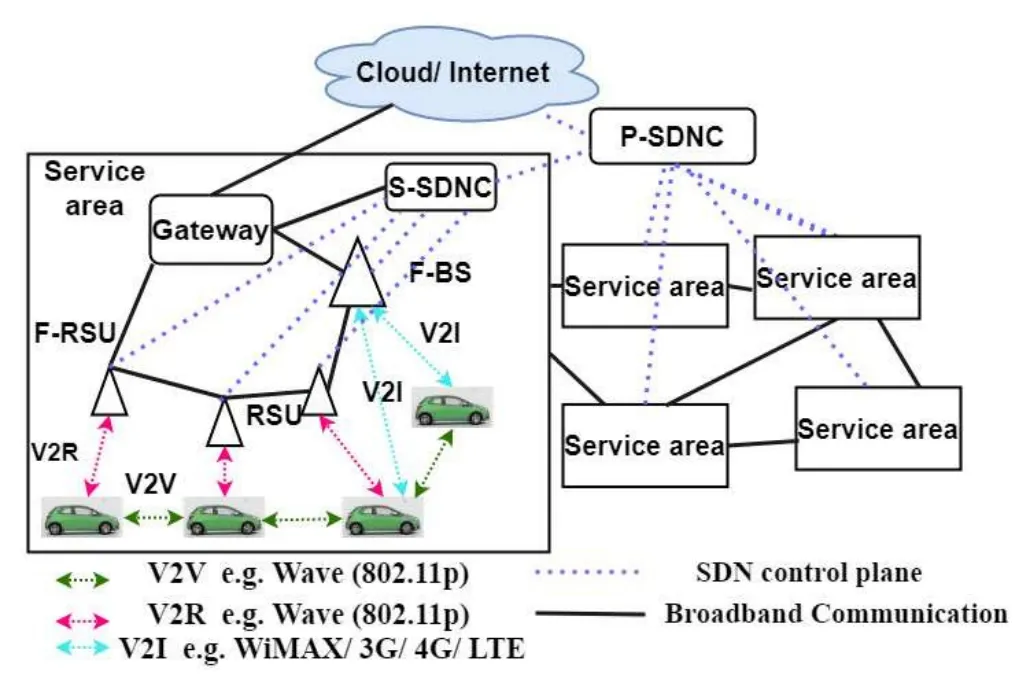
Figure 1.IoV architecture.
CH selection plays a vital role in clustering protocols.Optimization is a technique that provides the optimal solution among various solutions in the solution space.Hence,the use of an optimization algorithm is applicable to the selection of the best node in acluster.However,some optimization algorithms take a considerable amount oftime to converge in each iteration during CH selection.Thus,the selection of optimization algorithmsdetermines network functionalities,such asquality of service(QoS)and energy efficiency[16–20].
The current study proposes the MADCR protocol in IoV to maximize the lifetime of networks and drastically reduce the latency of vehicles.The MADCR protocol involves cluster formation and CH selection.A cluster is created by the Euclidean distance.The CH is then selected using the mayfly optimization algorithm(MOA).Finally,the CH gathers the data from vehicles and forwards them to the RSU.
The primary highlights of this work are as follows:
• The MADCR protocol involves cluster formationand CH selection.A cluster is formed by the Euclidean distance.The CH is then selected using the MOA.The CH subsequently gathers the data from vehicles and forwards them to the RSU.
• To reduce convergence time,the proposed MADCR protocol uses the MAO in selecting the optimal CH node in the network.
• Simulation is performed,and the efficiency of the MADCR protocol is compared with that of CLPSO and CAVDO.The proposed MADCR protocol offers superior performance in terms of energy consumption and data packet delivery.
The organization of the paper is as follows.Section 2 addresses the related work.Section 3 presents the proposed MADCR protocol.Section 4 details the results and discussions.Section 5 sets out the conclusion and future work.
II.RELATED WORK
Section 2 introduces various cluster-based routing protocols in IoV.
Aadil et al.[21]proposed a clustering algorithm for IoV (CAVDO) to improve network performance.The CAVDO algorithm was considered in a dynamic environment.The study incorporated two algorithms:the dragonfly optimization algorithm isused for CH selection,and the mobility-conscious hierarchical data transfer spectrum algorithm is used for network clustering.Simulation was performed using MATLAB.The efficacy of the proposed CAVDO algorithm relative to the ant colony optimization(ACO)and CLPSO algorithms was also evaluated.The CAVDO protocol provides superior performance in terms of cluster formation,CH selection,latency,and energy efficiency.However,its convergence time is longer than those of ACO and CLPSO.
Ebadinezhad et al.[22]implemented a clusteringbased ant colony optimizer (MACO) for IoV (CACOIOV)to optimize network performance in terms of latency and energy consumption.The proposed CACOIOV consists of two processes,namely,clustering and local network traffic computation.Clustering is performed using the MACO algorithm.Local network traffic is computed using the mobility dynamic aware transmission range algorithm.The CH is selected using network parameters,namely,node distance,speed,and local traffic.Simulation was conducted,and the performance of COCOIOV was compared with that of AODV and ACO.The proposed COCOIOV shows excellent performance in terms of packet delivery,loss ratio,and convergence time.However,the COCOIOV has a long convergence time during CH selection.
Khan et al.[23]proposed a two-level cluster-based routing scheme in IoV.In the first cluster level,the CH is selected by applying fuzzy logic to the parameters,namely,vehicle velocity,link quality,and kconnectivity factor.In addition,this layer resolves the issues related to the MAC layer contention problem.The second level applies the improved Q learning to select the best CH among the nodes in the cluster.The simulation results showed that the proposed two-level cluster-based routing is comparable to the multi hop moving zone protocol.The proposed protocol improves network performance in terms of network lifetime and packet delivery.However,maintaining a two-level CH in each cluster during data transfer is difficult.
Abbas et al.[24]proposed a software-Defined networking-based routing in IoV (SD-IoV).The SDIoV splits the data plane from the control plane.First,it introduces a road aware performance-enhanced routing protocol in IoV.In general,anetwork is divided into a number of segment regions.SD-IOV also supports multihop data transmission.Second,a mathematical model is introduced to check network availability and identify a durable routing path between the participant and the destination.The proposed SD-IoV protocol was compared with HRAR and SCGRP in the study.However,the proposed protocol utilizes cellular network only to exchange control messages.
Wang et al.[25]proposed Routing Algorithm-based Vehicle Position(RAVP)analysis in IoV.The goal was to address the problems in the relationship between a vehicle and its position.The RAVP algorithm uses several parameters,i.e.,vehicle movement location probability matrix,potential features of vehicle position,and implicit features thatdetermine vehicle position direction.Subsequently,the distance between vehicles is collected from trajectory values.The efficacy of the proposed RAVP algorithm was compared with that of ICAR,R2P,and RPUV.The proposed RAVP offers better performance than ICAR,R2P,and RPUV in terms of data delivery ratio,delay,and network traffic.However,the study did not discuss the problem of path selection and route disruption.
Qureshi et al.[26]proposed a self-assessment cluster-based routing (SACBR) protocol in IoV.The SACBR protocol consists of two procedures,namely,the creation of clusters and the selection of CH.A cluster is formed between the nodes in a network using the nearest neighbor node.The CH is selected using a self-assessment approach.Each CH node gathers information from its cluster participants and sends the aggregated data to another CH node.The data is retransmitted through the CH node in a multihop manner.The performance of the SACBR protocol was compared with that of GTLQR and CBVCA.The SACBR protocol offers superior performance in terms ofdata delivery and latency.However,it ignores routing delays and overhead problems.
Aadil et al.[27]proposed energy aware linkbased clustering (EALC) in flying ad-hoc networks(FANETs).The EALC protocol addresses the problem of short flight time and inefficient routing in FANETs.It involves two processes.First,it fine tunes the transmission range.Thus,it avoids the packet loss ratio.Second,it introduces the k-means algorithm to achieve efficient clustering in the network.In the study,the efficacy of EALC was evaluated by comparing it with that of clustering based on colony and gray wolf-based clustering.The proposed EALC increases network efficiency,including data delivery and QoS.However,the static weight assignment provides inaccurate solutions in the network.
Lin et al.[28]proposed an Order aware Hybrid Genetic Algorithm(OHGA)in IoV.The OHGA improves the node initialization and crossover operator.It incorporates the sweep algorithm and harmonize algorithm in the convergence process.In addition,it uses the neighborhood search algorithm to find the best fitness.In the study,a simulation was conducted,and the proposed OHGA was compared with BKS and HGA.The proposed OHGA shows superior performance in terms of data delivery ratio and latency.However,the OHGA does not provide excellent solutions in largescale networks.
Senuci et al.[29]proposed a heuristic clustering algorithm (HCAR) in IoV.It consists of the cluster formation and CH selection processes.A cluster is formed on the basis of a heuristic algorithm.The CH is chosen by the graph theory mechanism according to the weighted value of the node.In the study,the proposed HCAR was compared with MOSIC and DMCNF.The proposed HCAR provides superior performance in terms of end-to-end delay.
Dutta et al.[30]proposed an efficient hierarchical clustering protocol(EHCP)for multihop IoV communication.The assumption is that all nodes are connected to the Internet and transfer data to the RSU.All nodes gather information about neighboring nodes in the clustering process.The CH is then selected using the network parameters in the cluster.In the study,the performance of the EHCP was compared with that of N-hop and DMCNF.The proposed EHCP was found to perform better than other popular protocols.
The review of related works reveals the following limitations: existing algorithms take a long time to converge during CH selection,clusters in the network area are difficult to maintain,and some algorithms only support small-scale networks.Issues in the network should be solved to prolong its lifespan.
III.PROPOSED MOBILITY AWARE DYNAMIC CLUSTER-BASED ROUTING PROTOCOL
This study proposes the MADCR protocol in IoV to maximize network lifespan and reduce the latency of vehicles.The MADCR protocol involves cluster formation and CH selection.A cluster is constructed on the basis of the Euclidean distance.The CH is then chosen using the MOA.Finally,the CH gathers and transmits vehicle data to the RSU.The RSU is connected to the Internet.
3.1 Network Model
In the MADCR protocol,the vehicle nodes are placed randomly in the network.A vehicle can move bidirectionally with a velocity of 20–30 m/s.A cluster is initially formed on the basis of the Euclidean distance.The CH node is then selected using the MOA.The CH node subsequently gathers and transmits the vehicle data to the RSU.The Figure 2 shows the network model of the MADCR protocol.
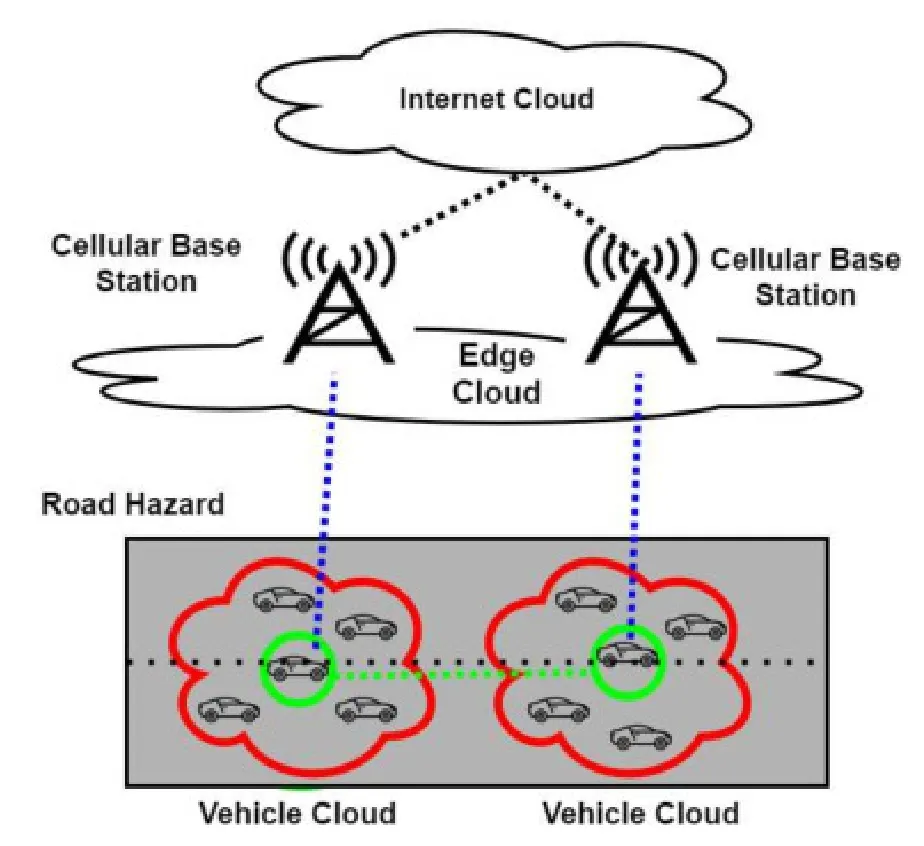
Figure 2.MADCR network model.
3.2 Cluster Formation
The distance d between nodes is calculated using Euclidean distance,as given in Eq.(1).

where (xi,xj),and (yi,yj) are the coordinates of nodes i and node j,respectively.
The distance d between a node and all other nodes in the network is generated as a matrix.It is given in Eq.(2).

The centroid is computed between two nodes(x1,y1),(x2,y2)and is given in Eq.(3).

We take two nodes and compute the distance d and centroid by using Eq.(3).We also calculate the centroid between any nodes in the network.If the value of the centroid is less than the value of d,then the node is associated with the Same Cluster(SC).Otherwise,the nodeis added to Different Cluster(DC).
The number of clusters is generated and shown in Eq.(4).

The number of clusters“CLUS”is determined from Eq.(5).

where p indicates the number of nodes in the k cluster.
Reclustering Process:If the vehicle moves away from the cluster,then the reclustering process is initiated to add the particular node in the new cluster.The vehicle status is calculated for reclustering,as shown in Eq.(6).

whereAvgdistshows the average distance between all nodes in the cluster.
3.3 Cluster Head Selection
The mayfly a metaheuristic algorithm resulting from the modification of the behavior of the Particle Swarm Optimization (PSO) algorithm.It is motivated by the social behavior of mayflies.Initially,the sets of mayflies are randomly generated in network clusters[31,32].
Each Mayfly (M) is placed randomly and is represented as a vector,as shown in Eq.(7).

The efficiency of the mayfly is measured by the objective function.The velocity of the mayfly Vel is represented as(V el1,V el2,.....V eln).Each mayfly tries to move toward the best positionPbestand attains the best solutionGbestin the cluster.
Movement of Male Mayflies:The Male Mayfly(MM) can adjust his role on the basis of his past experience and his neighbor mayfly.Letbe the current position of the male mayfly in theithsearch space at the time interval.In addition,the velocity of the mayflyis added in its current position.The new location of the measurement of the mayfly is given in Eq.(8).

The male mayfly usually performs a nuptial dance a few meters above water.It cannot move with superior speed,but it can maintain a constant speed.The velocity of the male mayflyis given in Eq.(9).

whereis the velocity of ith male mayfly in thejthdimension at time interval t;att1andatt2are attractive constants based on cognitive and social behaviors derived from PSO,respectively;Pbesti,jis the best position of theithmayfly in thejthdimension;βis the visibility coefficient;d2pindicates the distance between the ith male mayfly and the local best solutionPbesti; andd2gindicates the distance between theithmale mayfly and the global best solutionGbesti,jin the solution space.
The local best solutionPbestiat time interval t+1 is calculated in Eq.(10).

Fitness Function:The fitness function is used to assess the quality of the mayfly in the solution space.In the MADCR protocol,the fitness function is calculated on the basis of the distance between the moving vehicles in IoV.The fitness function calculation is given in Eq.(11).

where (MM1,jindicates the jth element in the ith mayfly andBest_valueis the local or global best in the solution space.
The ftiness of the current mayfly should satisfy the ftiness ofBest_value.Its calculation is given in Eq.(12).

The global best position is calculated in the solution space and is given in Eq.(13).

According to the behavior of mayflies,male mayflies perform anuptial dance with up and down movements.The best male mayflies continuously change their velocities,and th erelated calculation is given in Eq.(14).

where d indicates the nupital dance coefficient and r indcates the random number between-1 and 1.
Reclustering Process:To breed,Female Mayflies(FM) move into male mayflies.Let the current location of the female mayfly beFMti;its next position is determined from Eq.(15).

The attraction process is randomized.The best female mayfly attracts the best male mayfly on the basis of velocity values.The value of velocity is updated on the basis of the fitness function;it is given in Eq.(16).
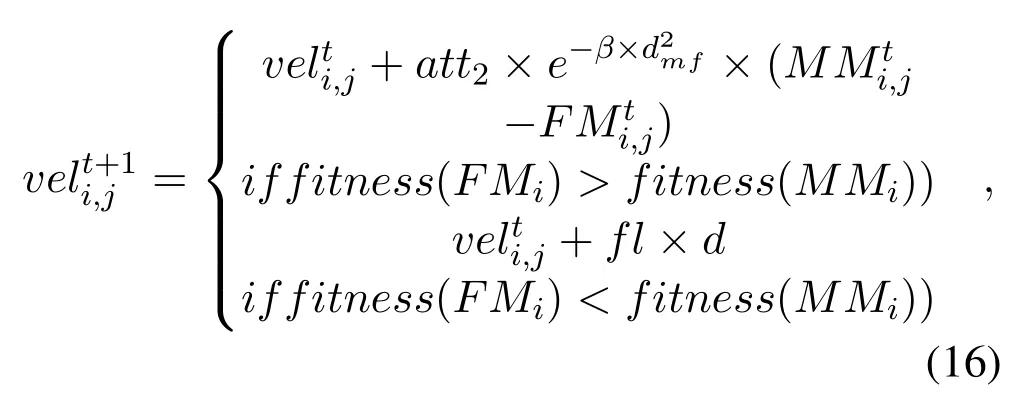
whereindicates the velocity of theith female mayfly in the jth dimension at time t,att2is the attraction constant,βis the visibility coefficient,dmfis the distance between the female and male mayflies,and fl indicates the random walk coefficient.
Mating of Mayflies:The mating process involves two mayflies.One parent is selected from the male population,and another parent is selected from the female population.Generally,the female parent attracts the male mayfly parent.The best female breeds with the best male mayfly.Similarly,the second and third best female mayflies breed with the second and third best mayflies,and so on.The result of the mating process is given in Eq.(17)and Eq.(18).
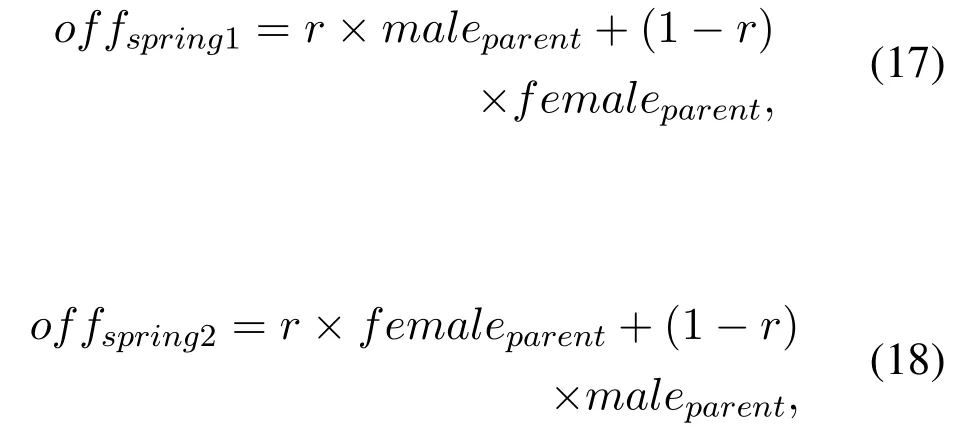
wheremaleparentis the mayfly from the male population,femaleparentis the mayfly from the female population,r indicates the random values between -1 and 1,andoffspringis initialized as 0.
Computing Velocity Limits:The velocity values are continuously updated beyond the limits of the real mayfly’s behavior.To resolve this issue,we fine-tune the velocity values,as shown in Eq.(19).

where areV elmaxand−V elmaxthe maximum and minimum values in the solution space.
TheV elmaxis computed from Eq.(20).

where r is a random value between 0 and 1.
Suppressing Nuptial Dance and Random Walk:The nuptial dance is performedby male mayflies,and the random walk is performed by female mayflies.The random walk should be performed within the problem search area.Thus,we can restrict the nuptial dance area as well.The speed of the nuptial dance and random walk is controlled,as shown in Eq.(21)and Eq.(22).
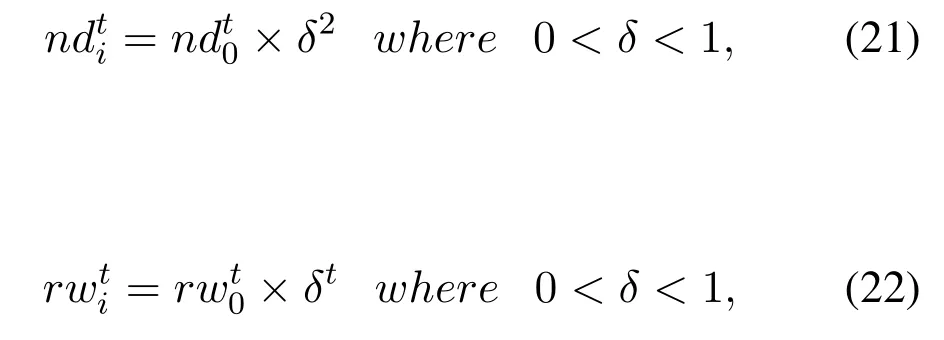
where t indicates the time or iteration,δindicates the random walk between o and 1,nd indicates the nuptial dance,and rw indicates the random walk.
The best male mayfly in the cluster acts as theCH for a particular round.The CH collects the data packets from the CMs.The CH aggregates the CMs to reduce the redundant data.The CH then forwards the data to the RSU.The RSU is connected to the Internet.On the basis of the vehicle data,autonomous driverless vehicles take appropriate decisions while on the road.
The overall process of the mayfly algorithm is follows.The male mayflies usually perform the nuptial dance a few meters above water.The male and female mayflies try to move close to each other.At the same time,the female mayflies attract the male mayflies.In such a way,the velocities of the male and female mayflies vary according to the their local and global best positions.The Algorithm 1 shows the Mobility aware dynamic cluster based routing protocol.
The work flow of the MADCR protocol is shown in Figure 3.
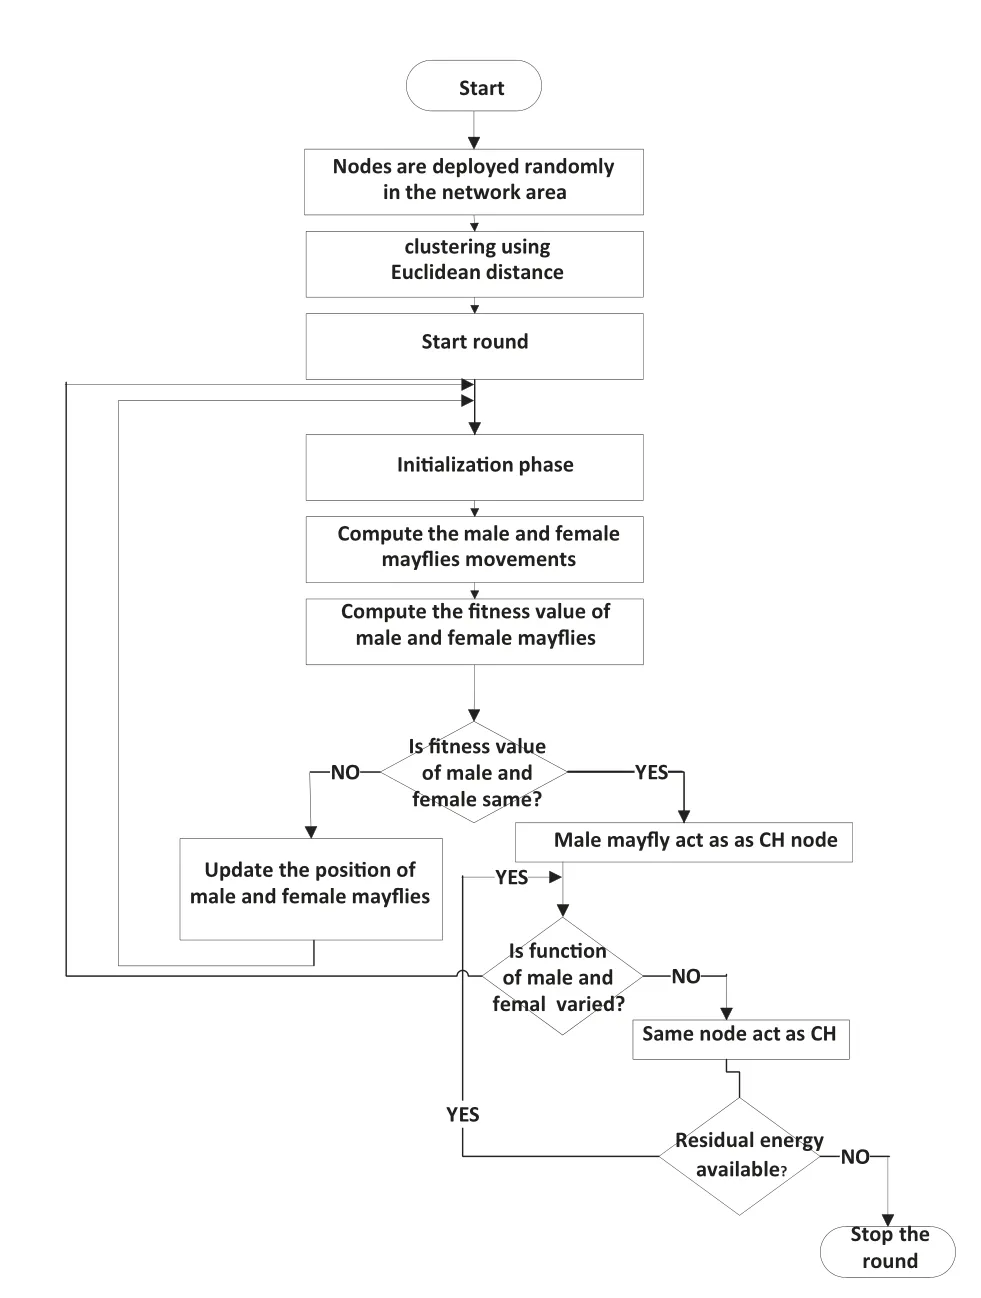
Figure 3.Work flow of MADCR protocol.
IV.RESULT AND DISCUSSIONS
The performance of the MADCR protocol is simulated using MATLAB 2019a and compared with that of CAVDO and CLPSO.The simulation nodes are 30,40,50,and 60.The network grid sizes range from 1 km to 4 km square area.The mobility model is a freeway.The node movement is bidirectional.The transmission range is dynamic [33,34].Table 1 shows the simulation parameters and values of the MADCR protocol.
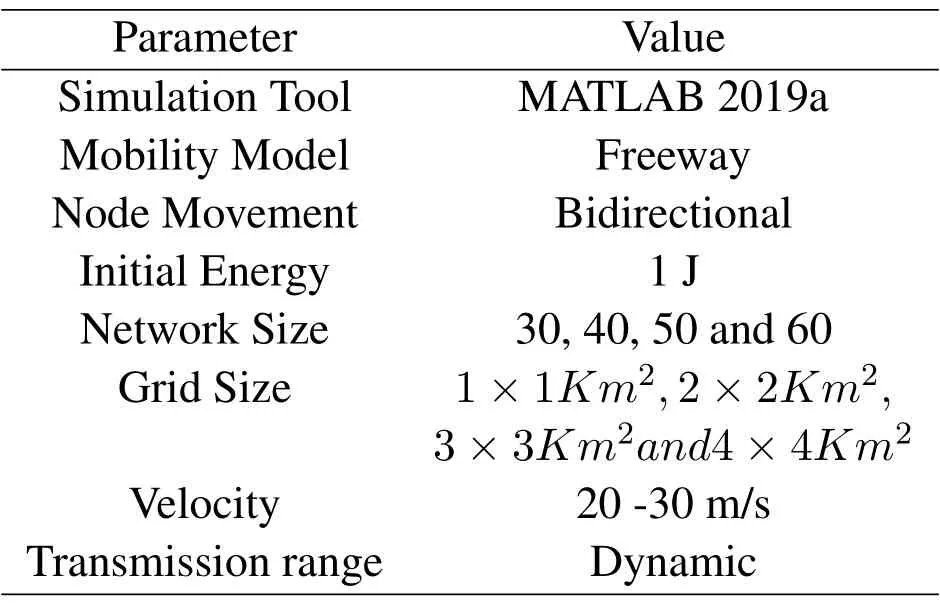
Table 1.Simulation settings and parameters.
4.1 Number of Clusters Vs.Grid Size
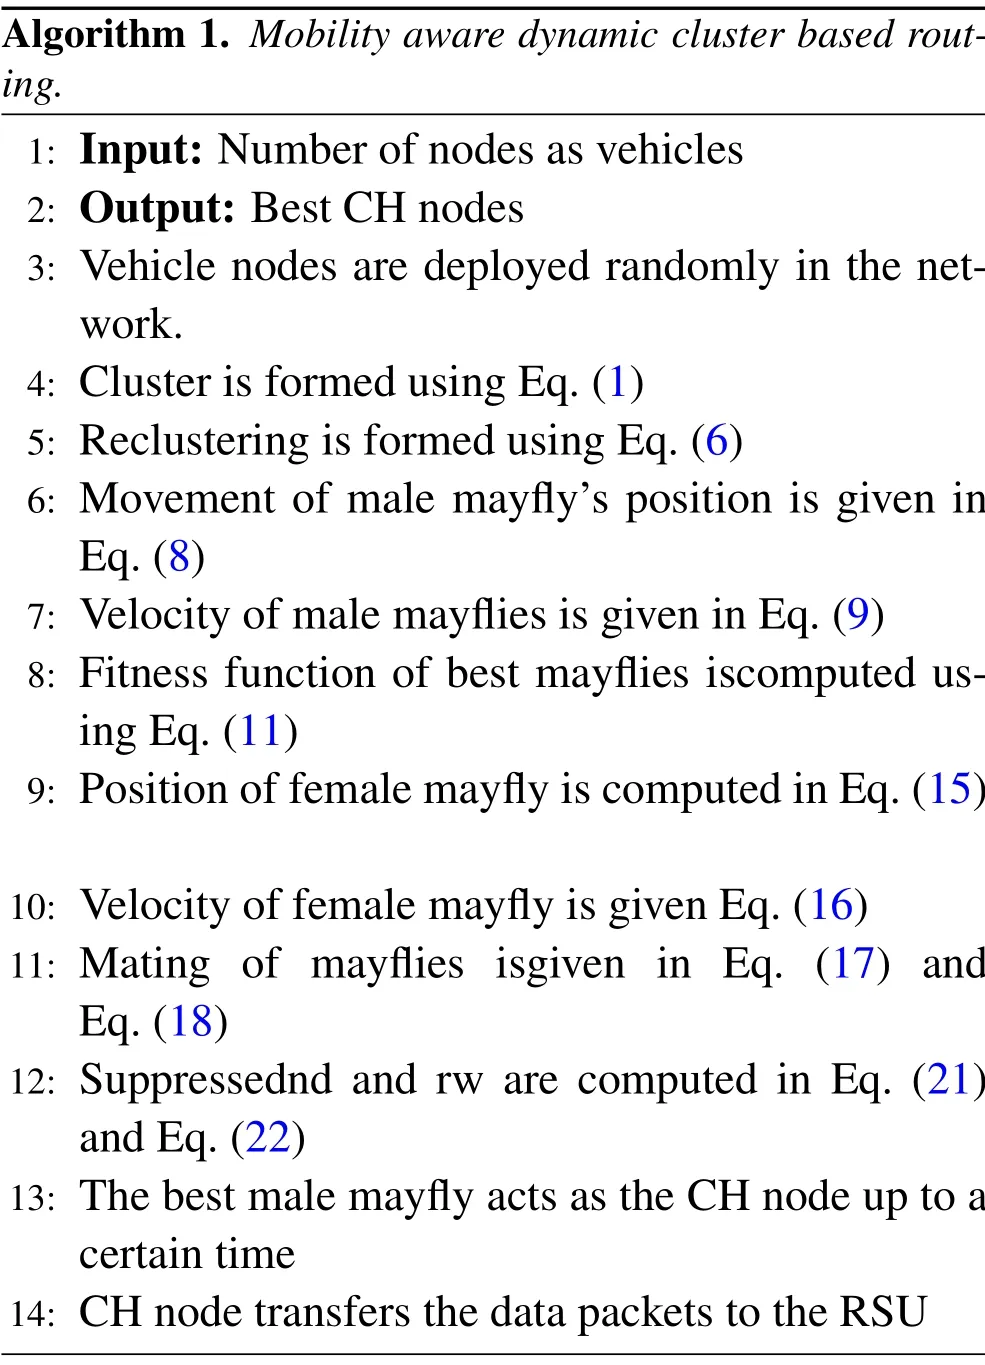
Algorithm 1.Mobility aware dynamic cluster based routing.1: Input: Number of nodes as vehicles 2: Output: Best CH nodes 3: Vehicle nodes are deployed randomly in the network.4: Cluster is formed using Eq.(1)5: Reclustering is formed using Eq.(6)6: Movement of male mayfly’s position is given in Eq.(8)7: Velocity of male mayflies is given in Eq.(9)8: Fitness function of best mayflies iscomputed using Eq.(11)9: Position of female mayfly is computed in Eq.(15)10: Velocity of female mayfly is given Eq.(16)11: Mating of mayflies isgiven in Eq.(17) and Eq.(18)12: Suppressednd and rw are computed in Eq.(21)and Eq.(22)13: The best male mayfly acts as the CH node up to a certain time 14: CH node transfers the data packets to the RSU
Figure 4 illustrates the number of clusters with respect to the grid size.The minimum number of clusters provides an efficient transmission range for any grid size.The numbers of clusters in CLPSO,CAVDO,and MADCR are 27,25,and 22,respectively,for a grid size of 4,000 m ×4,000 m.The size of the grid increases with the number of clusters.However,the number of clusters in the MADCR protocol is lower than that in CLPSO and CAVDO because of the consideration of the nearest neighbor clustering algorithm.
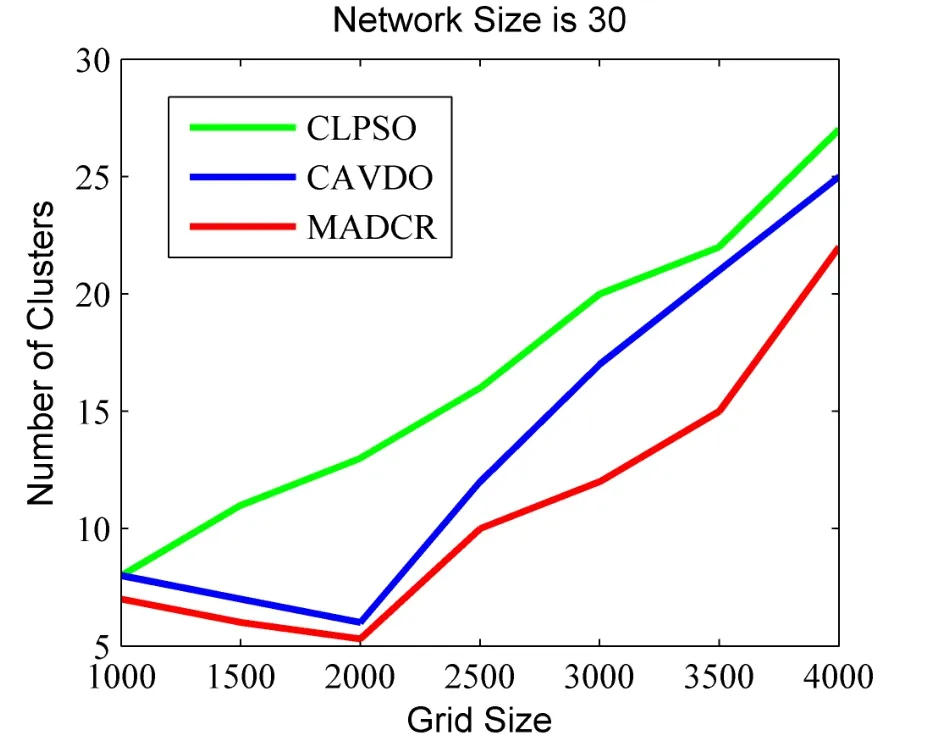
Figure 4.Number of clusters vs.grid size.
Table 2 indicates the number of clusters with respect to grid size for 30 nodes.The size of the grid increases with the number of clusters.
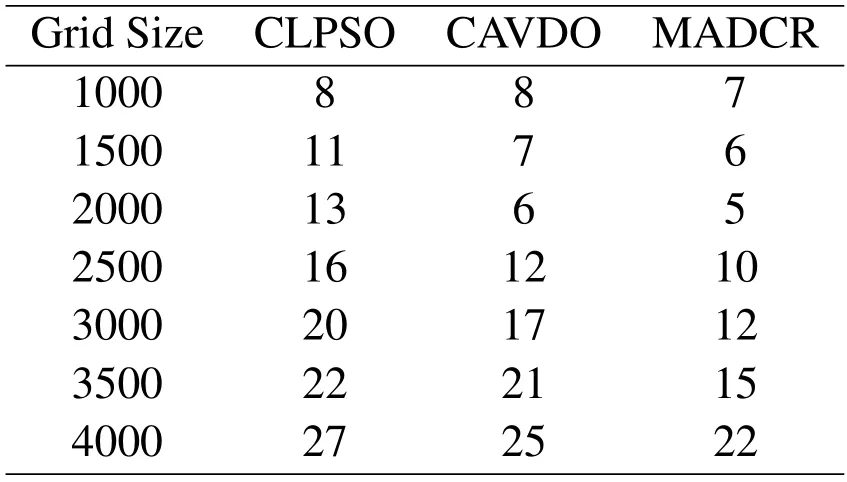
Table 2.Number of clusters vs.grid size.
Figure 5 illustrates the number of clusters with respect to the grid size.The numbers of clusters in CLPSO,CAVDO,and MADCR are 26,38,and 29,respectively,for a grid size of 4,000 m ×4,000 m.The size of the grid increases as the number of clusters increases.However,the number of clusters in the MADCR protocol is slightly higher than that in CLPSO.
Table 3 presentsthe number of clusters with respectto grid size for 40 nodes.The size of the grid increases with the number of clusters.
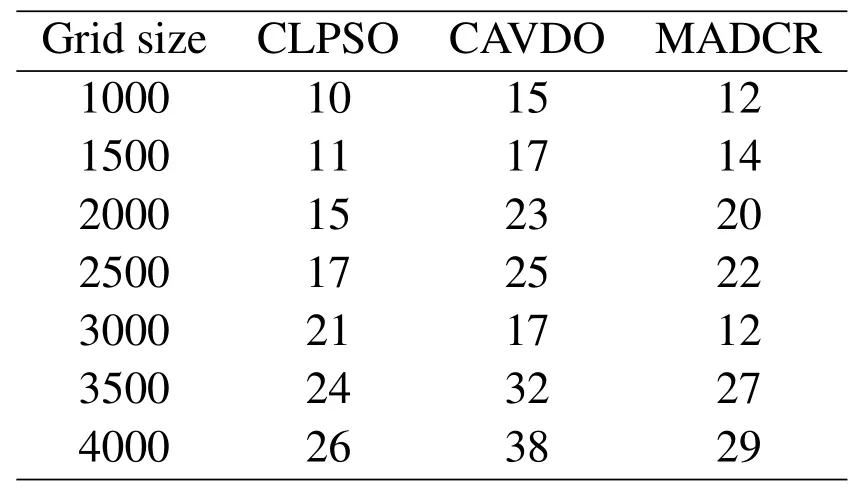
Table 3.Number of clusters vs.grid size.
Figure 6 illustrates the number of clusters with respect to grid size.The numbers of clusters in CLPSO,CAVDO,and MADCR are 38,40,and 28,respectively,for a grid size of 4,000 m×4,000 m.The size of the grid increases as the number of clusters increases.However,the number of clusters in the MADCR protocol is lower than those in CLPSO and CAVDO because of the consideration of the nearest neighbor clustering algorithm.
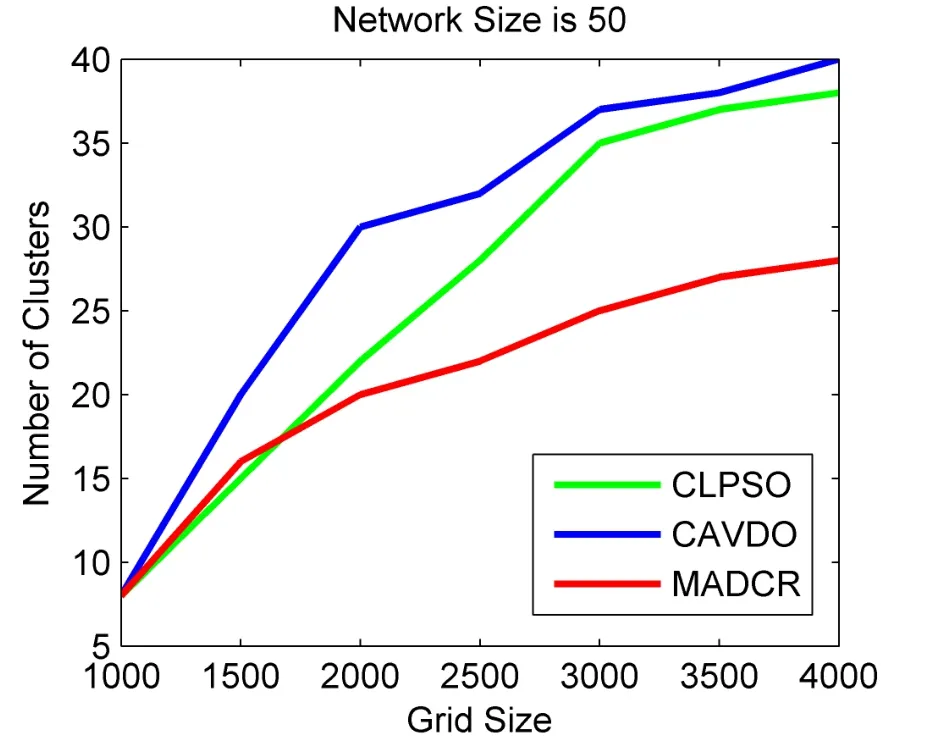
Figure 6.Number of clusters vs.grid size.
Table 4 indicates the number of clusters with respect to grid size for 50 nodes.The size of the grid increases with the number of clusters because of the consideration of the nearest neighbor clustering algorithm.
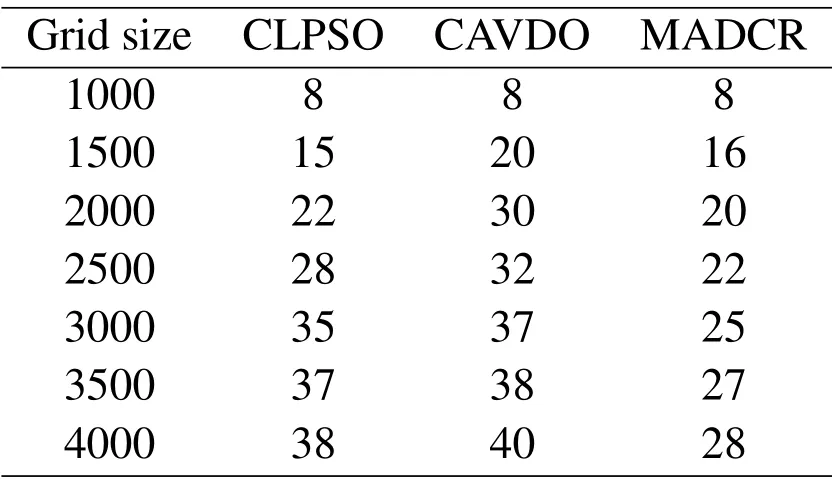
Table 4.Number of clusters vs.grid size.
Figure 7 illustrates the number of clusters with respect to the grid size.The numbers of clusters in CLPSO,CAVDO,and MADCR are 35,32,and 22,respectively,for a grid size of 4,000 m ×4,000 m.The size of the grid increases as the number of clusters increases.However,the number of clusters in the MADCR protocol is lower than those in CLPSO and CAVDO because of the consideration of the nearest neighbor clustering algorithm.
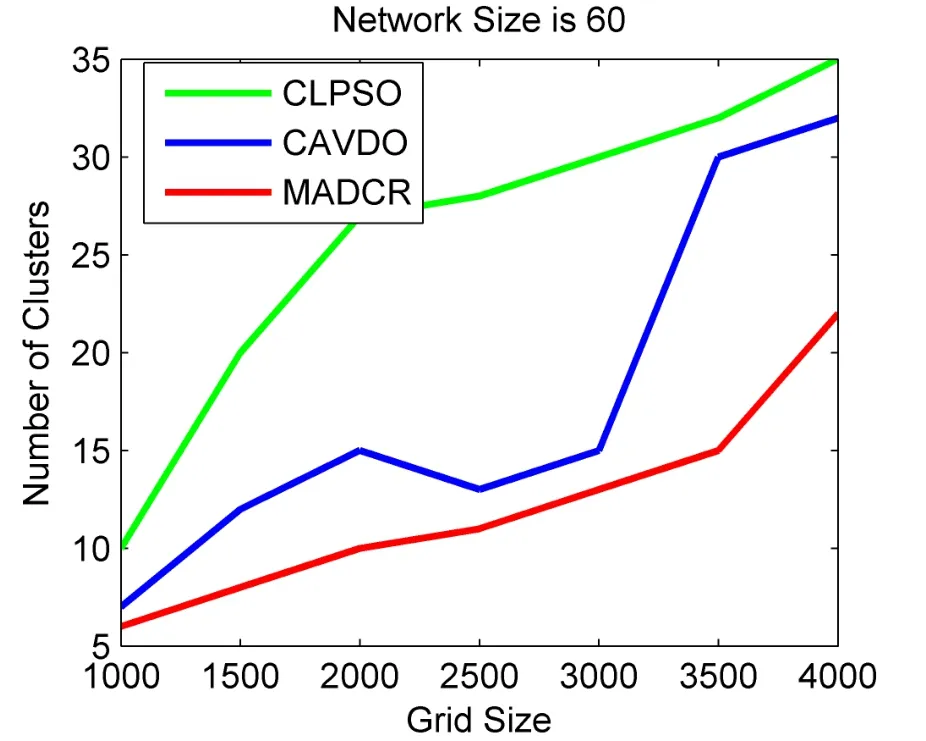
Figure 7.Number of clusters vs.grid size.
Table 5 indicates the number of clusters with respect to grid size for 60 nodes.The number of clusters in the MADCR protocol is lower than those in CLPSO and CAVDO.As the number of clusters increases,the grid size and node size also increase.
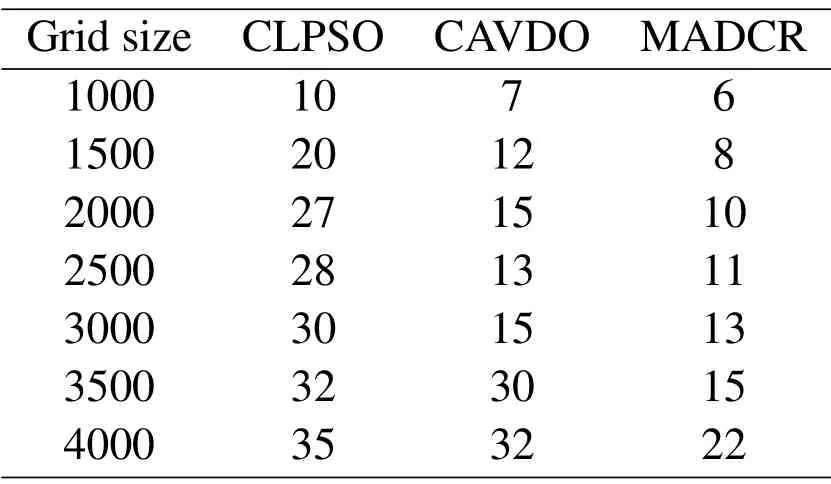
Table 5.Number of clusters vs.grid size
4.2 Cluster Head Selection Time Vs.Grid Size
Figure 8 illustrates the CH selection time with respect to grid size.It shows the period of time taken to rotate the CH node in the cluster.The CH selection times in CLPSO,CAVDO,and MADCR are 380,350,and 320ms,respectively,for a grid size of 4,000m×4,000m.As the grid size increases,the CH selection time also increases.However,in CH selection,the CLPSO and MADCR protocols take less time compared with CAVDO.This resultis mainly due to the consideration of fast convergence in the optimization algorithm.
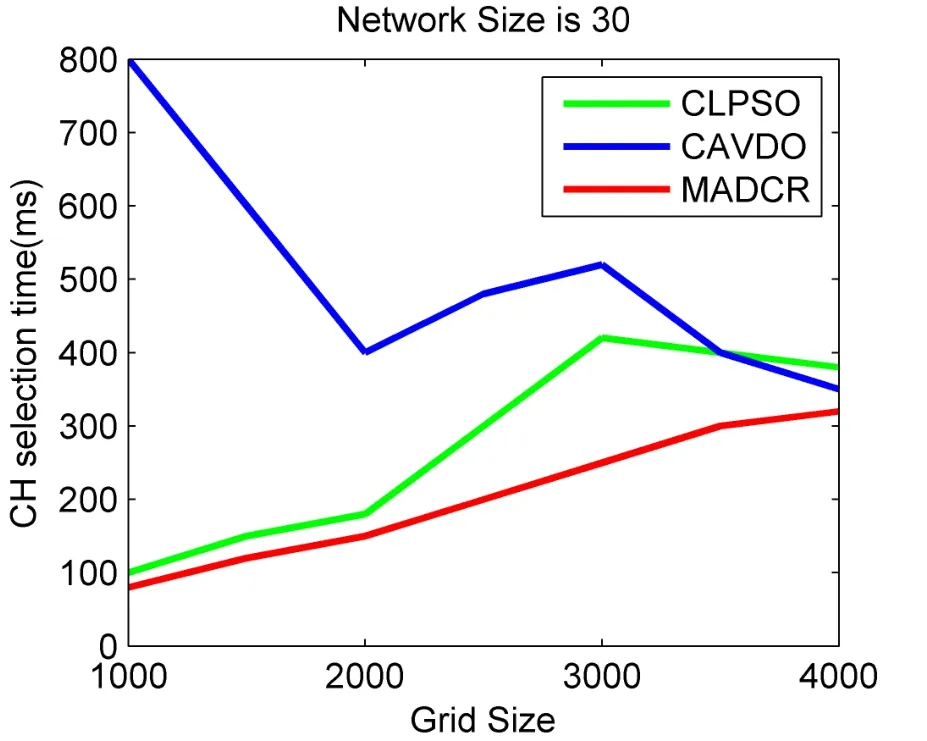
Figure 8.CH selection time vs.grid size.
Table 6 indicates the CH selection time with respect to grid size for 30 nodes.The CH selection time is lower in the MADCR protocol than in CLPSO and CAVDO.
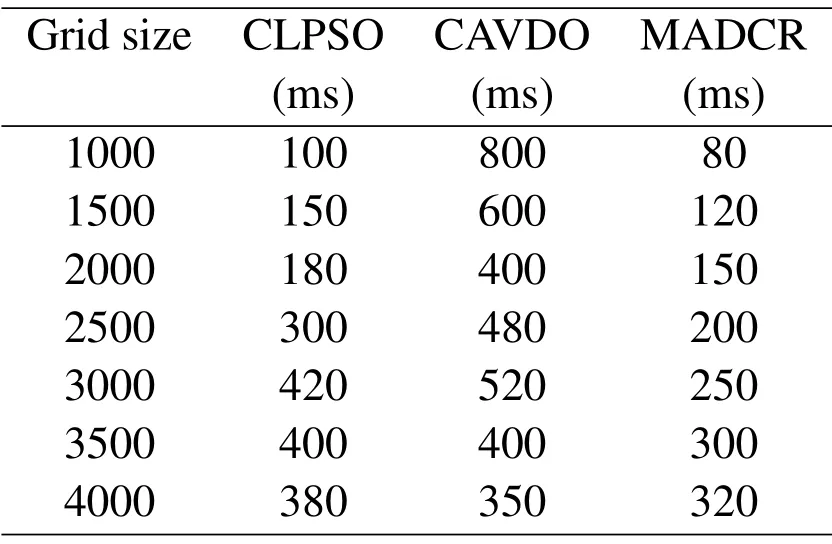
Table 6.CH selection time vs.grid size.
Figure 9 illustrates the CH selection time with respect to grid size.The CH selection times in CLPSO,CAVDO,and MADCR are 700,580,and 350 ms,respectively,for a grid size of 4,000m×4,000m.As the size of the grid increases,the CH selection time also increases.However,during CH selection,the CLPSO and MADCR protocols take less time compared with CAVDO.This resultis mainly due to the consideration of fast convergence in the optimization algorithm.
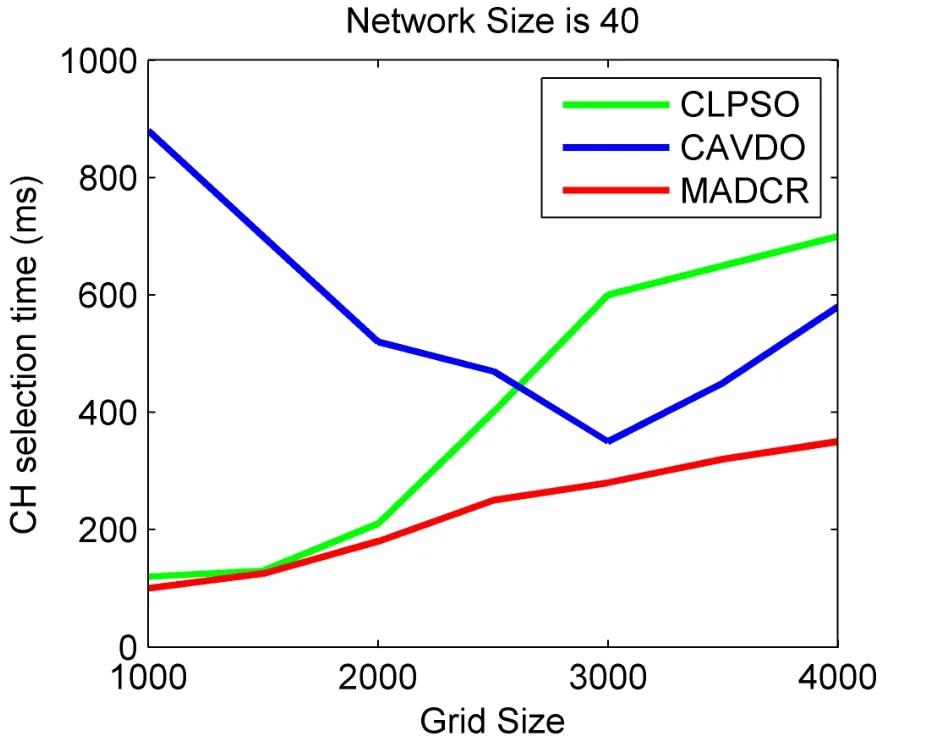
Figure 9.CH selection time vs.grid size.
Table 7 indicates the CH selection time with respect to grid size for 40 nodes.The CH selection time is lower in MADCR than in CLPSO and CAVDO.
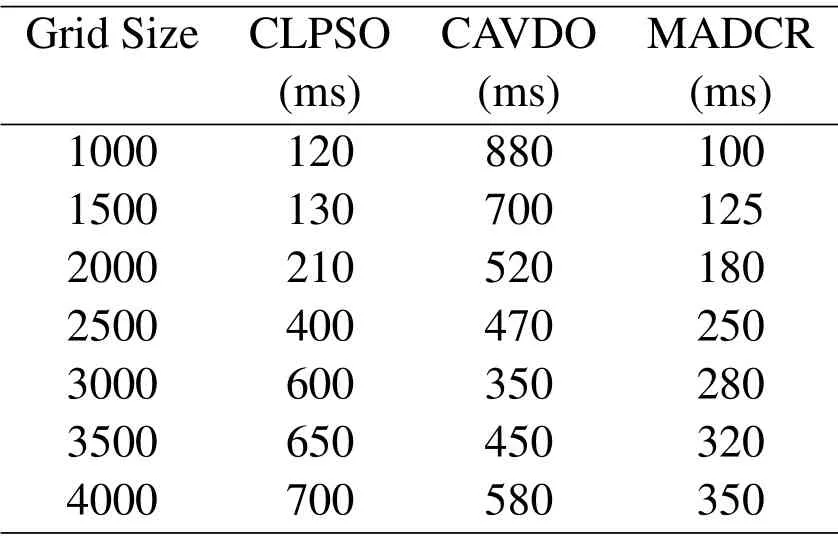
Table 7.CH selection time vs.grid size.
Figure 10 illustrates the CH selection time with respect to grid size.The CH selection times in CLPSO,CAVDO,and MADCR areobserved to be 1,200,950,and 700 ms,respectively,for a grid size of 4,000 m×4,000 m.As the grid size increases,the CH selection time also increases.However,in CH selection,the CLPSO and MADCR protocols take less time compared with CAVDO.This resultis mainly due to the consideration of fast convergence in the optimization algorithm.
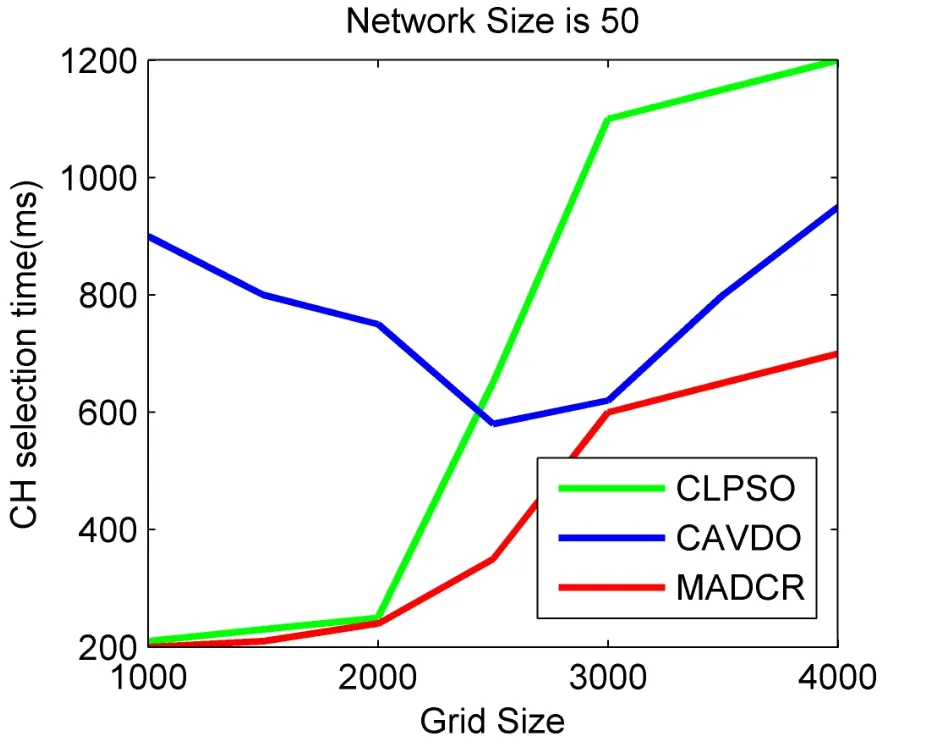
Figure 10.CH selection time vs.grid size.
Table 8 indicates the CH selection time with respect to grid size for 50 nodes.The CH selection time is lower in MADCR than in CLPSO and CAVDO.
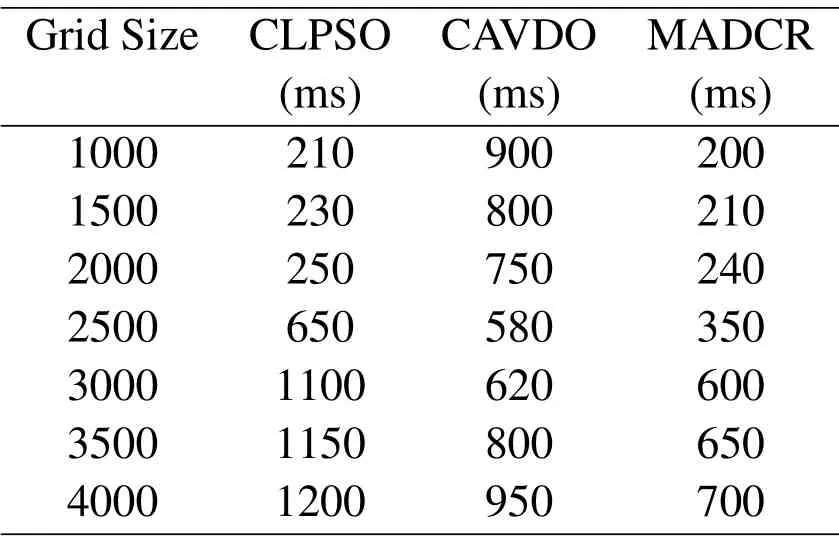
Table 8.CH selection time vs.grid size.
Figure 11 illustrates the CH selection time with respect to grid size.The CH selection times in CLPSO,CAVDO,and MADCR are 1,075,1,000,and 770 ms,respectively,for agrid size of 4,000m×4,000m.As the grid size increases,the CH selection time also increases.However,in CH selection,the CLPSO and MADCR protocols take less time compared with CAVDO.This resultis mainly due to the consideration of fast convergence in the optimization algorithm.
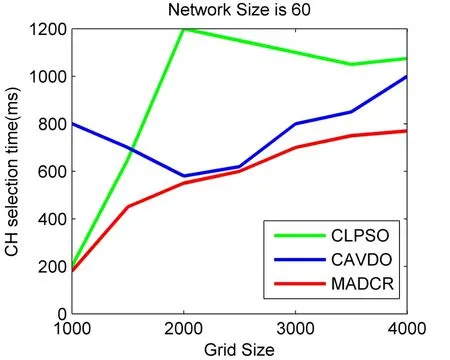
Figure 11.CH selection time vs.grid size.
Table 9 indicates the CH selection time with respect to grid size for 60 nodes.The CH selection time is lower in MADCR than in CLPSO and CAVDO.
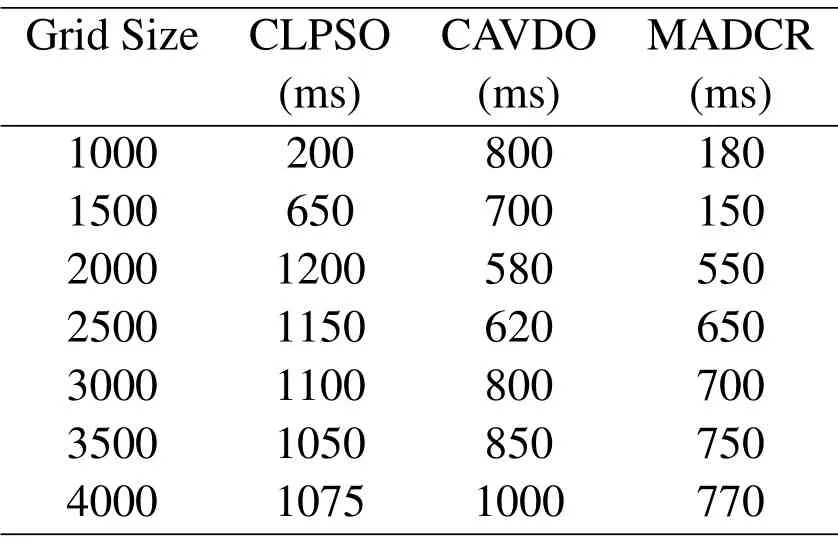
Table 9.CH selection time vs.grid size.
4.3 Reclustering Delay Vs.Grid Size
Reclustering delay shows the amount of time needed to create a cluster when link failure occurs in the network.Figure 12 illustrates the reclustering time with respect to grid size.The reclustering times in CLPSO,CAVDO,and MADCR are observed to be 15,5,and4 ms,respectively,for a grid size of 4,000 m×4,000 m.The size of the grid is confirmed to increase as the time of reclustering decreases.However,the proposed MADCR protocol takes less reclustering time than CAVDO and MADCR.This difference is mainly due to the consideration of the mobility aware reclustering mechanism.
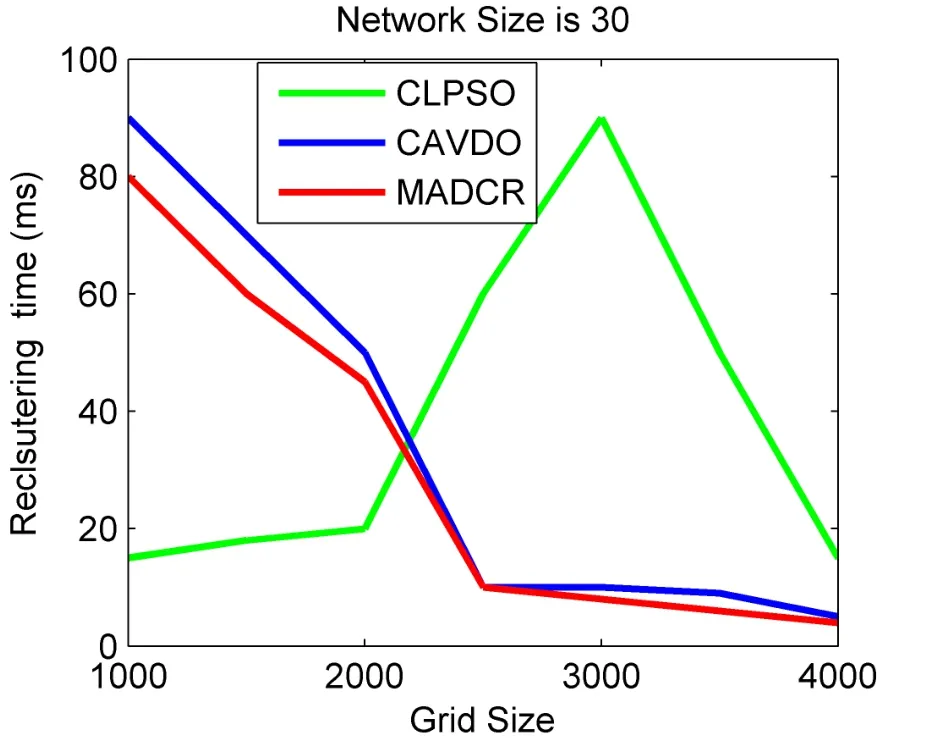
Figure 12.Reclustering time vs.grid size.
Table 10 indicates the reclustering time with respect to grid size for 30 nodes.The reclustering time is lower in MADCR than in CLPSO and CAVDO.
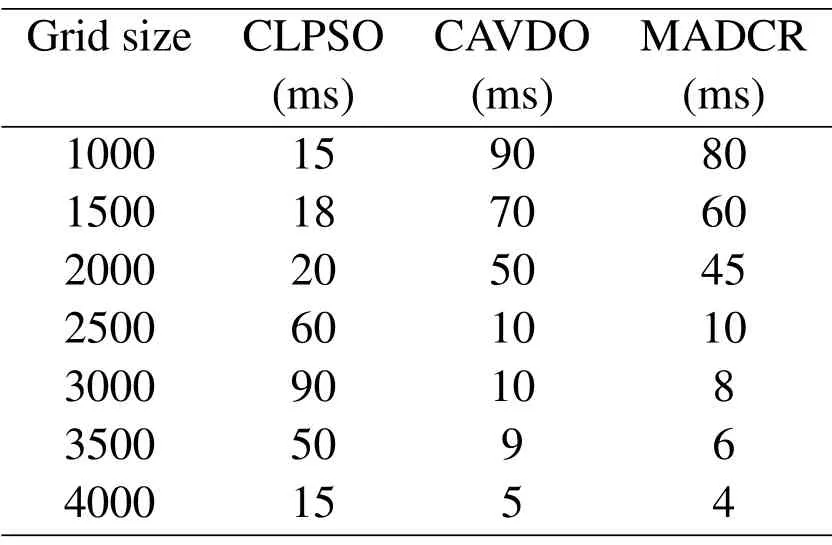
Table 10.Reclustering time vs.grid size.
Figure 13 illustrates the reclustering time with respect to grid size.The reclustering times in CLPSO,CAVDO,and MADCR are observed to be 40,10,and 10 ms,respectively,for a grid size of 4,000 m×4,000 m.As the grid size increases,the reclustering time decreases.The reclustering time of the MADCR protocol is lower than those of CAVDO and CLPSO.This result is mainly due to the consideration of the mobility aware reclustering mechanism.
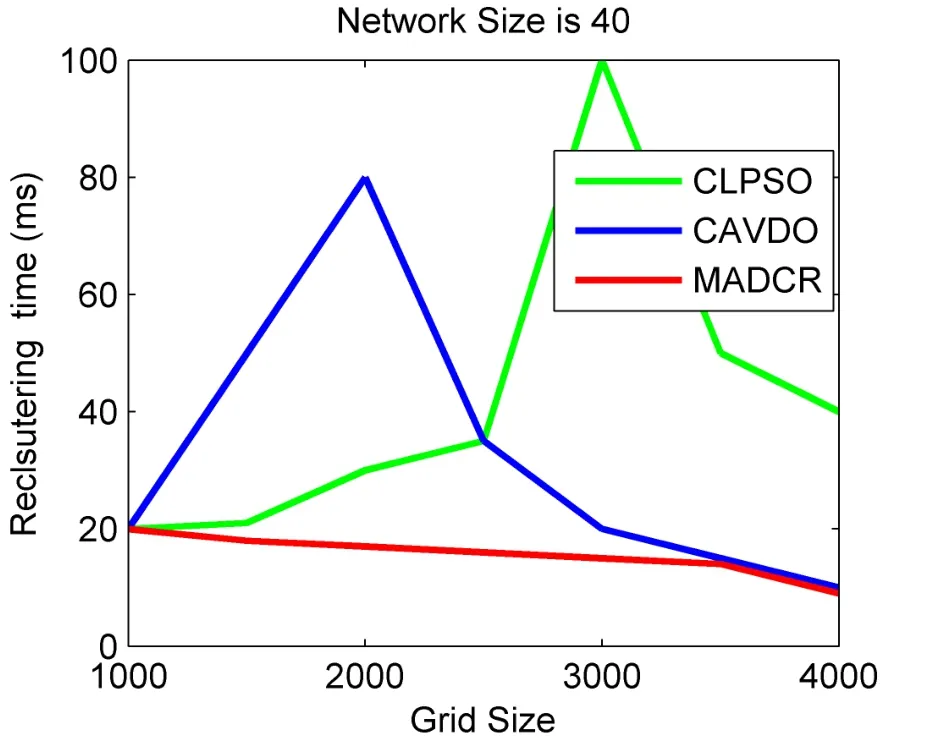
Figure 13.Reclustering time vs.grid size.
Table 11 indicates the reclustering time with respect to grid size for 40 nodes.There clustering time is lower in MADCR than in CLPSO and CAVDO.
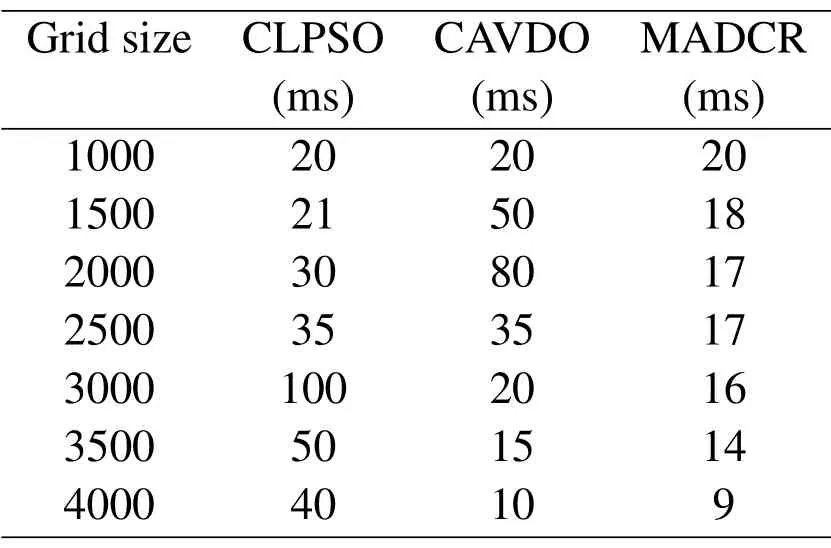
Table 11.Reclustering time vs.grid size.
Figure 14 illustrates the reclustering time with respect to grid size.For a grid size of 4,000m×4,000m,the clustering times in CLPSO,CAVDO,and MADCR are observed to be 40,280,and 100 ms,respectively.As the size of the grid increases,the time of reclustering decreases.However,the reclustering time in the MADCR protocol is higher than those in CAVDO and MADCR.
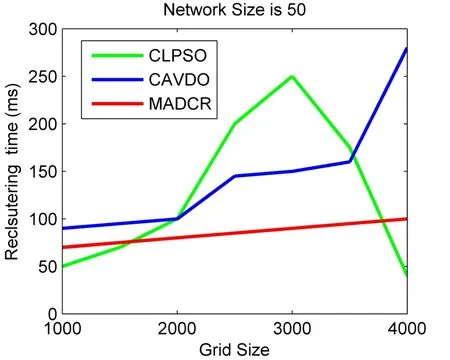
Figure 14.Reclustering time vs.grid size.
Table 12 indicates the reclustering time with respect to grid size for 50 nodes.There clustering time is slightly higher in MADCR than in CLPSO.
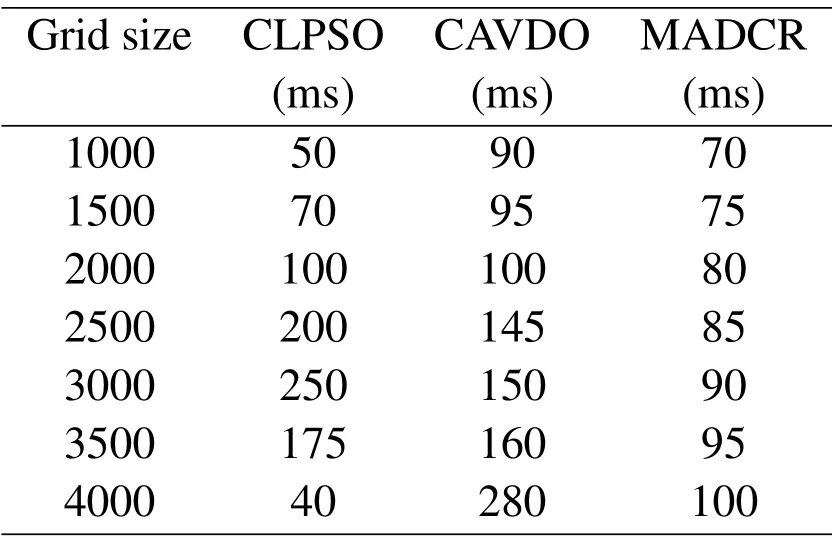
Table 12.Reclustering time vs.grid size.
Figure 15 illustrates the reclustering time with respect to grid size.For a grid size of 4,000 m ×4,000 m,the clustering times in CLPSO,CAVDO,and MADCR are observed to be 180,170,and 150 ms,respectively.As the grid size increases,the reclustering time decreases.However,the reclustering time in the MADCR protocol is lowerthan those in CAVDO and MADCR.This result is mainly due to the consideration of the mobility aware reclustering mechanism.
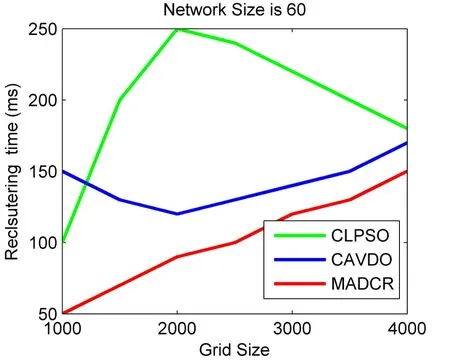
Figure 15.Reclustering time vs.grid size.
Table 13 indicates the reclustering time with respect to grid size for 50 nodes.The reclustering time is lower in MADCR than in CLPSO and CAVDO.
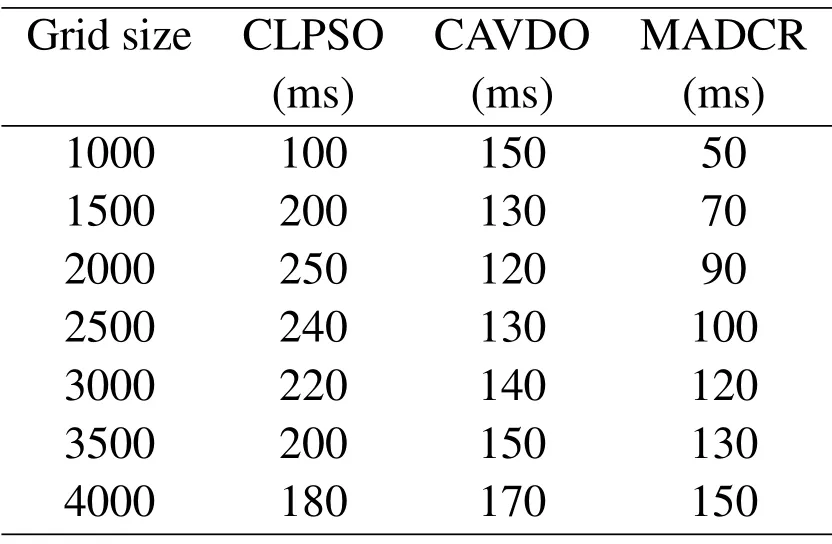
Table 13.Reclustering time vs.grid size.
4.4 Packet Delivery Ratio(PDR)
The packet delivery ratio (PDR) indicates that data packets are received successfully at the destination.In IoV,the PDR is one of the predominant parameters because one vehicle needs to exchange vehicle information withanother.
Figure 16 illustrates the PDR with respect to the number of vehicles.The PDRs in CLPSO,CAVDO,and MADCR are 78%,87%,and 94%,respectively,for a vehicle size of 60.The PDR is higher in MADCR than in CLPSO and CAVDO with respect to different vehicle sizes.This result is mainly due to the consideration of fast convergence during CH selection.
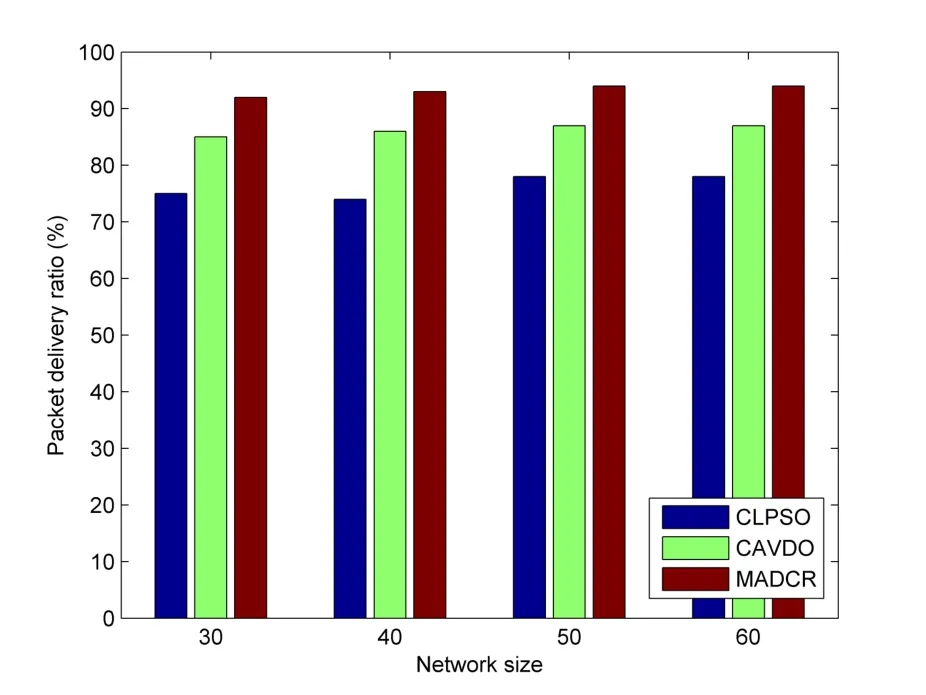
Figure 16.Packet delivery ratio vs.number of vehicles.
Table 14 indicates the PDR with respect to the number of vehicle or network nodes.The PDR is higher in MADCR than in CLPSO and CAVDO with respect to different vehicle sizes.
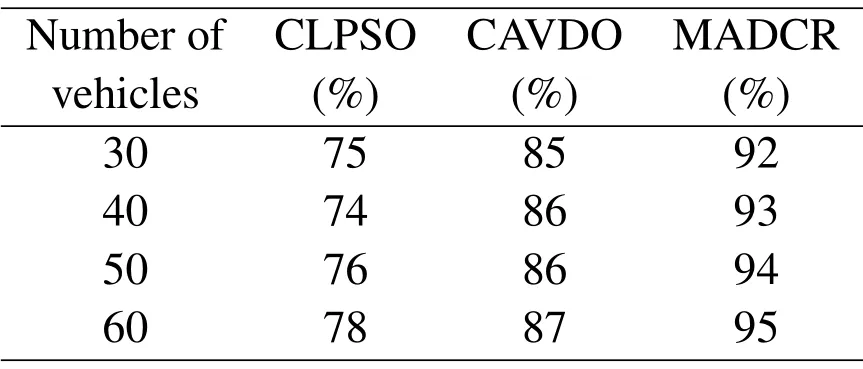
Table 14.Packet delivery ratio vs.number of vehicles.
4.5 End-to-End Delay
End-to-end delay shows the time period required to exchange data packets from the source to the destination.Figure 17 shows the end-to-end delay in relation to the different vehicle sizes in the network.The endto-end delays in CLPSO,CAVDO,and MADCR are 350,300,and 110,respectively,with respect toa vehicle size of60.End-to-end latency increases as vehicle size increases.This result is mainly due to the quick convergence during the CH selection process.
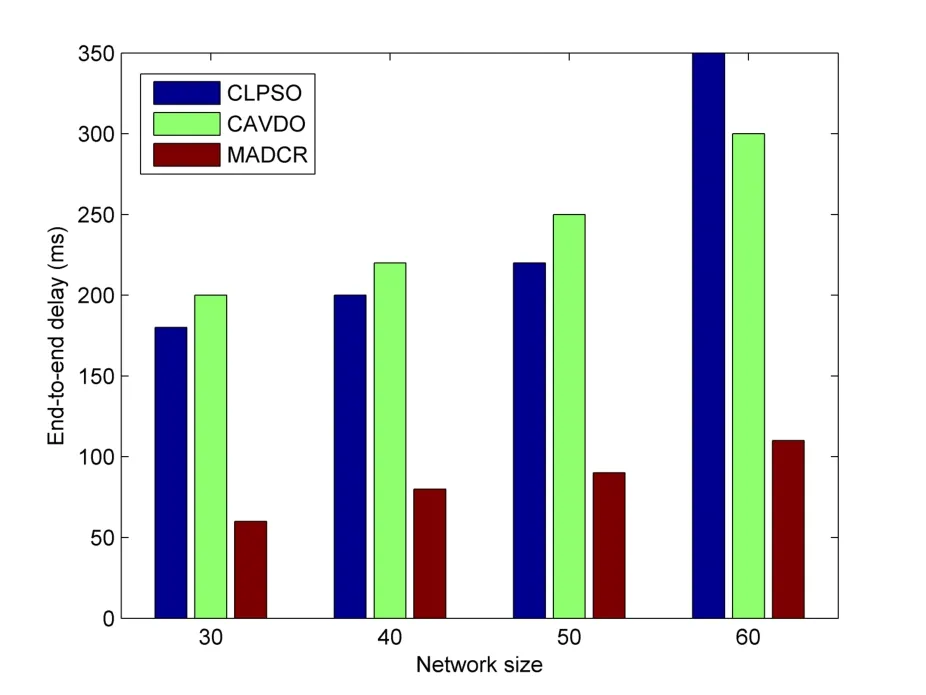
Figure 17.End-to-end delay vs.number of vehicles.
Table 15 indicates the end-to-end delay with respect to the number of vehicles or network nodes.The endto-end delay is lower in MADCR than in CLPSO and CAVDO with respect to different vehicle sizes.
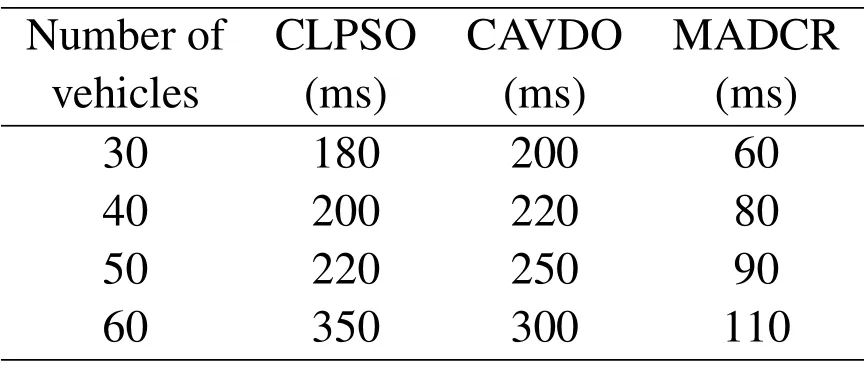
Table 15.End-to-end delay vs.number of vehicles.
4.6 Average Packet Overhead Vs.Velocity
The average packet overhead shows the number of data packets generated with respect to velocity.Figure 18 shows the average packet overhead with respect to velocity.The average packet overheads in CLPSO,CAVDO,and MADCR are 16,15,and 12 kbps,respectively,for avelocity of 30 m/s.The packet overhead rises as the velocity increases.This result is mainly due to velocity increasing during the CH selection process.
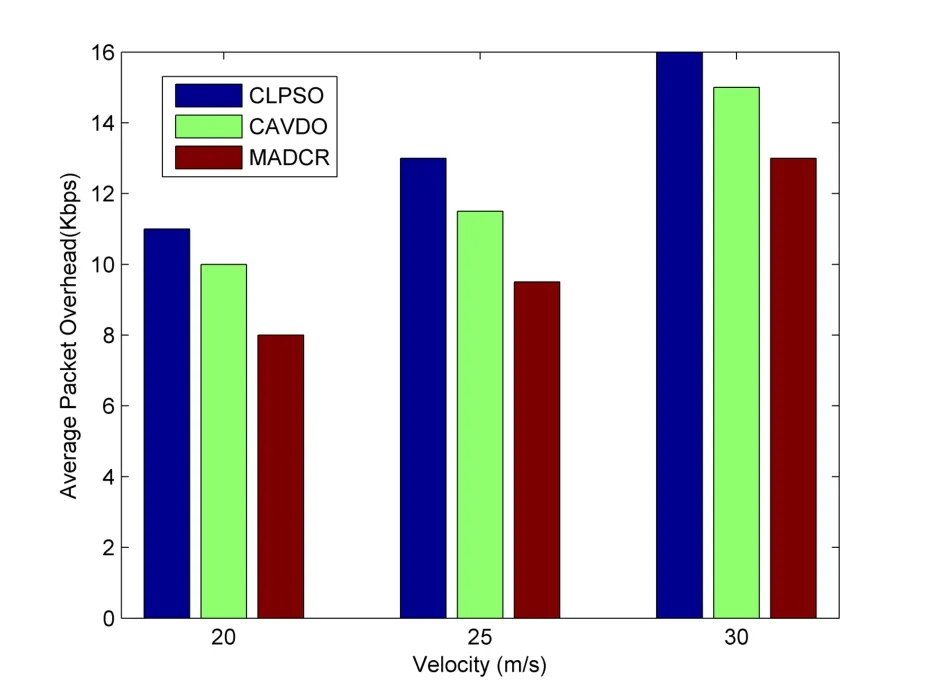
Figure 18.Average packet overhead vs.velocity.
Table 16 indicates the average packet overhead with respect to the number of vehicles or network nodes.End-to-end delay is lower in MADCR than in CLPSO and CAVDO with respect to different vehicle sizes.
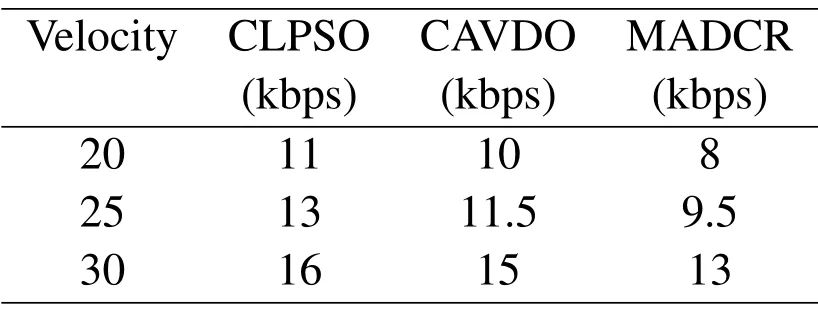
Table 16.Average packet overhead vs.velocity.
V.ANALYSIS
On the basis of the simulation results and data analysis,the proposed MADCR is effective as it increases the PDR and reduces end-to-end latency.Simulationis performedby varying the network size and grid size.From these scenarios,the number of clusters increases as the grid size increases.In addition,the CH selection time and reclustering time in MADCR are lower than those in CLPSO and CAVDO as the network size varies with respect to gridsize.The PDRs in CLPSO,CAVDO,and MADCR are 78%,87%,and 94%,respectively,with respect to a vehicle size of60.The PDR is observed to increase as the vehicle size increases in the network.Further more,the end-to-end delays in CLPSO,CAVDO,and MADCR are 350,300,and 110,respectively,with respect to a vehicle size of60.End-to-end latency is observed to increase as the size of the vehicle increases.This resultis mainly due to the consideration of the MAO in the selection of the optimal CH in the cluster.In this way,the proposed protocol reduces the end-to-end delay and increases the PDR.
VI.CONCLUSION AND FUTURE WORK
The IoV is an evolution of the IoT that improves the capabilities of VANETs in intelligence transport systems.This paper proposed the MADCR protocolin IoV to maximize the lifespan of networks and reduce the latency of the vehicles.The MADCR protocol involves cluster formation and CH selection.Euclidean distance is used to form the clusters in the network.The CH is then chosen using the MOA.Finally,the CH collects vehicle data and forwards them to the RSU.The RSU is connected to the Internet.The performance of the MADCR protocol is compared with that ofACO,CLPSO,and CAVDO.The proposed MADCR protocol increases the PDR by 5%–15%and decreases the latency by 5–100 ms.In our future work,we plan to implement the MADCR protocol in urban areas in real time.The performance of the MADCR protocol will also be compared with that of ACO,CLPSO,and CAVDO on the basis ofperformance metrics,i.e.,end-to-end delay and PDR.
ACKNOWLEDGEMENT
This work was supported by National Natural Science Foundation of China (No.61821001) and Science and Tech-nology Key Project of Guangdong Province,China(2019B010157001).
- China Communications的其它文章
- Joint Topology Construction and Power Adjustment for UAV Networks: A Deep Reinforcement Learning Based Approach
- V2I Based Environment Perception for Autonomous Vehicles at Intersections
- Machine Learning-Based Radio Access Technology Selection in the Internet of Moving Things
- A Joint Power and Bandwidth Allocation Method Based on Deep Reinforcement Learning for V2V Communications in 5G
- CSI Intelligent Feedback for Massive MIMO Systems in V2I Scenarios
- Better Platooning toward Autonomous Driving: Inter-Vehicle Communications with Directional Antenna

