Comprehensive Evaluation of Processing Quality of Tibetan Native Hulless Barley Variety by Factor Analysis
Jin Yu-long, Bai Ting, Zhang Yu-hong, Zhu Ming-xia, Zhang Zhi-wei, Wang Shan-shan, Liu Xiao-jiao, and Jia Fu-chen
Food Science Institute, Tibet Academy of Agricultural and Animal Husbandry Sciences, Lhasa 850000, China
Abstract: The purpose of this study was to explore the quality of the Tibetan native hulless barley variety in depth and to evaluate the characteristics of its processing quality using ratio analysis. For this study, 10 native barley varieties were chosen with the detection of 24 quality indexes in order to build a system of comprehensive evaluation. The results of the factor analysis indicated that seven common factors with an eigenvalue greater than 1 were extracted, cumulatively accounting for 96.21% of the total variance. The first common factor, including ASP, GLU, SER, GLY, ARG, TYR and CYS contents, accounted for 33.82% of the variance.The second common factor, including ash, the total starch, soluble fiber, VB3, Cu, Mn, Na and beta-glucan contents, accounted for 19.46% of the variance. The third common factor, including the total dietary fiber, α-VE, K, Zn and glutelin. The fourth common factor, including B,Ba and prolamin, explained the barley starch character of the rheological property. The fifth common factor included crude fiber. The sixth and the seventh common factors did not account for a substantial amount of variance. According to the comprehensive evaluation model, the score consequence was as the following: Zangqing25>Pengnaigabu>Lhasa changhei>2004Qing21>Lhasa duanbai>Liangamu>Zhikonggaxia>lianmubai>Jiangreejiu>Longzihei.
Key words: Tibetan hulless barley, process quality, comprehensive evaluation, factor analysis
Introduction
Barley is one of the oldest known domesticated crops,and it has played a significant role in the development of human civilization. Originally, it is cultivated for human consumption, and it has become more and more important over the millennia (Meintset al., 2016;Kishoreet al., 2016). Qing-Tibetan Plateau is one of the centers of origin of barley. It has tremendously rich barley germplasm resources, especially of the Tibetan hulless barley variety and the unique annual wild barley variety (Sunet al., 2013); Tibetan hulless barley is mainly cultivated in the valleys and in the higher lands of Tibet (Tashiet al., 2013). A recent survey revealed that barley occupied over 65% of the total food production in the Tibet region; studies on barley have confirmed that it has the potential to contribute soluble and insoluble dietary fibers, such as beta-glucan, to the diet and to reduce the influence of cholesterol absorption so as to prevent diseases, such as colon cancer and heart disease (Mcintoshet al., 1992;Kötenet al., 2013). Recently, beta-glucan and high starch content have become appealing characteristics to the food industry and are used commonly in poultry feeds (Jacob and Pescatore, 2014; Pourmohammadiet al., 2017). However, there has been few researches about the Tibetan native barley variety and its characteristics are unknown to researchers. Factor analysis was developed initially by Spearman around 1904(Spearman, 1904). It is a statistical technique that aims to reduce covariance among data; it is closely related to correlation analysis, which yields values between –1 and +1. The underlying theory of factor analysis is closely based upon covariances. There is a direct relationship between standard deviation (SD)and variance, so factor analysis may also draw an analogy with SD versus variance; hence, many factor analyses are in fact based upon analysis of covariances(Spearman, 2015). To obtain meaningful results, factor analysis requires uncorrelated data that do not cluster together. A correlation coefficient of <0.90 suggests that there is no clustering present. In the event of redundant (highly correlated) variables, these variables must be removed and replaced with a smaller number of uncorrelated variables. Some studies have focused on the method of principal component analysis (PCA)(Jian, 2017), which could reduce the original number of quality factors and replace them with new items(Idaet al., 2016). For this study, PCA was used to reduce the dimensionality and to aid the interpretation of the results of the survey. PCA uses an optimal linear dimension reducing technique as it extracts the maximum of the variability of the original variables,and they are uncorrelated. Eigenvalue variance was used to extract the number of principal components in this study. An eigenvalue illustrates the variance of the new factors that are successively extracted by PCA. The analysis also provides the proportion of the total variance in all the variables accounted for by each factor (Moonsamy and Singh, 2014). However,different quality factors which are closely related are relatively independent (Biet al., 2015). This experiment used 10 native barley varieties to analyze the following qualities: ash, crude fiber, the total starch, soluble fiber, the total dietary fiber,α-VE, VB3,B, Ba, Cu, Na, K, Mn, Zn, ASP, GLU, SER, GLY,ARG, TYR, CYS, prolamin, glutelin and beta-glucan.According to a comprehensive evaluation of the germplasm resources and nutrition qualities of these native barley varieties, and using the characteristics of a native barley variety in the high altitude of Tibet, it would provide the theoretical foundation for developing a new barley product which had characteristics.
Materials and Methods
Samples
The native barley varieties Zangqing25, Pengnaigabu,Lhasa changhei, 2004Qing21, Lhasa duanbai,Liangamu, Zhikonggaxia, lianmubai, Jiangreejiu,and Longzihei were provided by the Institute of Agricultural of Tibet Academy of Agricultural and Animal Husbandry Sciences.
Analytical determinations
The samples were pretreated using an analytical balance (TG328A, Shanghai Jicheng Instrument Co.,Ltd., China) and omnipotent disintegrator (LW100,TAISETE, China). The total starch content was measured by Automatic Polarimeter (WZZ-2; Shanghai Jincheng Instrument Co., Ltd., China), amino acids were measured by an amino acid analyzer (L-8900,Hitachi, Japan). The total dietary fiber and crude fiber content detection were carried out with a muffle furnace (YQK1600, Shanghai Yongting Experimental Instrument Co., Ltd., China). Vitamin B3content was measuredviahigh-performance liquid chromatography (Agilent1260, Agilent technology, China).Metal ions were measured using a microwave digestion system (MASTER, Shanghai Xinyi Microwave Chemical Technology Co., Ltd., China) and an atomic absorption spectrograph (1800H, Wuhan Tiantuo Weiye Technology Co., Ltd., China). Alcohol soluble protein and gluten contents were determined according to Baxter (2014), and beta-glucan content was determined according to Kim and Kim (2016).
Statistical analysis
Analysis of variance (ANOVA), factor analysis and correlational analysis of quality indexes of different native barley varieties were conducted using SPSS version 16.0 and Excel 2007. By factor analysis, principal components with an eigenvalue greater than 1 were extracted, taking the contribution rate of variance corresponding to each principal component as the weight, and a linear weighted sum of the principal component score and corresponding weight was used to construct the evaluation function of nutritive quality of the Tibet native barley varieties. The membership function method and factor analysis were used to make a comprehensive evaluation. Before the factor analysis, the membership function method was used to standardize the original data, calculated by the following formula (Tanget al., 2004; Sunet al., 2016):

S(in) meant that the original data of the indexiof theNth sample was converted into the membership function value;Xindenoted the original measurement of the indexi;XimaxandXimindenoted the maximum and minimum values of indexiin all the samples,respectively;Dwas a representative of synthesis score;Fmwas the common factor score ofm;Emwas the variance contribution rate ofm.
Results
Quality analysis
In the nutritional quality detection data of the native barley varieties obtained in Table 1, the range of variation coefficients was 4.27%-85.19%, which reflected a wide range in quality indexes among the varieties. The quality indexes all had variation of different degrees in the 10 native barley varieties. The greatest difference among the barley varieties was in the content ofα-VE, and the lowest difference was in the content of the total starch. The results illustrated that the samples obtained had large differences between each other. However, in regards to the processing of barley, considerable variation existed in the dietary fiber and starch content of the barley grains,which resulted in a tremendous amount of variation in digestible energy content (Oscarssonet al., 2016;Reynoldset al., 1992; Bowmanet al., 2001). There were also some universalities and representatives among the barley grains.

Table 1 Nutrient contents of nutrient elements of Tibet native barley cultivars
Correlation analysis
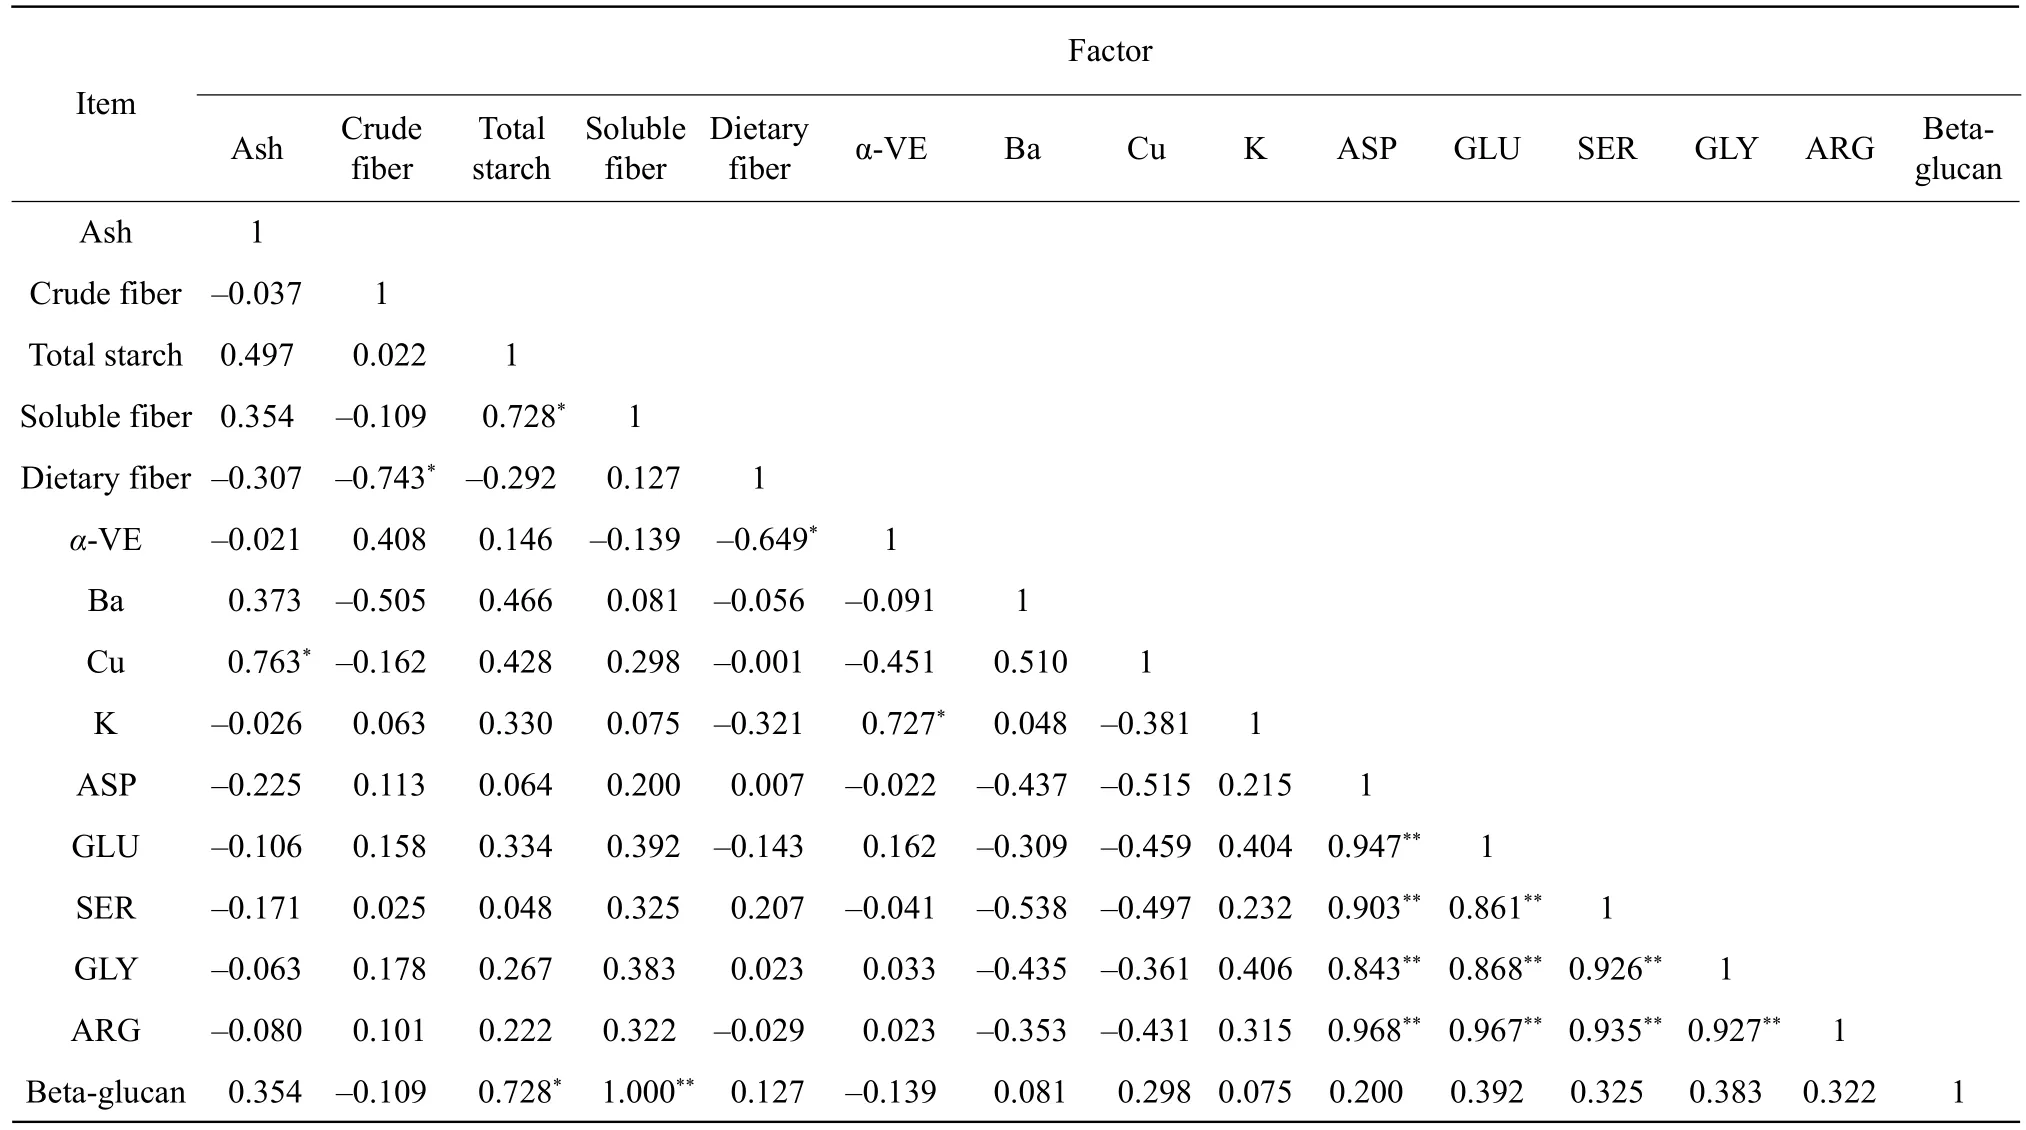
Currently, comprehensive quality analyses of native barley varieties in Tibet still were not reported in journals. This study employed the method of Pearson correlation analysis among each barley variety and used its binomial normal distribution to detect both sides of the confidence test. It was expected that the degree of information superposition would help to explain the strength of the correlation between the factors. At last,the results of the native barley quality factors (Table 2)showed the existence of both positive and negative correlations.
There were positive correlations between the total starch and beta-glucan and soluble fiber, between ash and Cu, and betweenα-VE and K. On the contrary, there were significant negative correlations between crude fiber and dietary fiber, betweenα-VE and the total dietary fiber, and between Cu and amino acid.

Table 2 Correlation analysis of barley quality indexes
Principal component analysis
Principal component analysis retained most of the information of the original indexes, but the two were not related. Table 3 showed that that seven common factors extracted from 24 indexes in the 10 native barley varieties expressed an eigenvalue greater than 1, cumulatively accounting for 96.21% of the total variance and thus explaining most of the information in the original indexes. The first common factor included ASP, GLU, SER, GLY, ARG, TYR and CYS,they also had a high load value, accounting for 33.82%of the variance. This factor might represent the main nutritional portion. The second common factor, which included ash, the total starch, soluble fiber, VB3, Cu,Mn, Na and beta-glucan, accounted for 19.46% of the variance. This factor could represent the maintenance of physiological functions portion. The third common factor included the total dietary fiber,α-VE, K, Zn and glutelin. The fourth common factor included B, Ba and prolamin, explained the processing properties of the barley starch. The fifth common factor included crude fiber. The sixth and the seventh common factors did not stand out above load value.

Table 3 Factor loading matrix of principal components of each quality index
Comprehensive evaluation
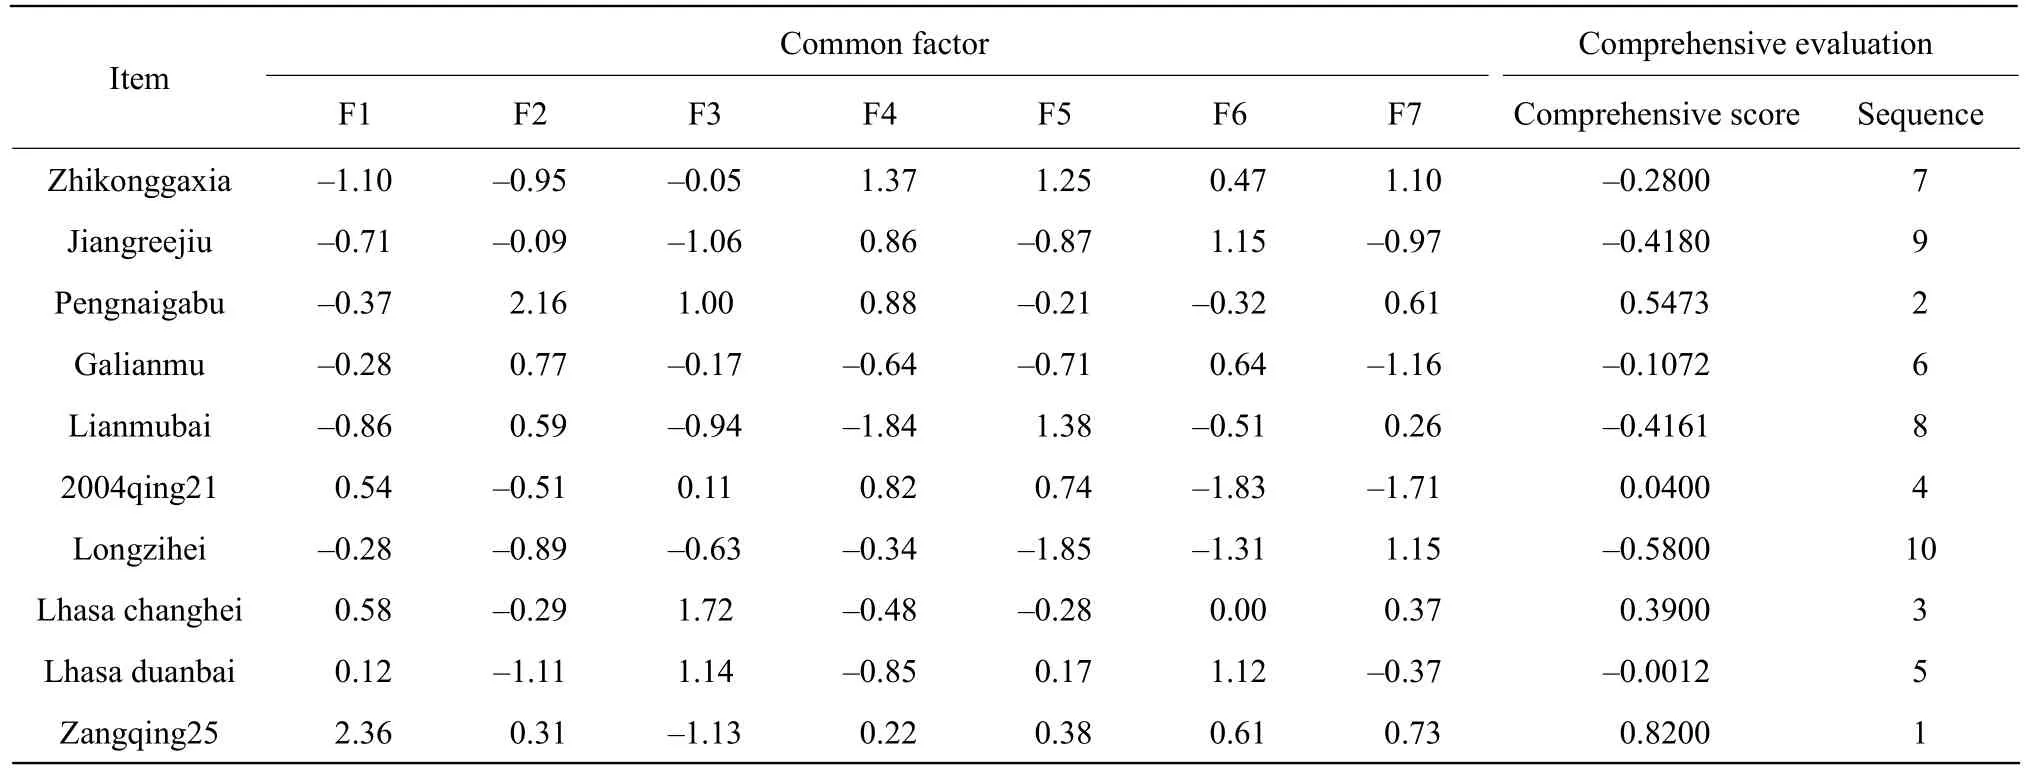
The original data were normalized using the membership function method of principal component analysis, with the average translated to 1 and the standard deviation to 0 which rendered the data dimensionless. The proportion of the eigenvalues corresponding to the seven principal components was extracted by accumulative contribution rate to the total eigenvalues, which were taken as the weight and then,the mathematical model for evaluating the nutritional quality of highland barley was established as the following:
F=0.35F1+0.2F2+0.17F3+0.09F4+0.08F5+0.06F6+0.05F7.
This model was used to calculate the final comprehensive quality score (Table 4). According to the model of comprehensive evaluation, the score consequence was as the following: Zangqing25>Peng naigabu>Lhasa changhei>2004Qing21>Lhasa duanbai>Liangamu>Zhikonggaxia>Lianmubai>Jiangreejiu>Longzihei.

Table 4 Common factor score, comprehensive score and superior degree ranking of native barley cultivars
Discussion
Tibetan native hulless barley was part of the Tibetan hulless barley, but was planted less and widely dispersed. It was mainly used as human and animal feed or malted for brewing and distilling by peasants.There were areas of Tibet where the native barley remained and had important spiritual, nutritional and cultural significance. With the increase in breeding of highland barley varieties, there were more reports about nutrients and utilization of highland barley(Meintset al., 2016; Al-Attabiet al., 2017; Kumariet al., 2018; Narwalet al., 2017). However, the nutrients of highland barley varieties in different regions were researched less. Recently, a number of excellent reviews on food barley had been published(Saidi, 2002; Nairet al., 2011). Although there were a few researches on the rural highland barley varieties and the degrees of development were low, it could be used as typical representatives.
According to data statistics, the quality, including physicochemical and nutritional indicators, varied significantly among different native barley varieties.To determine if one variable varied with another,correlation was used to examine the relationship between two variables. Correlation was used to determine the strength of a linear relationship between two variables. Correlation analysis found that the absolute value of the correlation coefficient between only a few indexes was greater than 0.5, indicating that the correlation between indicators was not very strong.There was no need to eliminate repeated information between the evaluation indexes in the comprehensive evaluation (Weaveret al., 2017). The coefficient of variation, denoted ass/M, was often used to compare two standard deviations when their means differed substantially; this parameter had high credibility (Pons,2013). The index of nutritional quality showed a large range (4.27%-85.19%) of variation coefficients,indicating that there was a big difference among the native varieties. Selection of evaluation factors was the basis of comprehensive quality evaluation (Fayers and Machin, 2015). Factor analysis was a statistical technique aimed at data reduction and it was decisive for the evaluation effect (Moonsamy and Singh, 2014).In this experiment, there were many quality indexes of highland barley varieties, which were both independent and correlated, and most had both objective and subjective quality characteristics (Andreiet al., 2017).
The objective of the principal component analysis was to reduce the original number of quality factors and to replace them with new items, called principal components. These components included information about the original factors with minimal loss of information (Vajčnerováet al., 2016; Moonsamy and Singh, 2014).
In this experiment, the nutritional quality scores of the Tibet native barley variety were compared with those of popular varieties to analyze whether it had superior nutrients. However, the problem of insufficient collection of highland barley resources still existed, and it was necessary to further collect resources for researches and analyses of nutritional qualities to further improve the researches and developments of Tibetan native barley resources.Lastly, the results of the descriptive statistics of native barley could provide basic information for further investigation of different barley cultivars.
Conclusions
According to the comprehensive evaluation model,the score consequence was as the following: Zangqing 25>Pengnaigabu>Lhasa changhei>2004Qing21>Lhasa duanbai>Liangamu>Zhikonggaxia>Lianmubai>Jiang reejiu>Longzihei. This sequence showed a difference in quality of native barley varieties. Zangqing25 ranked the first in comprehensive score, which was the region promoting variety used for processing; Longzihei had the lowest score, although its planting area was expanding more than others. According to this study,Pengnaigabu variety, which ranked the second in score, should be taken into account. It was also found that ASP, GLU, SER, GLY, ARG, TYR and CYS had high load values and could reflect the quality of the barley. The second component factor included ash,the total starch, soluble fiber, VB3, Cu, Mn, Na and beta-glucan, and it could reflect the quality from the perspective of functional nutrition indicators. Qinghai-Tibet Plateau was rich in highland barley resources and utilization should be intensified. In order to make full use of its existing native barley varieties, quality analysis was the most direct, broad and cost-savings way, especially for those native barley varieties cultivated for a long time in this frigid region.
 Journal of Northeast Agricultural University(English Edition)2021年2期
- Journal of Northeast Agricultural University(English Edition)的其它文章
- Wild-type MIC Distribution and Epidemiological Cut-off Value and Resistant Characteristics of Colistin Against Escherichia Coli from Chickens
- Quercetin Increased Protein Utilization and Decreased Nitrogen Excretion in Broilers by Activating TOR Signaling Pathway
- Effects of Altitude Change on Nutritional Quality and Elymus nutans Regularity in Qinghai-Tibet Plateau
- Comparative Analysis of Bacillus thuringiensis Vip3Aa57 and Vip3Aa62 Insecticidal Activities
- Effects of Interaction of Soil Moisture and Organic Matter on Powdery Mildew Disease and Growth of Heracleum moellendorffii Hance
- Index Design and Comprehensive Evaluation of Germplasm Resources of Fruits Based on Mathematical Model of AHP and FCE: Sterculia nobilis Smith as a Case
