Modelling ignition probability with pairwise mixing-reaction model for flame particle tracking
Qing XIE, Zhuyin REN,b,*, Ke WANG
a School of Aerospace Engineering, Tsinghua University, Beijing 100084, China b Institute for Aero Engine, Tsinghua University, Beijing 100084, China
c Aero Engine Academy of China, Beijing 101300, China
KEYWORDS Bluff-body stabilized flame;Igniting process;Ignition probability;Lagrangian particle tracking;Pairwise mixing-reaction
Abstract Reduced order models for ignition analysis can offer insights into ignition processes and facilitate the combustor optimization. In this study, a Pairwise Mixing-Reaction (PMR) model is formulated to model the interaction between the flame particle and the surrounding cell mixture during Lagrangian flame particle tracking. Specifically, the model accounts for the two-way coupling of mass and energy between the flame particle and the surrounding shell layer by modelling the corresponding turbulent mixing,chemical reaction and evaporation process if present.The state of a flame particle,e.g.,burnt,hot gas or extinguished,is determined based on particle temperature.This model can properly describe the ignition process with a spark kernel being initiated in a nonflammable region,which is of practical importance in certain turbine engines and has not been rigorously accounted for by the existing models based on the estimation of local Karlovitz number.The model is integrated into an ignition probability analysis platform and is demonstrated for a methane/air bluff-body flame with the flow and fuel/air mixing characteristics being extracted from a non-reacting simulation. The results show that for the spark location being at the extreme fuellean outer shear layer of the recirculation zone, PMR can yield ignition events with a significant number of active flame particles. The mechanisms for the survival of the initial flame particles and the entrainment of the survived flame particles into the recirculation zone are analyzed. The results also show that the ignition probability map from PMR agrees well with the experimental observation: a high ignition probability in the shear layer of the recirculation zone near the mean stoichiometric surface,and low ignition probabilities inside the recirculation zone and the top stagnation region of the recirculation zone.The parametric study shows that the predicted shape of the ignition progress factor and ignition probability is in general insensitive to the model parameters and the model is adequate for quantifying the regions with high ignition probabilities.
1. Introduction
The most common approach to initiate combustion in ground power gas turbines and aero-engines is forced ignition, during which an external source of thermal energy or radical species is introduced.1A successful forced ignition in general involves the processes of energy deposition,formation of a viable flame kernel, flame kernel growth, flame propagation and stabilization. Practical considerations and emission regulations can lead to difficulty in ensuring reliable combustion initiation under all operating conditions for such devices. For example,lean mixtures,which are found in many low NOxemission systems where igniters are located away from fueled regions, are less reactive, and therefore more difficult to ignite.2In addition, the probabilistic nature of successful initiation of a selfsustaining flame must also be considered for understanding forced ignition in real devices.3Various factors can affect the development of spark kernels from the moment of energy deposition until the complete flame establishment. The most favorable ignition spots are influenced not only by local equivalence ratio, but also by the time history of the flame kernel.Detailed comprehension of the ignition process is desirable for the development of reliable and efficient ignition prediction methods. Fast and reliable prediction of the ignition performance can reduce the design cycle and cost of ground power gas turbines and aero-engines.
Computational modeling of the ignition process can provide insights into the controlling physical processes for the success of an ignition attempt. This is especially true if the model is validated against experimental observations.4,5Unsteady three-dimensional simulations, especially Large Eddy Simulations (LES) are promising to shed lights on the transient ignition process. Simulations have been performed to explore various aspects of the behavior of flame kernels and the subsequent flame evolution with gaseous fuels6,7and liquid fuels.8,9For example, large eddy simulations have been performed to study the transient ignition process in laboratory flames such as methane/air bluff-body flames10and jet flames.11The ignition sequence has been studied in a full annular combustion chamber of gas turbine by means of massively parallel LES.12However, LES is very expensive if the ignition probability is to be calculated for every possible spark location.
Reduced-Order Models (ROM) in contrast have been developed for fast prediction of ignition probability in practical engine combustors, in conjunction with the information from non-reacting flow simulations. For example, a cellular automation concept has been developed13to represent the propagation of a flame kernel based on inputs from either Reynolds-Averaged Navier-Stokes (RANS) or averaged large-eddy simulations, and it has been applied to predict ignition probability in a partially premixed recirculating flame13-15and a premixed flow.16All these works addressed the likelihood that a flame will propagate based on the initiation site of an ignition kernel for specific combustor geometry.More recently, a forced ignition probability analysis method15has been developed to account for the kernel formation processes involved. Kernel formation and growth are analyzed with one-dimensional turbulent spherical flame model,to form the criterion of turbulent flammability.Flame propagation and stabilization are simulated with Lagrangian flame particle tracking throughout the flow domain. The effect of turbulent transport on the flammability limits is accounted for through the incorporation of zone-dependent turbulence-induced diffusion in a spherical flame kernel model. The integration of the above two-step analysis with non-reacting CFD simulations is achieved through a general interpolation interface suitable for general unstructured CFD grids.
Currently, for Lagrangian flame particle tracking,the local Karlovitz number is often computed to estimate the local intensity of turbulence-chemistry interaction. Then it is employed to determine the fate of the flame particle,e.g.,burnt or extinguished, and to determine if the flame particles can ignite the regions that they pass through.However,flame particle tracking with the Karlovitz criterion cannot describe the ignition process through a spark kernel initiated in a nonflammable region, which is of practical importance in certain turbine engines. Successful start in these engines is contingent on three steps.First,a high-energy gas kernel is deposited in a non-fueled or ultralean gas(e.g.,near a wall or liner).Second,the developing kernel must move to a location where it can interact and consume a combustible mixture to produce net volumetric heat release and grow,e.g.,through flame propagation. Finally, the developed flame kernel must propagate toward a region where the localized conditions can stabilize a flame.
This study focuses on the development of a reduced-order model to describe the evolution of particle composition resulting from the processes of turbulent mixing, finite rate chemistry, and droplet evaporation during flame particle tracking.Specifically, a pairwise mixing-reaction model is formulated to model the two-way coupling of mass and energy between the flame particle and the surrounding cell mixture. The state of a flame particle,e.g.,burnt,hot gas or extinguished,is determined based on particle temperature,instead of the local Karlovitz number. This model is integrated into the recently developed forced ignition probability analysis method15and is employed to investigate the ignition process in a methane/air bluff-body flame.
2. Methodology
In the following, Lagrangian particle tracking with local Karlovitz criterion for extinction is briefly reviewed. The Pairwise Mixing-Reaction (PMR) model is then introduced, which is followed by a detailed description of the procedures for ignition probability prediction with PMR.
2.1. Lagrangian flame particle tracking
With flame particle tracking for analyzing the flame propagation and stabilization process after successful kernel formation,particles are tracked with the flow and fuel/air mixing fields being interpolated from a non-reacting CFD simulation. The evolution of flame particle location and velocities is given by

where Xp,iis the flame particle location, Up,iis the particle velocity in direction i,is the local mean velocity of the flow,Np,iis a normally distributed variable (with mean zero and variance unity), ωpis turbulence frequency and is related to turbulent kinetic energy kpand dissipate rate εpat the particle location through ωp=εp/kp, and C0is the model constant taken to be 2.0. Note that the velocity follows the simplified Langevin model consisting of a linear drift towards the local mean velocity and an added isotropic diffusion term.The random variable Np,iis different for each particle. As pointed out,13a flame particle can represent a flame element if the flame propagation by molecular diffusion is small compared to turbulent dispersion, and neglecting propagation relative to the fluid for the movement of the flame particle is valid if the flame propagation speed is much smaller than the turbulent fluctuating velocity.
With the local Karlovitz number being employed as the extinction criterion,during particle tracking,the flame particle exchanges the mass with the local cell through spark kernel created in a nonflammable region to a selfsustaining flame.
2.2. Pairwise mixing-reaction model
As sketched in Fig. 1, during flame particle tracking, at any given time, a flame particle consisting of gaseous mixture is assumed to be encapsulated by the mixture of the CFD cell in which it is located. A shell layer is formed during the twoway coupling of mass and energy between the flame particle and the surrounding mixture.Let φfbe the flame particle composition consisting of the nsspecies mass fractions and mixture sensible enthalpy, i.e. φf= (Y1,Y2,···,Yns,hs), φsbe the gaseous composition of the surrounding shell layer, and φcbe the gaseous composition of the CFD cell. For spray combustion, liquid droplets are present in the shell layer and cell,which may evaporate due to the energy transfer from the hot flame particle that passes through.
With the depicted three-layer structure, the pairwise mixing-reaction model accounts for the two-way coupling of mass and energy between the flame particle and the surrounding shell layer by modelling the processes of turbulent mixing,chemical reaction and evaporation process (if present). The interaction between the shell mixture and cell mixture is not modelled considering that the temperature gradient between these two layers is not significant.The initial shell layer composition is assumed to be those of the cell composition. Over a characteristic coupling time τcp, the flame particle exchanges the mass with the surrounding shell mixture through

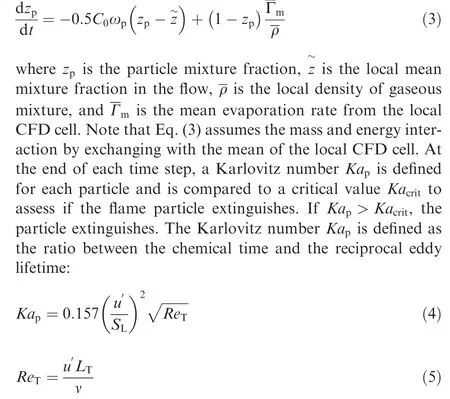
where ν is the mixture kinematic viscosity, LTand u′are the turbulence integral length and turbulent fluctuating velocity at the particle location,respectively,and SLis the local laminar flame speed. This extinction criterion by Karlovitz number depends on the estimation of laminar flame speed, which is questionable if the particle is a non-fueled or ultralean gas yet hot. Lagrangian flame particle tracking with local Karlovitz criterion cannot physically describe the transition of a
where ˙ωfand ˙ωsare the rates of change for the flame particle φfand the gaseous shell mixture φsdue to chemical reactions,respectively,τmixin the pairwise mixing terms is the scalar mixing timescale and is related to turbulent timescale τturb=k/ε through τmix=τturb/Cφ, where k and ε are turbulent kinetic energy and dissipate rate respectively, and Cφis the mixing constant,and C is the evaporation source if liquid phase is present.Following the two-phase coupling in previous work,17the evaporation source can be calculated with evaporation models such as the Abramzon-Sirignano model18based on the Lagrangian droplets information together with the mean gas phase properties interpolated on the droplet position.The necessary information can be extracted from the non-reacting CFD simulation together with the information of liquid phase from Discrete Phase Model(DPM).The vaporization source is only nonzero for the fuel species for single component liquid.
With the pairwise mixing-reaction model, the effects of finite rate chemistry on the interaction between flame particle and the surrounding shell mixture can be directly accounted for. During its evolution, a flame particle could evolve among the states of burnt, hot gas and extinguished defined based on its temperature. In contrast to the Karlovitz criterion, the PMR model can describe the transition of a spark kernel created in a nonflammable region to a self-sustaining flame,since all the important physiochemical processes are properly accounted for during flame particle tracking.
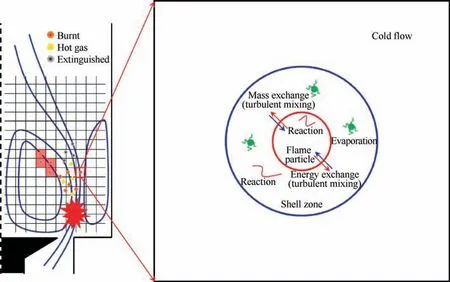
Fig. 1 Schematic for pairwise mixing-reaction model.
For efficient solution of Eqs. (6) and (7), splitting schemes19,20are employed,which split the governing equations into the mixing, evaporation and chemical reaction substeps.For example, with first-order temporal accuracy, the properties of flame particle and the shell mixture evolve over the characteristic coupling time τcpthrough the first half timestep of mixing, the full time step of evaporation and the other half timestep of mixing, followed by the full time step of chemical reaction.In this sequence of substeps,for the mixing fractional substeps, the analytical solution is given by
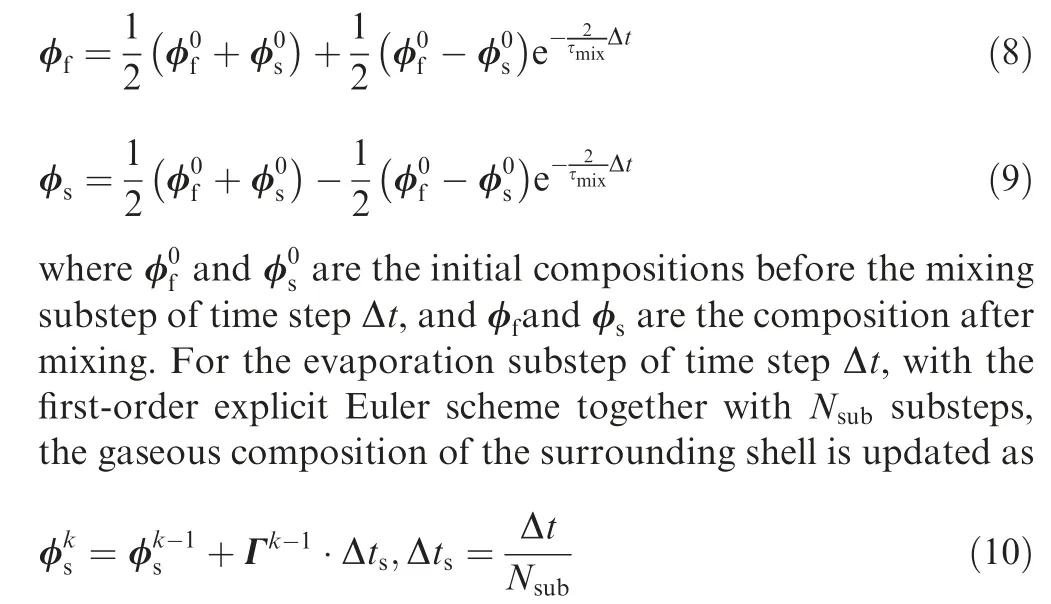
where the properties such as gaseous temperature needed for computing evaporation source are updated after each substep.The governing equations for reaction substeps are stiff Ordinary Differential Equations(ODEs),which are integrated with the solver DASAC21and further accelerated with in situ adaptive tabulation22,23. A second-order temporal accurate scheme can be achieved through a more sophisticated splitting scheme such as 1/4 mixing-1/2 evaporation-1/4 mixing-1/2 reaction,followed by repeating the above sequence.
2.3. Ignition probability prediction
The integration of the ignition probability analysis with nonreacting CFD is achieved through a general interpolation interface,which is based on the binary data format of Tecplot 360 that admits generic structured and unstructured cells.First, the original unstructured data from non-reacting CFD results are tabulated node by node using k-dimensional tree.Then,the data are interpolated to the user-specified structured cells.For a general flow configuration,the user-specified structured mesh is allowed to cover both the flow region and the region occupied by irregularly shaped solid parts of the combustor. One only needs to specify the spatial ranges and resolutions of the Cartesian coordinates of the tracking domain.The cells that locate outside the flow region will be tagged and flame particles that enter these cells will no longer be tracked.
For particle tracking procedures, all the boundaries of the user-specified structured mesh are set to be ‘‘escape”, regardless of the physical boundary conditions.That is,once a flame particle moves out of the tracking domain, it is no longer tracked. To monitor how much volume of the combustor is ignited,the ratio of the number of burnt cells to the total number of cells in a prescribed domain of interest is calculated at each time step during the particle tracking process. This ratio is termed as the Ignition Progress Factor (IPF). In this study,the cells in the domain of interest are tagged according to local velocity magnitude (<5 m/s) and mixture fraction (>0.01),covering the central recirculation zone and the stoichiometric region. In the implementation, the flame particles are initially released from the ignition region. Their mixture fractions are drawn from a beta distribution given the mean and variance of the mixture fraction being extracted from the local cell,and their velocities are initialized from Gaussian distributions given the mean velocities and with fluctuation velocities being extracted from the local cells. Once the flame particles are released from the ignition region, the flame particles are tracked through the following procedures:
Step 1. The cells in the structured grid have one of two states:unburnt and burnt.Initially,all cells are in the unburnt state. Each grid cell that overlaps with the spark volume releases a ‘‘flame particle’’. The initial compositions and temperature of flame particles are obtained through chemical equilibrium calculations using the local random mixture fractions and user-specified ignition energy.The flame particle is labeled as burnt or hot gas according to its temperature.
Step 2.A flame particle is tracked using the Langevin model Eqs. (1) and (2), with the necessary CFD flow and fuel/air information being interpolated to the particle location. The position and velocity of particles are updated via Eqs. (1)and (2) respectively, and the flame particle composition is updated via Eq. (3) for the Karlovitz criterion and Eq. (6)for the PMR model. During its evolution, a flame particle could evolve among the states of burnt, hot gas and extinguished. When a particle extinguishes, it is no longer tracked.Compared to the local Karlovitz criterion, the PMR model with the additional hot gas state can describe the ignition event that a spark kernel created in a nonflammable region initiates a self-sustaining flame.
Step 3.Every time a particle visits a grid cell in an unburnt state, if the particle temperature following the evolution governed by PMR stays beyond the prescribed threshold, and the local cold flow mixture fraction is within the flammability limits, the grid cell switches to the burnt state and a new particle, with its own random velocity and mixture fraction being sampled from the local velocity and mixture fraction distributions,emits at the cell center and follows its own random walk.The flammability limits can be influenced by turbulence,which has been studied in previous work15using one-dimensional simulations of spherical flames. Fig. 2 shows the flammability limits (in equivalence ratio, φ) of methane/air mixture under various turbulent fluctuation velocities, u′and at standard atmosphere p=101325 Pa.The simulated lean and rich limits for the laminar cases, in equivalence ratio, are around φlean=0.5 and φrich=1.6, or in mixture fractions ξlean=0.0283 and ξrich=0.0853, which are close to the reported values10of 0.028 and 0.089. The effects of turbulent transport on the flammability limits can be parameterized by two straight lines on the φ-u′plane.
Step 4. For each ignition simulation process, with all the active flame particles being tracked, the status of cells, e.g.,burnt and unburnt, can be summarized. The IPF,πign, defined as the fraction of cells in burnt state for a prescribed domain of interest,can be obtained to represent the likelihood of successful ignition. If the IPF is larger than a critical threshold IPF πcrit, the ignition event is declared to be successful.
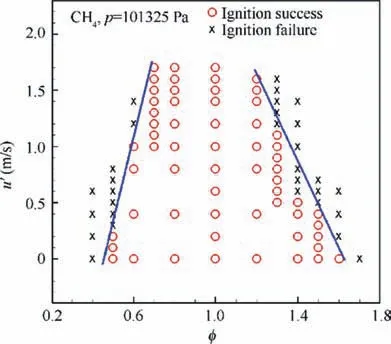
Fig.2 Simulated ignition events of one-dimensional methane/air spherical flames.15
Step 5. For each spark location, many repetitions of flame particle tracking with different realizations are performed to obtain the successful ignition probability.In this study,60 repetitions for each spark location are performed. By repeating the process for different spark locations, maps of mean and variance of ignition progress factor and ignition probability can be obtained.
3. Results and discussion
The pairwise mixing reaction model is demonstrated for the analysis of ignition probability in a methane/air bluff-body flame, and the results of RANS simulation are illustrated in Fig. 3. The flow configuration and computational mesh is sketched in Fig. 3(a). The fuel injection velocity is 5 m/s and the bulk velocity of the air stream at the exit of the bluffbody is 10 m/s. The flow conditions are the same as the Case B in experiment.10The steady state flow and mixing fields are obtained with the two-equation standard k-ε turbulence model and the partially premixed combustion model with chemical reactions being turned off. Specifically, the transport equations for mixture fraction and its variance are solved to compute the fuel/air mixing fields. The grid is refined in the recirculation zone with a resolution of 1 mm to ensure numerical convergence. Fig. 3(c) shows the predicted mean mixture fraction (cut below 0.01), with the ignition kernels: P-I at(16, 3) mm, and P-II at (16.5, 3) mm marked by circles. And the boundary of the domain of interest that helps define IPF is sketched by the dashed line.The mean and variance of mixture fraction are used, in conjunction with the beta PDF, to generate the realizations of flame particle compositions.These realizations are used to calculate the formation probability of ignition kernel.15
Fig.3(b)shows the predicted contours of mean axial velocity U and Turbulent Kinetic Energy(TKE), and the recirculation zone is indicated by the solid streamlines. As shown, the downstream stagnation point is located at the axial position of 24.8 mm. The kinetic energy is large in both shear layer and recirculation zone indicating strong turbulent fluctuations,especially around the downstream stagnation point. Fig. 3(c)and (d) show the predicted contours of mean mixture fraction and Karlovitz number respectively,with the stoichiometric isosurface indicated by the dash-dot line.The potential favorable region for turbulent flame propagation is indicated by the low Karlovitz number shown as the dark region in Fig. 3(d).
3.1. Representative ignition process
Flame particle tracking from two representative locations is used to analyze the flame propagation process after successful kernel formation.The spark kernels P-I and P-II are drawn to scale with the diameter of 3 mm in Fig.3(c).Both are near the shear layer and outside the recirculation zone, and are in the fuel lean region. The simulated maximum mean mixture fraction is 0.025 with a variance of 0.007 in the region occupied by spark kernel P-I. And P-II is slightly further away from the stoichiometric region with a maximum mean mixture fraction of 0.005 and is beyond the flammability limits.For PMR,the ignition energy Eigninput to spark kernel with the size of 3 mm is 0.2 J as indicated by experiment10,which increases the temperature of initial flame particles to around 2400 K.
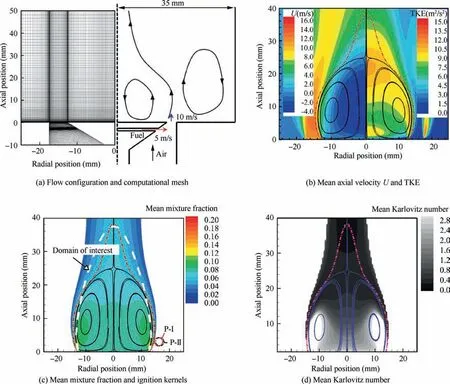
Fig. 3 Methane/air bluff-body flame and results of RANS simulation.
3.1.1. Effect of turbulence-chemistry interaction on ignition process
With PMR,the effect of finite rate chemistry on the interaction between flame particle and the surrounding shell mixture is directly accounted for. During its evolution, a flame particle could evolve among the states of burnt, hot gas and extinguished defined based on its temperature. Particles with temperature above the given ignition temperature Tignare defined as burnt. Those with temperatures being below given extinguish temperature Textare extinguished. Those with temperatures being between Tignand Textare denoted as hot gas.In the following,the ignition process from the two representative spark locations P-I and P-II are investigated to demonstrate the effect of finite rate chemistry and Turbulence Chemistry Interaction (TCI) on the ignition process.
Fig. 4 shows the time evolution of the number of active flame particles Nactivefrom all 60 spark ignition events at P-I(16.0, 3.0) mm and P-II (16.5, 3.0) mm. The first row shows the results that the extinction criterion is based on Karlovitz number (Ka), and with model parameter as Kacrit=1.0. The second row shows the results that the extinction criterion is based on PMR, and with model parameters as Cφ=2.0,Tign=1500 K, and Text=800 K. For a successful ignition event,Nactivefirst increases as more cells are ignited and release more flame particles,and then Nactivedecreases to zero as flame particles extinguish or move out of tracking domain(see Fig.4(a) and (c)). The maximum number of active particles are bounded by the number of flammable CFD cells,since one cell only allows to release one new flame particle.As shown,when the ignition location moves further away from the recirculation zone e.g.,at P-II,the mixtures get leaner and both models predict few events with significant number of active particles (see Fig. 4(b) and (d)). When the spark location gets closer to the stoichiometric region,e.g.,at P-I,PMR yields more successful ignition events with significant larger number of active particles (see Fig. 4(c)), compared to the Karlovitz criterion (see Fig. 4(a)).
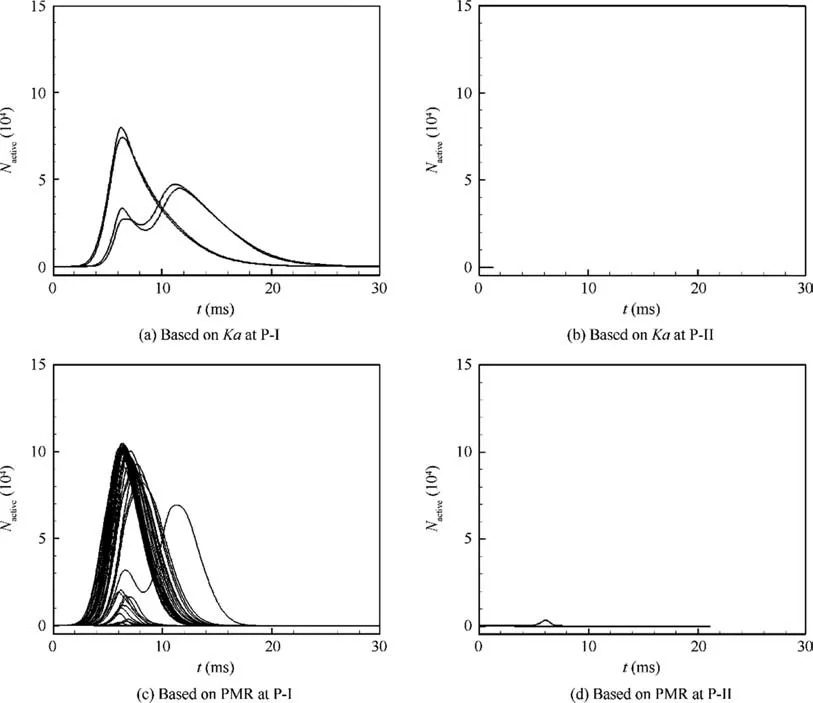
Fig.4 Evolution of total number of active particles from 60 individual spark events at P-I and P-II(the simulations are based on laminar flammability limits (in mixture fraction): (0.023, 0.089)).
For the flame considered, the two important mechanisms for the successful ignition events from fuel lean locations are(A) the survival of the initial flame particles and (B) the entrainment of the survived flame particles into the recirculation zone. Note that the second mechanism is governed by the flow and turbulence characteristics from the non-reacting flow simulations of flow and turbulence, which are the same for the Karlovitz criterion-based and PMR models during flame particle tracking. However, the underlying mechanism for the survival of flame particles is quite different. With Karlovitz criterion, it is mainly due to the initial particle mixture fraction being within the flammability limits. Note that initial mixture is drawn from a beta distribution given the mean and variance of the mixture fraction being extracted from the local CFD cell.Even though the mean mixture fraction is out of the lean flammability, considering the variance, some individual samples could still be within the flammability limits,thus leading to few successful ignition events(see Fig.4(a)).In contrast,for PMR, the state of flame particle is determined based on particle temperature instead of the flammability criterion for mixture fraction. This allows the possibility of a flame kernel,hot but out of the flammability limits, moving to a location where it can interact and consume a combustible mixture to produce net volumetric heat release, grow, and finally lead to successful ignition.With enough ignition energy input,the particles with PMR are more likely to survive in the fuel lean region,thus leading to more successful ignition events as illustrated in Fig. 4(c).
For PMR, the temperature evolution of a flame particle is governed by turbulent mixing with cold surrounding mixture and heat release from chemical reactions.For the ignition events from fuel lean locations,heat release from chemical reaction is not significant during the early stage and the survival of initial particles is mainly determined by turbulent mixing.The state of the flame particles and the ignition process are affected by the model parameters such as the specified ignition and extinction temperatures Tignand Textand mixing constant Cφ.The evolution of Nactive, from spark location P-II, under different model parameters are compared in Fig. 5. As shown, with Tign=1500 K,all the ignition events fail,since the temperatures of initial particles drop below Tignbefore they enter the recirculation zone igniting more cells.With a lower Tignof 1200 K,more successful ignition events are observed, as shown in Fig. 5(b).This indicates that many flame particles successfully enter the recirculation region from the fuel lean ignition location and ignitecellmixtures.Inaddition,asshowninFig.5(c),slowermixingratewithCφ=1.0canslowdownthedropinparticletemperatures,and therefore increase the likelihood for the survival of initial particles and lead to more successful ignition events.
3.1.2. Analysis of ignition pathway

Fig. 5 Evolution of total number of active particles from 60 individual spark events at spark location P-II from PMR model with different model parameters.
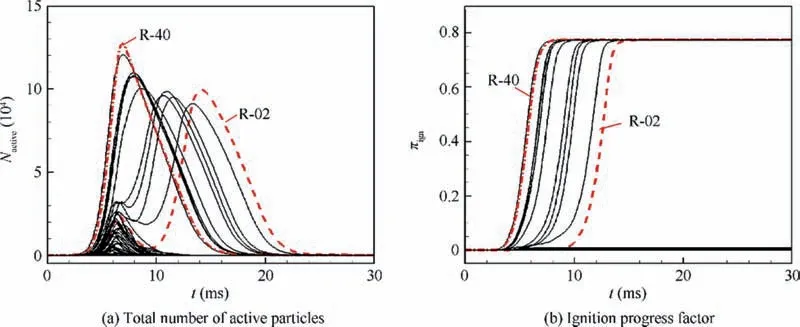
Fig. 6 Evolution of Nactive and πign from 60 individual spark events at spark location P-II based on PMR model with Tign =1500 K,Text=800 K, and Cφ =1.0.
The identification of the ignition pathways is crucial for revealing the underlying key physiochemical processes that could promote or inhibit the ignition process. The knowledge could also provide insights for further improvement of the ignition prediction models. Fig. 6 shows the time evolution of Nactiveand πignfor all spark events at spark location P-II.The evolution processes of the 2nd and 40th spark events are marked by dashed and dash-dot lines respectively.It can be seen from πignin Fig. 6(b) that the 2nd and 40th spark events represent the slowest and fastest ignition processes respectively. The slow ignition process shows two peaks of Nactivewhile the fast process shows only one peak as shown in Fig. 6(a).
The evolution of particles and cell states for these two spark events are displayed in Fig.7.For both the slow and fast ignition processes,the particles first move along with the provided cold flow field, towards the axis of the combustion chamber(Fig. 7(a), t=0-3.5 ms). For slow ignition process, the particles first ignite the downstream region on the axis (Fig. 7(a),t=10 ms), and then propagate upstream into the recirculation zone (Fig. 7(a), t=10-14 ms). The first peak of Nactivein Fig. 6(a)corresponds to the ignition of downstream region,while the second peak corresponds to the ignition of recirculation zone. In contrast, for fast ignition process, the particles enter the recirculation zone before they reach the downstream region on the axis (Fig. 7(b), t=3.5 ms), and then propagate both upstream and downstream igniting both regions simultaneously (Fig. 7(b), t=4.5 ms). Thus the fast ignition process shows only one peak in Fig. 6(a). The differences of ignition pathway between fast and slow ignition process are mainly due to the effects of turbulence on particle fluctuation velocity and turbulent mixing process.
3.2. Ignition probability map
3.2.1. Model comparison: Karlovitz criterion vs PMR
For the methane/air bluff-body flame, the ignition processes are simulated at various spark locations with multiple ignition events at each location. The mean of πignand ignition probability Pignare calculated for each spark location. It is worth mentioning that the computed ignition probability depends on the domain of interest, model parameters and the critical threshold πcrit. Instead of quantitative comparison,it is more meaningful to compare the shapes of ignition probabilities from the models and the experiment. Fig. 8 shows the representative results from the two models under turbulent flammability limits. The model parameters for Karlovitz criterion are Kacrit=1.0 and πcrit=0.12 and those for PMR are Cφ=2.0, Tign=1500 K, Text=1200 K, and πcrit=0.06.As shown, the two ignition probability maps are qualitatively similar. More importantly, the distribution of high ignition probability is quite close to that of the experiment,10showing great improvement compared to previous work.13,15In comparison with the experimental observation,10a high ignition probability in the shear layer of the recirculation zone near the mean stoichiometric surface is reasonably predicted. In addition, low ignition probabilities inside the recirculation zone and the top stagnation region of the recirculation zone are also well captured. Note that the prediction with the Karlovitz criterion is also greatly improved compared to those in Refs.13,15
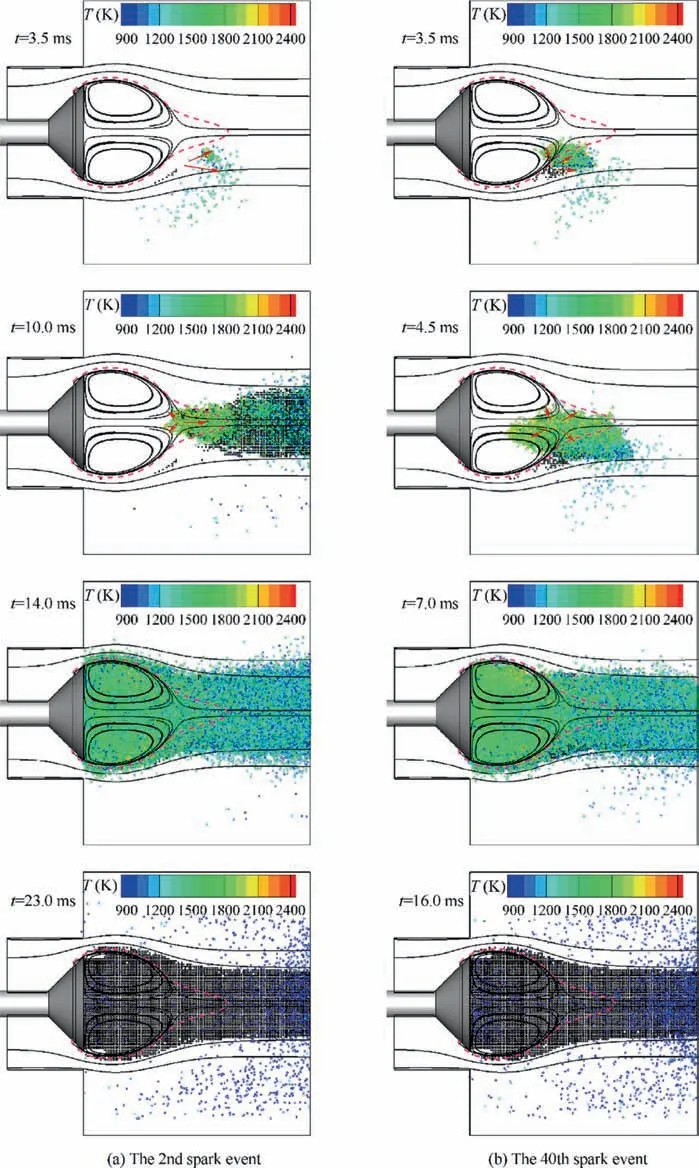
Fig. 7 Evolution of particles and cell states for the 2nd spark event and the 40th spark event at spark location P-II (burnt cells are colored by dark circles,the particles are colored with their temperature,and the dashed line shows the iso-line of the stoichiometric mean mixture fraction).
3.2.2. Effects of TCI: Mixing rate and finite reaction rate
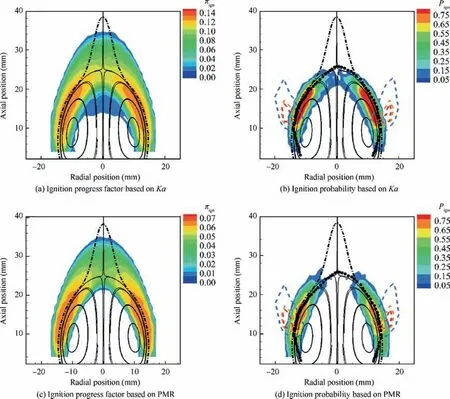
Fig. 8 Predicted ignition progress factor πign and ignition probability map Pign using Karlovitz criterion and PMR respectively (the simulations are performed with turbulent flammability limits: φlean=0.6 and φrich =1.3 at u′ =1.6 m/s. In the plots of Pign, the black symbols represent the stoichiometric line in experiment;10 the dashed lines mark the region of high ignition probability in experiment10).

Fig. 9 Effects of Cφ on ignition progress factor for PMR (the other model parameters are Eign =0.2 J, Tign=1500 K, Text=1200 K,φlean=0.6 and φrich =1.3 at u′ =1.6 m/s).
With the PMR model, the coupling between finite rate chemical kinetics and turbulent mixing during flame particle tracking is accounted for. To investigate the effects of finite rate chemistry and turbulent mixing on the ignition probability,sensitivities to mixing constant Cφand the overall reaction rate are performed. Fig. 9 shows the change of the predicted ignition progress factor with increasing Cφfrom 1 to 3. It shows that the shape of the predicted ignition progress factor remains in general similar although its magnitude decreases with increasing Cφ. The reduction is due to the decreasing Da=τturb/τcCφwith increasing Cφ, where Da represents the ratio of mixing timescale τmix=τturb/Cφto reaction timescale τc. The dependency on reaction rate is weaker as shown in Fig. 10. For the cases considered, with the given mechanism,the predicted ignition progress factor remains almost unchanged when the overall reaction rates are increased by a factor of two or reduced by half.

Fig. 10 Effects of reaction rates on ignition progress factor for PMR (the model parameters are Cφ =2.0, Eign=0.2 J,Tign =1500 K,Text=1200 K, φlean=0.6 and φrich =1.3 at u′ =1.6 m/s).
It is worth mentioning that the predicted shape of the ignition progress factor is in general insensitive to the model parameters and the PMR model is adequate for quantifying the regions with high ignition probability.
4. Conclusions
In this paper,a pairwise mixing-reaction model is developed to model the interaction between the flame particle and the surrounding mixture during flame particle tracking. The model accounts for the effects of turbulent mixing and finite rate chemistry on the evolution of flame particles and it allows the possibility of a flame kernel,hot but out of the flammability limits, moving to a location where it can interact and consume a combustible mixture to produce net volumetric heat release, grow, and finally lead to successful ignition.
The model has been integrated into the software platform for forced ignition probability analysis to investigate the ignition process in a methane/air bluff-body flame with the flow and fuel/air mixing characteristics being extracted from a non-reacting RANS simulation. Representative ignition processes near the outer shear layer of the recirculation zone show that with fuel lean mixtures, PMR can yield ignition events with significant number of active particles,with the two important mechanisms for the successful ignition events,i.e.,the survival of the initial flame particles and the entrainment of the survived flame particles into the recirculation zone, being revealed.
For the methane/air bluff-body flame, the ignition probability maps from the local Karlovitz criterion and PMR are qualitatively similar and both agree well with the experimental observation: a high ignition probability in the shear layer of the recirculation zone near the mean stoichiometric surface,and low ignition probabilities inside the recirculation zone and the top stagnation region of the recirculation zone. For PMR, the effects of finite rate chemistry and turbulent mixing on the ignition probability are further quantified. The predicted shape of the ignition progress factor and ignition probability is in general insensitive to the model parameters and the model is adequate for quantifying the regions with high ignition probability.
Declaration of Competing Interest
The authors declare that they have no known competing financial interests or personal relationships that could have appeared to influence the work reported in this paper.
Acknowledgements
This work is supported by the National Natural Science Foundation of China(No.91841302)and the National Science and Technology Major Project (No. 2017-III-0007-0032).
 CHINESE JOURNAL OF AERONAUTICS2021年5期
- CHINESE JOURNAL OF AERONAUTICS的其它文章
- Ferrofluid moving thin films for active flow control
- Preliminary study on heat flux measurement data of TT-0 flight test
- An analysis and enhanced proposal of atmospheric boundary layer wind modelling techniques for automation of air traffic management
- Jet sweeping angle control by fluidic oscillators with master-slave designs
- Hot deformation behavior and microstructure evolution of the laser solid formed TC4 titanium alloy
- Electrochemical trepanning with an auxiliary electrode
