Hot deformation behavior and microstructure evolution of the laser solid formed TC4 titanium alloy
Xiawei YANG, Yanying WANG, Xiurong DONG, Chong PENG, Baijin JI,Yaxin XU, Wenya LI
State Key Laboratory of Solidification Processing, Shaanxi Key Laboratory of Friction Welding Technologies,Northwestern Polytechnical University, Xi’an 710072, Shaanxi, China
KEYWORDS Laser solid formed TC4;Constitutive models;Processing maps;Unstable regions;Microstructure
Abstract Hot compressive experiments of the laser solid formed(LSFed)TC4 titanium alloy were conducted at a wide temperature range of 650-950°C and strain rate of 0.01-10 s-1.The Arrheniustype constitutive models of the LSFed TC4 alloy were established at the temperature range of 800-950°C and of 650-800°C, respectively. The average relative error between the predicted stresses and experimental values in those two temperature ranges are 10.4%and 8.3%,respectively,indicating that the prediction models constructed in this paper are in a good agreement with experimental data.Processing maps were established by the principle of dynamic materials modeling on the basis of the data achieved from the hot compression experiments.The processing parameters corresponding to the stable and unstable regions of material deformation can be determined from the processing maps.The microstructure evolution of the stable and unstable regions of the samples after tests were observed. Finally, the effect of hot compressive parameters on the microstructure were investigated to research the dynamic recrystallization and the texture of the deformed LSFed TC4 alloy.
1. Introduction
TC4 titanium alloy has been widely applied in aerospace,energy and chemistry industries due to its low density, high specific strength, high stiffness, and good combination of mechanical and chemical properties.1-5There are many processes of titanium alloy forming (forging, extrusion, welding and casting) and a large number of scholars have carried out the research work in these processes.6-11With the development of aerospace, energy and other industries, the lightweight of components has become an urgent need in the development of these fields. At the same time, components are developing towards the trend of large-scale, integration and complexity.In recent years, the additive manufacturing (AM) technologies,12-16such as cold spray technology12,13and laser solid forming(LSF),14-16are utilized for aeronautical and aerospace industries. LSF is getting more and more attention from the scientific research and the actual production due to its advantages, such as high flexibility, low material consumption and reduction of production steps.
The industrial applications require components with appropriate microstructure, good mechanical properties and good dimensional stability. Understanding the deformation behavior of a material contributes to control the shape and properties of the product during hot processing. Deformation behavior is usually expressed by the relationship between flow stress and processing parameters such as deformation temperature,strain rate and strain.And this relationship is defined as the constitutive model of materials. Therefore, it is necessary to study this intrinsic relationship of the deformation of material, especially the material formed by the new forming method. At present, many constitutive models of materials have been studied by the scholars.17-22Tchein et al.17studied the hot deformation behavior of the TC4 alloy through hot torsion tests. Lin et al.18studied the flow behaviors of TC18 alloy in the α+β regime using Arrhenius and Hensel-Spittel constitutive models, respectively. The flow stresses of TC4 alloy after forging in the(α+β)region have been also successfully predicted according to the Arrhenius type model.19Liu et al.20used the Arrhenius type model to investigate the high temperature behavior of TC4-0.11Ru alloy. An extrapolated model based on the Ludwick and Linear model was proposed considering the work hardening and flow softening behaviors.21Zhao et al.22used Arrhenius type model to investigate the hot deformation behavior of powder metallurgy and ingot metallurgy Ti-5553 alloys. Among these constitutive models,the Arrhenius type model is commonly used to reveal the basic deformation behavior of the material.
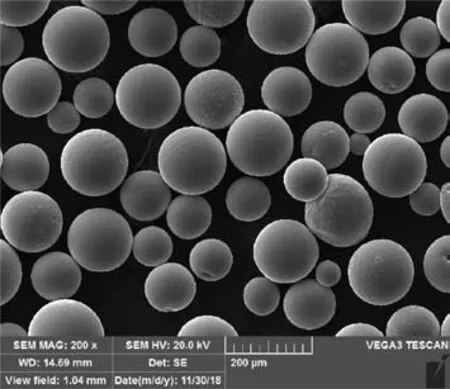
Fig. 1 SEM images of original TC4 powder.
In the past decades, various methods (genetic algorithm,artificial neural network and hot processing map) have been proposed to design and optimize the process parameters for hot deformation of materials.23-27The hot processing map,26,27based on dynamic material models (DMM), has been widely used in these methods. It can be established from the thermal compression experimental data. The hot processing map can be used to study the deformation mechanisms and to predict unstable and stable deformation regions, which are helpful to control the mechanical properties of materials during hot deformation process. In the last decades, the processing map has been widely used in steels,magnesium alloys, aluminum alloys, titanium alloys and other materials.27-33
In this investigation, an additive manufactured TC4 alloy was selected as the research object.A series of isothermal compression tests were conducted at the strain rate range of 0.01-10 s-1and the temperature range of 650-950°C. The influences of process parameters on the flow stress were investigated. The constitutive equations were established and theirs accuracy were verified by comparing experimental data.Based on the true stress-true strain curves,processing maps of LSFed TC4 alloy were established, and the process parameter ranges corresponding to the material deformation stable and unstable regions were obtained.Finally,the effect of process parameters on the microstructure were investigated to research the dynamic recrystallization and the texture of the deformed LSFed TC4 alloy.This study not only provides the direct guidance for hot processing of additive manufactured titanium alloys, but also reveals the additive manufactured titanium alloys’ hot process response and underlying deformation mechanisms.
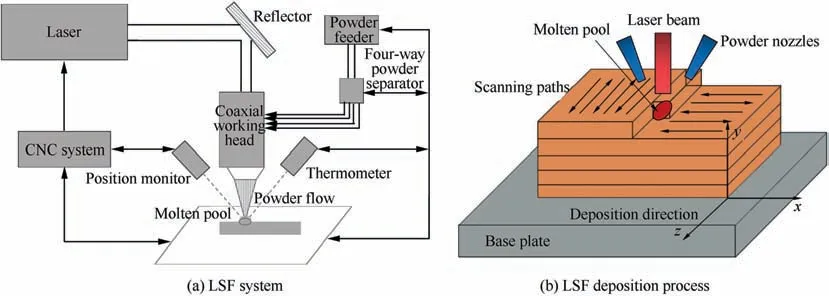
Fig. 2 Schematic of LSF system and LSF process.
2. Experimental procedures
2.1. Materials and LSF process
The scanning electron microscope(SEM)image of the original TC4 powders is shown in Fig. 1. The powders prepared by plasma rotating electrode are 80-120 μm in diameter. As can be seen from Fig. 1, the original powder particles have good uniformity and spherical shape. Fig. 2 shows the schematic of LSF system (Fig. 2(a)) and LSF process (Fig. 2(b)). As shown in Fig. 2(a), the LSF system includes a 2.5 kW diode laser,a five-axis numerical control table,a coaxial powder feed nozzle and an argon purged processing chamber with oxygen content of less than 50 ppm. Fig. 2(b) shows the deposition process of LSF.It can be seen from Fig.2(b)that a steel plate with the dimension of 150 mm×50 mm×10 mm was used as a substrate for the LSF process. The deposited block with characteristics of knitted type mesh was produced. The size of the block is 45 mm×85 mm×15 mm.The LSF processing parameters have influence on the hot deformation behavior of the LSFed TC4 alloy. The focus of this study are not on the effect of LSF processing parameters on the deformation behavior of the LSFed TC4.Therefore,the selected parameters mainly refer to some literatures,34-37and the parameters include lower power 1500 W, laser spot diameter 2 mm, layer thickness 0.5 mm, hatch spacing 2.5 mm and power feeding 10 g/min. Fig. 3 shows the microstructure and XRD of the LSFed TC4 alloy. The wavy laser scanning path can be seen in Fig.3(a),the coarse columnar grains with uniform distribution in the Y-Z plane appear in the microstructures. An enlarged view of the black box in Fig. 3(a) is shown in Fig. 3(b). As shown in Fig. 3(b), coarse columnar grains alternate between light and dark throughout the cladding layer, and the needle-like martensite α phase is shown in Fig. 3(c).Fig. 3(d) shows the result of the X-ray diffraction (XRD) of the LSFed TC4. It can be seen from Fig. 3(d) that α-Ti is the main phase of the LSFed TC4 alloy.
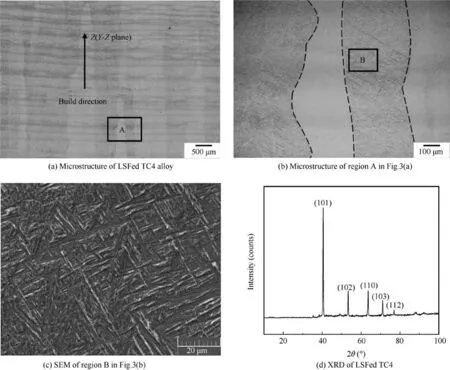
Fig. 3 Microstructure and XRD of the LSFed TC4 alloy.
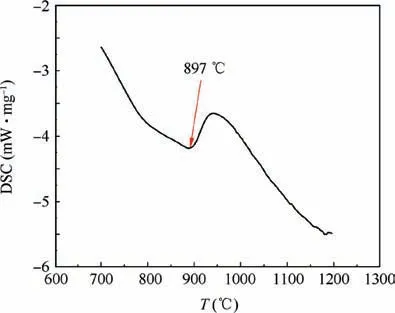
Fig. 5 DSC curve of the LSFed TC4 alloy.
2.2. Hot compression parameters of the LSFed TC4 alloy
The hot compressive specimens were prepared with 7 mm in diameter and 10.5 mm in height, as shown in Fig. 4. The hot deformation temperature range was determined by the alalysis of the DSC curve of the LSFed TC4 alloy. Fig. 5 shows the DSC curve of the LSFed TC4 alloy. As for the LSFed TC4 alloy,the transition from phase α to phase β is an endothermic reaction and the DSC curve decreases continuously.As can be seen from Fig.5,when the temperature is 897°C,it reaches the extreme value,indicating that the phase transition temperature is around 900°C. Isothermal compression tests were carried out on the Gleeble-3500 simulator at a series of different deformation temperatures (650, 700, 750, 800, 850, 900°C and 950°C) and strain rates (0.01, 0.1, 1 s-1and 10 s-1). The reduction in height is 60%. Before compression, specimen was heated to a preset temperature at a heating rate of 10°C/s, and held for 5 min to obtain a uniform temperature field. All specimens were compressed to a reduction in height 60%, and then quenched immediately in water.
The compressed specimens were cut into halves to prepare microscopic specimens. Optical microscope (OM) and scanning electron microscope (SEM) were applied to investigate the microstructure of the compressed specimens. Metallographic specimens were prepared by standard mechanical polishing procedures and then etched in this reagent(HF:HNO3:H2O=10: 5: 85). Electron back scattered diffraction (EBSD)was used to examine the recrystallization and phase transformation of LSFed TC4 alloy after compression deformation,which was performed on a ZEISSEVO18 SEM with scanning step size of 0.25 μm.
3. Results and discussion
3.1. True stress-true strain curves of LSFed TC4
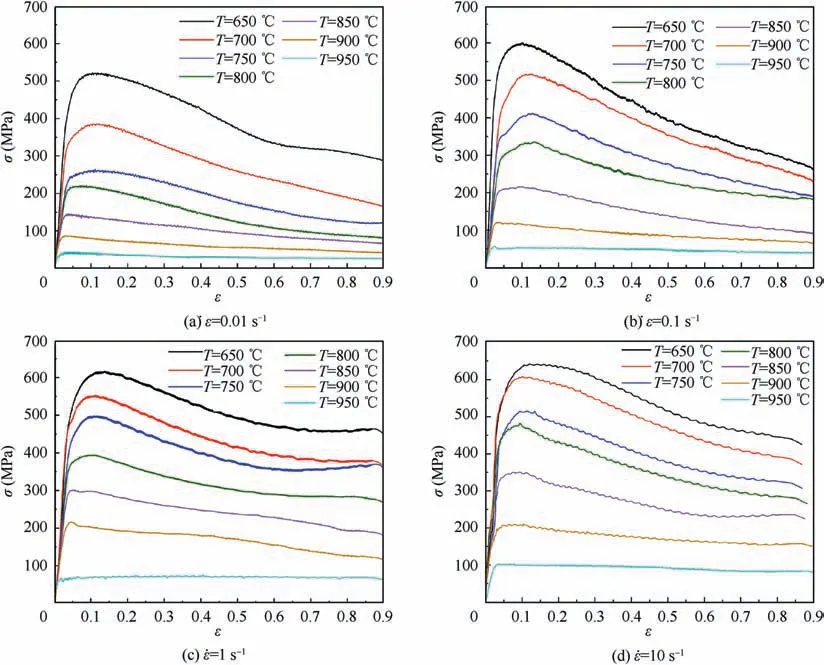
Fig. 6 True stress-strain curves of the LSFed TC4 alloy.
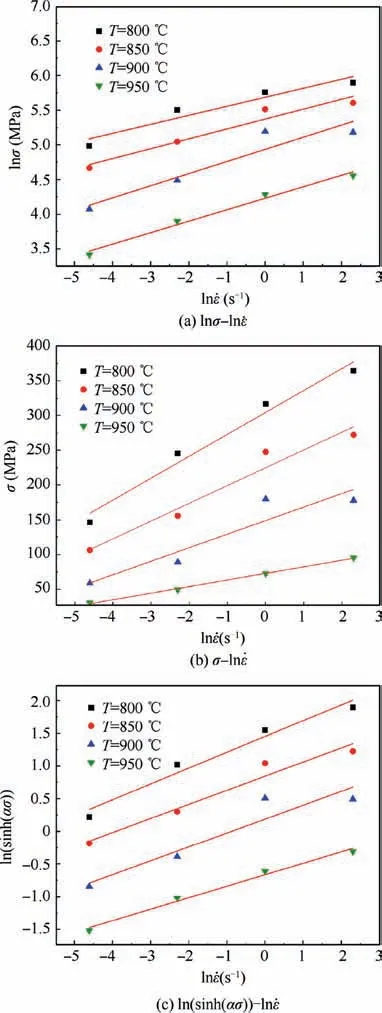
Fig. 7 Relationship between σ and ˙ε.
Based on the hot compression data, the true stress-true strain curves of the LSFed TC4 alloy at different deformation temperature (650, 700, 750, 800, 850, 900°C and 950°C) and strain rate (0.01, 0.1, 1 s-1and 10 s-1) are shown in Fig. 6. In general, at the same strain rate, the flow stress decreases with increasing temperature. When the temperature is constant,the flow stress increases with increasing strain rate.The curves exhibit work hardening first and reach peak value quickly,and then follow by a gradual fall.The lower the temperature is,the more obvious the softening effect is.The lower the temperature is,the more obvious the curve peak is.At temperature 950°C,the four curves in the entire strain rate range (0.01, 0.1, 1 s-1and 10 s-1) will basically not change after increasing to the peak value with the increase of strain. As shown in Fig. 6, at 650°C and 700°C, the peak value of flow stress at strain rate of 0.1 s-1is obviously larger than that of 0.01 s-1,while in the experiments carried out above 0.1 s-1,the trend of peak stress to increase with increasing strain rate becomes smaller. As shown in Fig.6(a), at strain rate 0.01 s-1,after the peak value of flow stress,the rate of decline of the curves are basically the same at experiments of 650,700,750°C and 800°C.As shown in Fig. 6(b), at strain rate 0.1 s-1, after the peak value of flow stress,the rate of decline of the curves are basically the same at experiments of 650, 700, 750, 800°C and 850°C.
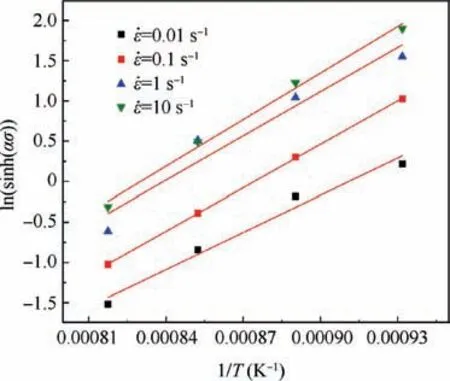
Fig. 8 Relationship between ln(sinh(ασ)) and 1/T.
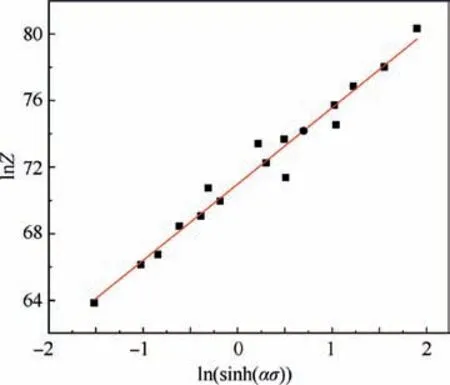
Fig. 9 Relationship between lnZ and ln(sinh(ασ)).
3.2. Establishment of Arrhenius constitutive equation
3.2.1. Establishment of constitutive model
In this paper, the constitutive equations of the LSFed TC4 were solved at the high temperature range of 800°C to 950°C and the lower temperature range of 650°C to 800°C,respectively.The constitutive equations were firstly established at high temperature range of 800°C to 950°C. The Arrhenius function was used to describe the constitutive relationship of the LSFed TC4 alloy38-40:
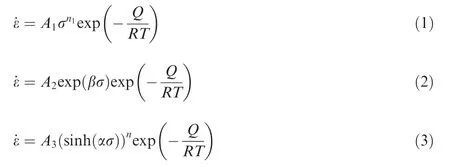
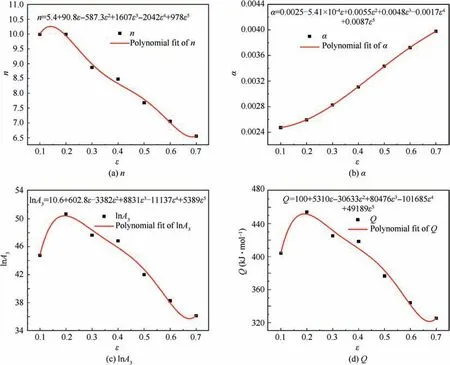
Fig. 10 Relationship between constitutive equation parameters and strain in high temperature range (800-950°C).
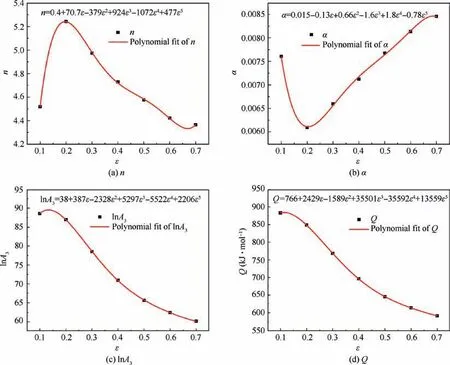
Fig. 11 Relationship between constitutive equation parameters and strain in medium temperature region (650-800°C).
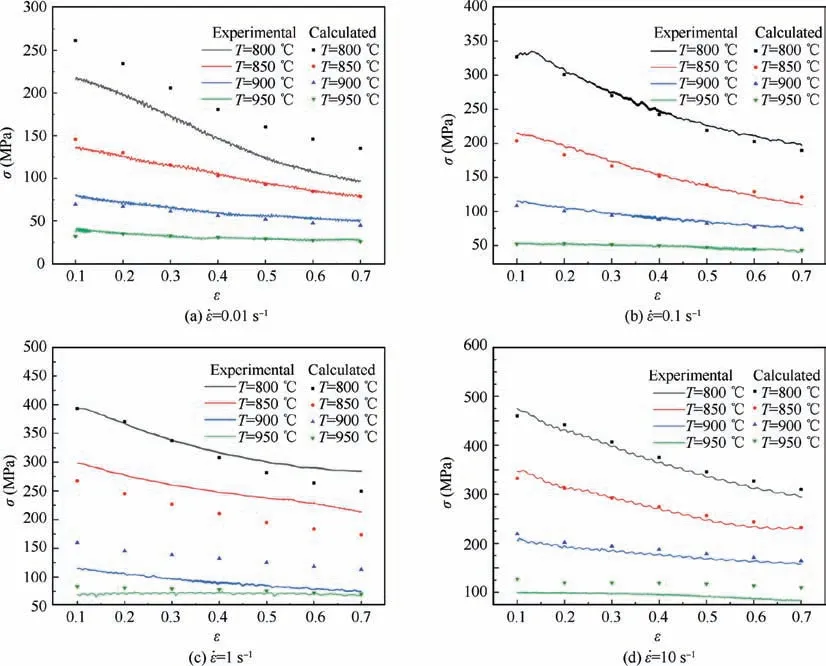
Fig. 12 Comparison of flow stress between experimental data and calculated results at high temperature region of 800-950°C.
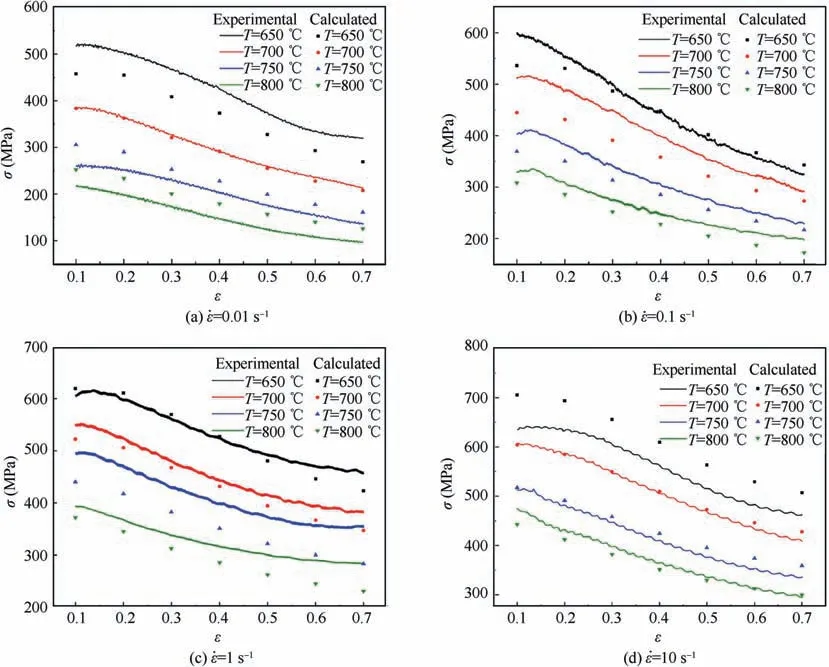
Fig.13 Comparison of flow stress between experimental data and calculated results at medium temperature region of 650°C to 800°C.
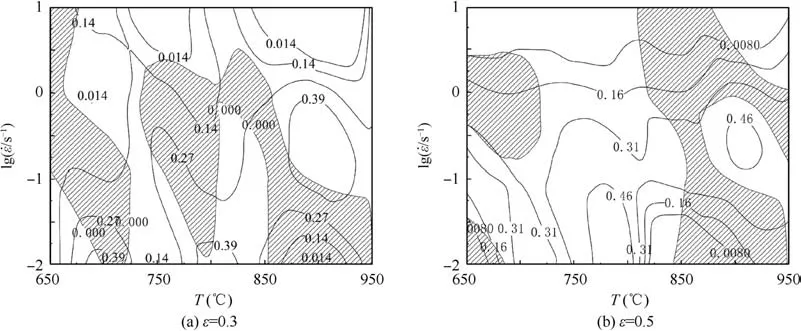
Fig. 14 Processing maps of LSFed TC4 alloy after deformation process at different strain.
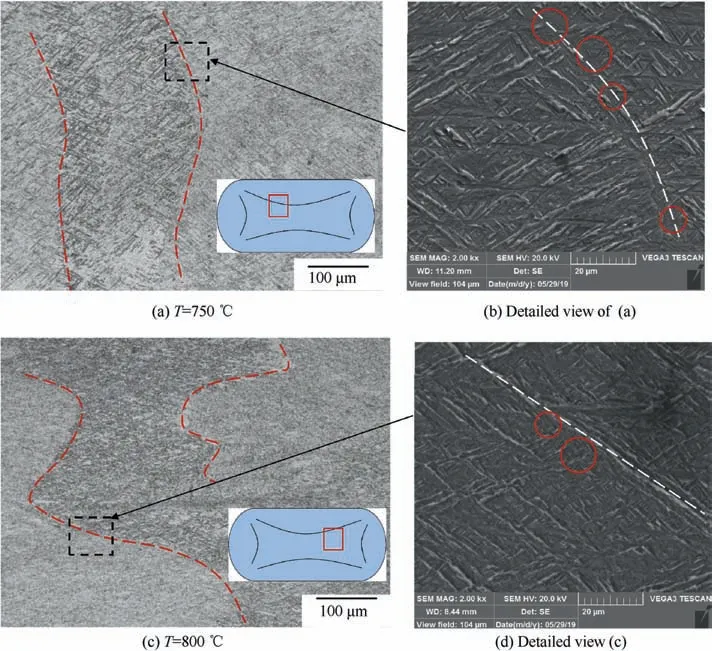
Fig. 15 Stable region microstructure of LSFed TC4 after deformation at 0.01 s-1 and two temperatures.

where A1, A2, A3, n1, α, β and n are constants of the material, T is the absolute temperature (K), Q is the deformation activation energy (J/mol), and R is the gas constant(R=8.3154 J˙sK-1˙smol-1),Z is the Zener-Hollomon parameter, σ is the flow stress (MPa) and ˙ε is the strain rate (s-1),α=β / n1. The general power equation is mainly applied to the hot deformation process with low stress (ασ <0.8). The exponential equation is mainly applied to the hot deformation process with higher stress(ασ >1.2).Since the hyperbolic sine Eq. (3) is applicable to all cases, the constitutive model is established using the Arrhenius hyperbolic sine equation.
By taking the natural logarithm of the Eqs.(1)and the(2),the following equations are written as:
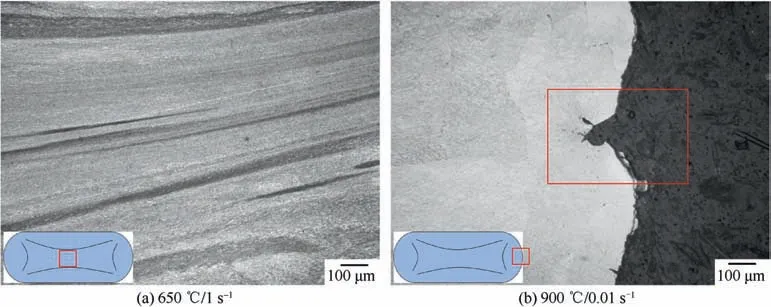
Fig. 16 Unstable region microstructure of LSFed TC4 after deformation.
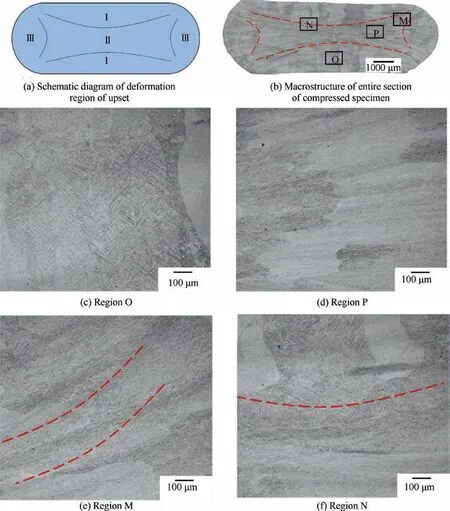
Fig. 17 Schematic diagram of deformation region of upset and actual macrostructure of the LSFed TC4 after hot deformation at the condition of 800°C/10 s-1.
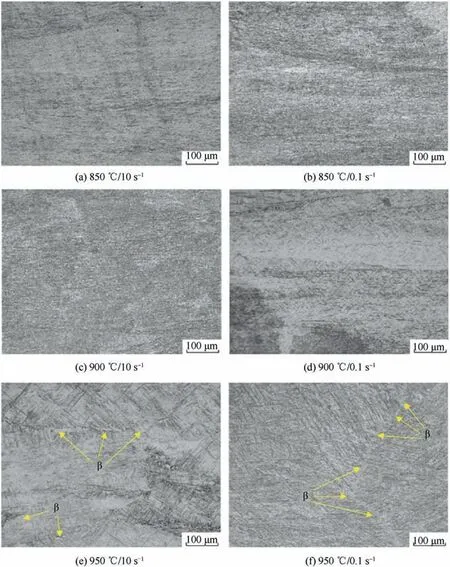
Fig. 18 Microstructure of the LSFed TC4 after hot deformation under different parameters.

At a constant temperature, according to Eqs. (5) and (6),the following equations are expressed as:

Here, strain 0.4 is selected as an example to calculate the constitutive parameters of the LSFed TC4 alloy. The value of n1was obtained from the slope of the linear regression of the relationship between ln σ and ln ˙ε(Fig. 7(a)), the average of n1is 4.00. The value of β was obtained from the slope of the linear regression of the relationship between σ and ln ˙ε(Fig. 7(b)). α can be calculated from β / n1, and it is 0.025.
According to Eq.(4),the following equation is described by

Assume that at a constant temperature, the deformation activation energy of the material is constant, the following equation can be got:

The value of n was obtained from the slope of the linear regression of the relationship between ln(sinh (ασ)) and ln˙ε(Fig. 7(c)), and the average of n is 4.73.
When the strain rate is constant, and it is assumed that the deformation activation energy is constant within a certain temperature range, Q it can be obtained by Eq. (9).
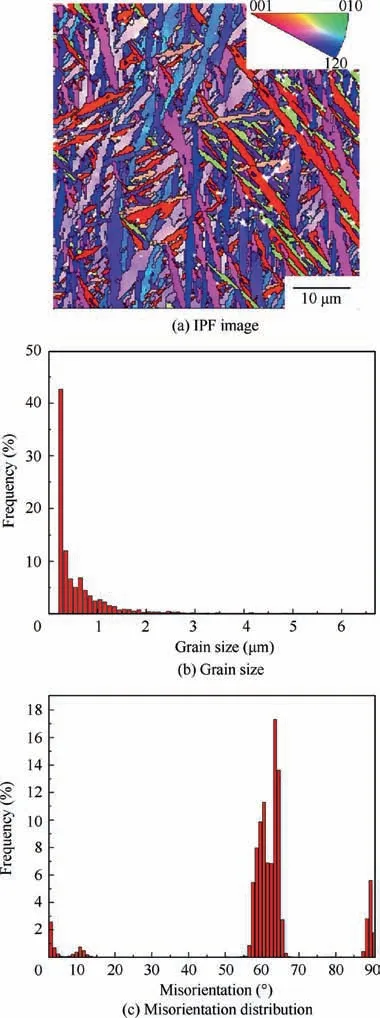
Fig. 19 EBSD maps of the LSFed TC4.

The value of Q was obtained from the slope of the linear regression of the relationship between ln(sinh (ασ)) and 1/T(Fig. 8) and Q is 696.16 kJ/mol. Eq. (8)
The Z value was obtained from the Eq. (12).

The value A3was obtained from the Fig. 9.A3=6.74×1030. According to the above calculation results,the following Eq. (13) can be obtained.

Based on the above method, the corresponding constitutive model parameters corresponding to 0.1, 0.2, 0.3, 0.5, 0.6 and 0.7 are solved respectively.And the corresponding constitutive equation are as follows.
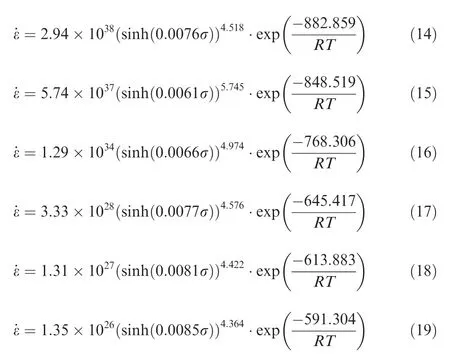
The calculation process of the constitutive model parameters of the LSFed TC4 in the temperature range of 650-800°C is the same as that of the high temperature range of 800-950°C. So, the solution details of constitutive model of temperature range of 650-800°C are not described here.Using the constitutive model parameters corresponding to the strains of 0.1,0.2,0.3,0.5,0.6 and 0.7,the fitting relationship between the constitutive parameters and the strain in high temperature region (800-950°C) and medium temperature region (650-800°C) was calculated, respectively, as shown in Figs. 10 and 11. The results shown in Figs. 10 and 11 are equivalent to solve the constitutive equations with more strain variables.
3.2.2. Verification of constitutive model
At the strain rate of 0.01-10 s-1,the predicted and experimental values of stress was compared in two temperature ranges(800-950°C and 650-800°C), respectively, as shown in Figs. 12 and 13. As shown in Fig. 12, at the high temperature region of 800-950°C, the prediction accuracy of constitutive equations at 0.01 s-1/800°C, 1 s-1/850°C and 1 s-1/800°C are lower than those of the other conditions. As shown in Fig.13,at the high temperature region of 650-800°C,the prediction accuracy of constitutive equation at 0.01 s-1/800°C,0.1 s-1/700°C and 10 s-1/650°C are lower than those of the other conditions. An average relative error between the predicted and experimental values of stress is 10.4 % at the temperature range of 800-950°C,as shown in Fig.12.An average absolute relative error is 8.3 % at temperature range of 650-800°C, as shown in Fig. 13. So, the prediction accuracy of constitutive equation in high temperature region is slightly lower than that of the medium temperature region. Totally,the constitutive models proposed in the present paper has an acceptable accuracy.
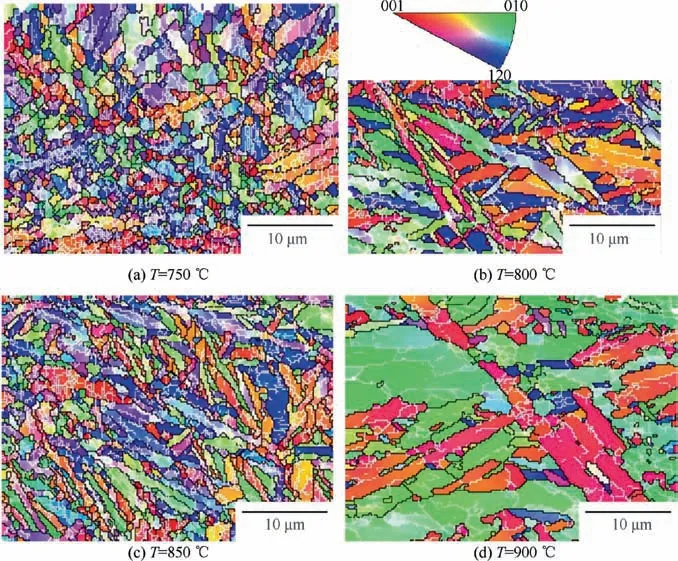
Fig. 20 IPF images of LSFed TC4 alloy after deformation at 10 s-1 and different temperature.
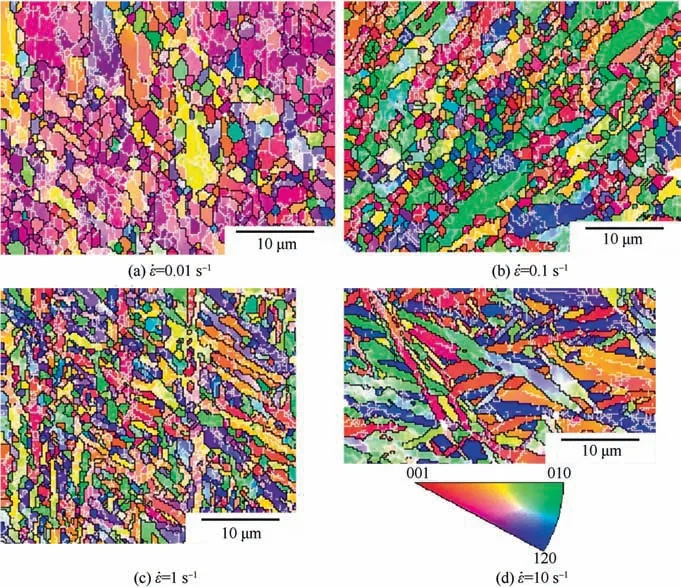
Fig. 21 IPF images of the LSFed TC4 deformed at the temperature of 800°C and different strain rate.
3.3. Hot processing map of LSFed TC4 alloy
The processing map is a superposition of the power dissipation diagram and the instability diagram.41The power dissipation diagram implies a certain microstructure evolution. The instability diagram describes the ‘‘stable region” and ‘‘unstable region” of the plastic deformation process of the material.Therefore, combined with the microstructure observation
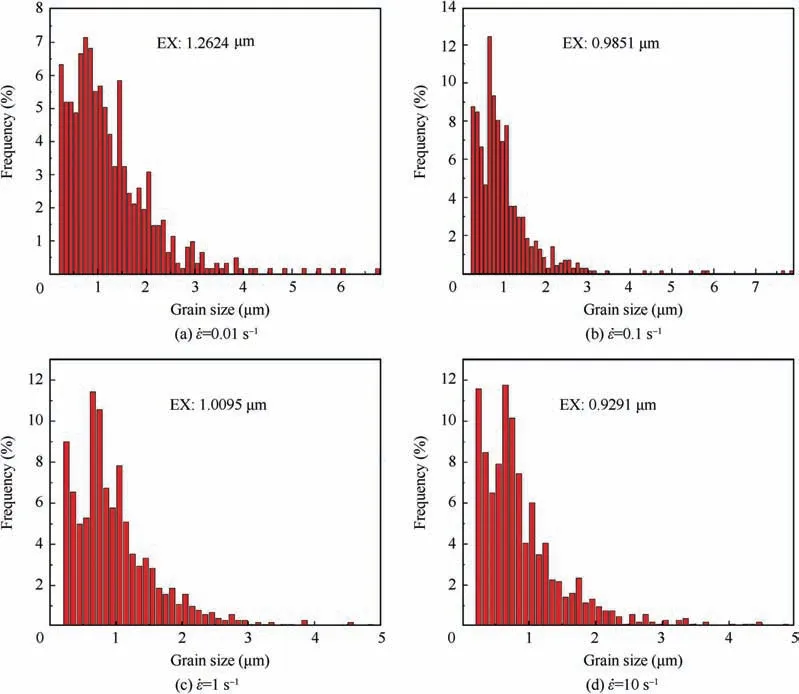
Fig. 22 Grain size distribution ratio of the LSFed TC4 after deformation at 800°C and different strain rate.
and the hot processing map can express the relationship between the microstructure evolution and processing parameters during the hot deformation of the material.It can be considered that the workpiece is an ‘‘energy dissipator”. The energy dissipation process is the process of material microstructure evolution and can be expressed by a dimensionless parameter, energy dissipation efficiency (η).

where m is the strain rate sensitivity index.
m can be given as follows:

where the G content represents the temperature increase,and the J co-content represents the dissipation through metallurgical process.
For steady-state flow stress,the value of the strain rate sensitivity index m varies from 0 to 1. When m is 0, it means that the system doesn’t have energy dissipation. When m is 1, it indicates that the material tends to be in a viscous fluid state.When deformation is at a higher strain rate, m is usually greater than 1. The power dissipation diagram is constructed by the energy dissipation efficiency (η), which expresses the way the material dissipated through the evolution of the microstructure.
The continuity criterion of flow instability based on the principle of irreversible thermodynamic extremismcan be defined by the following equation using the principle of maximum productivity entropy:

where ξ (˙ε) is instability parameter, and it is a function of the deformation temperature and the strain rate. A region where the value is negative on a two-dimensional plane composed of strain rate and temperature is called a rheological instability region.
Fig.14 shows the processing maps of the LSFed TC4 alloy with strains 0.3 and 0.5.As shown in Fig.14,the contour value is the percent efficiency of power dissipation, and the shaded area represents the unstable regions. The distributions of the flow instability under these two strains have big difference.As can be seen from Fig. 14(b), when the strain is 0.5, the stable flow regions were distributed mainly in the temperature range from 720 to 825°C and in the whole strain rate range.As can be seen from Fig. 14(a), when the strain is 0.3, the region in the temperature range from 720-825°C and in the whole strain rate range is one of the three instability zones.It can be seen from Fig. 13, when the strains are 0.3 and 0.5,the distributions of the flow instability are similar each other in the temperature range from 850 ℃to 980 ℃and in the strain rate range of 0.01-0.056 s-1.It is necessary to avoid forming in these unstable regions during the hot deformation process.
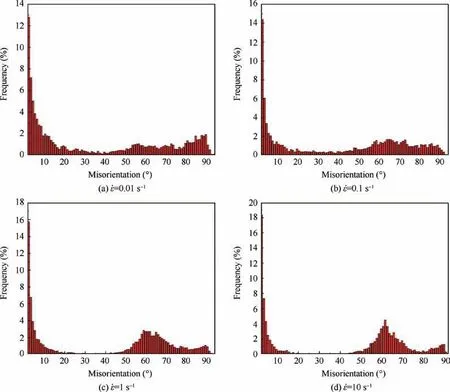
Fig. 23 Misorientation distributions of the LSFed TC4 alloy after deformation at 800°C and different strain rate.
Fig.15 shows microstructure of stable region of the LSFed TC4 alloy after deformation at strain rate 0.01 s-1and two temperatures (750°C and 800°C). As can be seen from Fig. 14, the β grain boundary has become jagged and a small amount of recrystallized grains appear at the β grain boundary, exhibiting typical dynamic recrystallization characteristics. Thus, the high-power dissipation rate in the process map is related to the dynamic recrystallization of the alloy under these conditions. Fig. 16 shows the microstructure of the unstable region of the LSFed TC4 alloy after deformation at two conditions of 650°C/1 s-1and 900°C/0.01 s-1. It can be seen from the Fig. 16(a) that the microstructure of the LSFed TC4 alloy exhibits a strong flow instability with band shape. When the LSFed TC4 alloy is deformed under 900°C/0.01 s-1, a large number of longitudinal free surface cracks are generated on the surface of the alloy, as shown in Fig.16(b).Therefore,the instability situations must be avoided in the actual hot working process of materials.
3.4. Microstructure of the LSFed TC4 alloy after deformation
3.4.1. Microscopic results of hot compression deformation
Fig.17 shows the schematic diagram of deformation region of upset and actual microstructure of the LSFed TC4 alloy after hot deformation at the condition of 800°C/10 s-1. Fig. 17(a)shows the typically schematic diagram of deformation region of upset.The deformation region division mode is also suitable for the hot compression deformation process in this paper.The symbols I,II and III in Fig.16 represent the small deformation region, the severe plastic deformation region and the medium deformation region, respectively. Fig. 17(b)-(f) show the macrostructure of the LSFed TC4 alloy after hot deformation at temperature 800°C and strain rate 10 s-1. It can be clearly seen from Fig. 17(b) that the macrostructure of the hot deformed specimen has obvious unevenness. As can be seen from Fig. 17(c), the microstructure of region O in Fig. 17(b)is basically the same as the original microstructure of the LSFed TC4 alloy (Fig. 3), indicates that the region O has the characteristic of the small deformation region. As can be seen from Fig. 17(d), the grains were significantly elongated.As can be seen from Fig. 17(e), the grains of region M were elongated and the streamline were distributed in the microstructure.It can be seen from Fig.17(f),the morphology of the original microstructure can be observed in region N,and some characteristics of the deformed microstructure are also found in this region.
Microstructures of the LSFed TC4 alloy after hot deformation under different parameters were shown in Fig. 18. As shown in Fig. 18(a)-(d), when the temperatures are 850°C and 900°C,no obvious β phase is found in the microstructure.It shows that the β phase is not easy to be observed in the metallographic microstructure below the phase transition point.As shown in Fig. 18(e) and (f), when the temperature exceeds the phase transition point and reaches 950°C, the β phase is evidently observed in the metallographic microstructure. At the condition of below the phase transition point,only a small amount of β phase can be retained,which made the characterization rather difficult. However, it is believed that underhigher deformation temperature conditions, especially when the temperature is greater than the phase transition point,the evolution of the microstructure of the β phase plays an important role in the evolution of the microstructure of the surrounding α phase.

Table 1 Misorientation proportion of the LSFed TC4 after deformation at 800°C and different strain rate.
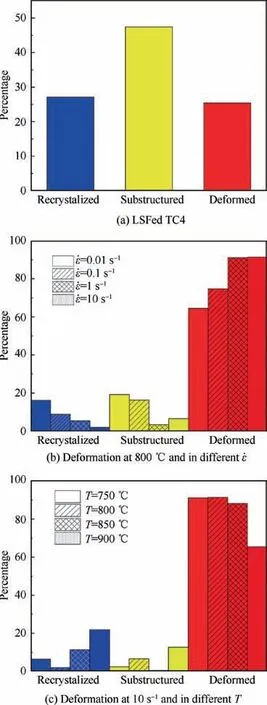
Fig. 24 Recrystallized fraction of the LSFed TC4 before and after deformation.
3.4.2. EBSD results of hot compression deformation
Fig. 19 is the EBSD image of the LSFed TC4 alloy. In the inverse pole figure (IPF), the black line indicates a largeangle grain boundary with an orientation difference greater than 15°, and the white line indicates a small-angle grain boundary with an orientation greater than 2° and less than 15°. The color of the crystal grains in Fig. 19 indicates that the crystal orientation of the crystal grains is parallel to the normal direction of the observation surface of the specimen,corresponding to the color in the triangular arc shape of the upper right corner.Fig.19(a)is the EBSD image of the LSFed TC4 alloy. As shown in Fig. 19(a), the LSFed TC4 alloy is a typical martensitic microstructure that is mainly composed of acicular α grains,and the grain orientations tend to be consistent. The average grain size is 0.658 μm. Fig. 19(b) shows the proportion of the grain size distribution. It can be seen from Fig. 19(b) that the small size grains account for the majority(0.25 μm accounts for 42.65%) and the large size grains are fewer. As shown in Fig. 19(c), the LSFed TC4 alloy is mainly large-angle grain boundaries, accounting for 94.2%.
Fig.20 shows the IPF images of the LSFed TC4 alloy after hot deformation at 10 s-1and different temperature(750,800,850°C and 900°C). The recrystallized grains haven’t enough time to grow due to the relatively low temperature 750°C, as shown in Fig.20(a).A cross-distributed microstructure of fine equiaxed grains and coarsened martensite can be found in Fig. 20(a) and the average grain size is 0.9477 μm. When the temperatures are 800°C and 850°C, some equiaxed grains were elongated compared to that of 750°C, and the equiaxed crystal ratio decreases significantly,as shown in Fig.20(b)and(c). As shown in Fig. 20(d), when the temperature is 900°C,the grain orientation changed greatly and the <010 >crystal orientation occupies the domination.In addition,the coarsening phenomenon is the most obvious compared with the other conditions.
Fig. 21 shows the IPF of the LSFed TC4 alloy after deformation at 800°C and different strain rate (0.01, 0.1, 1 s-1,10 s-1). Fig. 21(a) is the IPF diagram at strain rate 0.01 s-1and temperature 800°C. It can be seen from Fig. 21(a) that the equiaxed grains uniformly distributed along the direction of <122 >and <121 >due to the long time that heat affects the forming process at low strain rates. The average grain size of the LSFed TC4 alloy after deformation is 1.26 μm. The proportion of large angle grain boundary and small angle grain boundary is 52.7% and 47.3%, respectively.Equiaxed α grains and martensitic α laths appear in Fig.21(b).The grain orientation is more random and the average grain width is 0.98 μm. The ratio of large angle grain boundary is 62.6%. As can be seen from Fig. 21(c), the lath martensite is the majority of microstructure and the equiaxed grains randomly distributed among the laths. The average grain width is 1.0095 μm and the large angle boundaries account for 61.4%. As shown in Fig. 21(d), lath like α-martensite distributed abundantly in the microstructure and the average grain size is 0.92 μm,indicating that the degree of recrystallization was reduced.Fig.22 shows the grain size distribution proportion. Compared with the grain size distribution of the LSFed TC4 alloy, the grain size of the LSFed TC4 alloy after deformation accounts for a large proportion of 0-3 μm, and has obvious coarsening phenomenon. Fig. 23 shows misorientation distributions of the LSFed TC4 alloy after deformation at temperature 800 ℃and different strain rate. Table 1 shows the proportion of large and small angle grain boundaries. It can be seen that the small angle grain boundaries are reduced by nearly half compared with the LSFed TC4 alloy,indicating that the dynamic recrystallization occurs in this condition.The continuous transition of small-angle grain boundaries to largeangle grain boundaries indicates that the continuous dynamic recrystallization occurs.
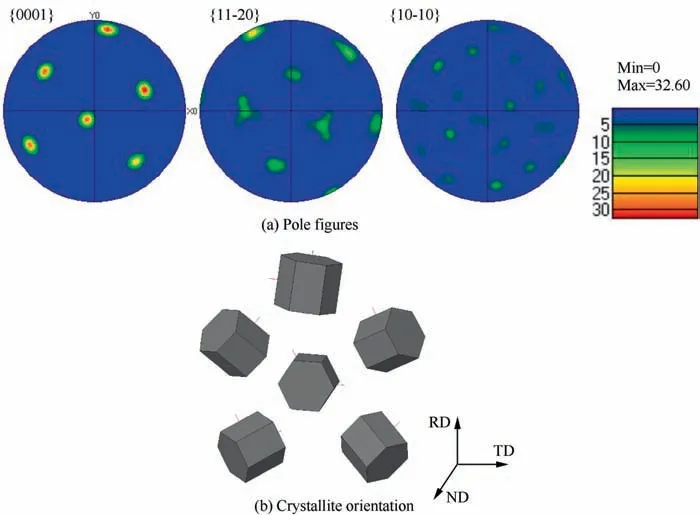
Fig. 25 Pole figures and crystallite orientation of the LSFed TC4.
Fig. 24 shows recrystallized fraction of the LSFed TC4 alloy before and after hot deformation.In general,the average orientation difference of grains in the crystal is more than 15°,which is regarded as the deformed grains. This difference of grains in the crystal is less than 2° in the crystal, which is regarded as the recrystallized grains. This difference of grains in the crystal is between 2° and 15° in the crystal, which is regarded as sub crystalline grains.42It can be seen from Fig. 24(a) that the recrystallized and the deformed grains of the LSFed TC4 alloy are about 27%, and sub crystal grains is 46%. It can be seen that from Fig. 24(b) and (c) that the deformed grains dominate in the microstructure and the highest proportion of the deformed grains is over 80%. When the temperature remains constant, the amount of the deformed grains increases with increasing strain rate. When the strain rate remains constant, the amount of the deformed grains increases as the decrease of temperature. The proportion of the recrystallized grains after hot compression is about 10%.This proportion increases with increasing temperature and decreasing strain rate. Smaller strain rate means longer deformation time,which leads to more energy stored in the material.
3.4.3. Texture of the LSFed TC4 alloy after deformation
The grain orientation characteristics of the LSFed TC4 alloy before and after hot deformation are analyzed by polar diagram. As shown in Fig. 25(a), the grain orientation of the LSFed TC4 alloy is {0001} with the strongest texture and the maximum polar density of {0001} is 32.60, while {1010}and {1120} are weak and random. Fig. 25(b) is the specific α phase orientation of the LSFed TC4 alloy.It can be seen from Fig. 25(b) that the orientation is very regular, and the dense hexagonal α is arranged according to certain rules. Fig. 26 shows the diagrams of {0001}, {11-20} and {10-10} α phase of the LSFed TC4 alloy at temperature 800°C and strain rates of 0.01, 0.1, 1 s-1and 10 s-1. The texture intensity of the LSFed TC4 alloy after deformation is lower than that of the LSFed TC4 alloy. As can be seen from Fig.26(b)-(d),the larger the strain rate is, the closer the deformation texture is to the LSFed TC4 alloy. As shown in Fig. 26(a), compared with the LSFed TC4 alloy, the texture has changed significantly,and a pair of mirror deformation textures appear in {11-20}and {10-10} directions, indicating that with the extension of deformation time, the arrangement of lattice tends to the unified direction.
Fig.27 shows the diagrams of{0001},{11-20}and{10-10}α phase of the LSFed TC4 alloy after deformation at strain rate 10 s-1and different temperature (750, 800, 850°C and 900°C). When the temperature is 900 ℃, the texture changes significantly and the texture intensity reaches 41.25, which is much higher than that of the LSFed TC4 alloy(Fig.25).When the temperature is below the phase transformation point, the texture arrangement of the LSFed TC4 after deformation almost unchanged compared with the LSFed TC4,but the texture intensity is reduced. When the temperature is close to the transformation point,the grain orientation changes obviously.In combination with the above IPF diagram, the microstructure near the phase transformation point also change significantly.
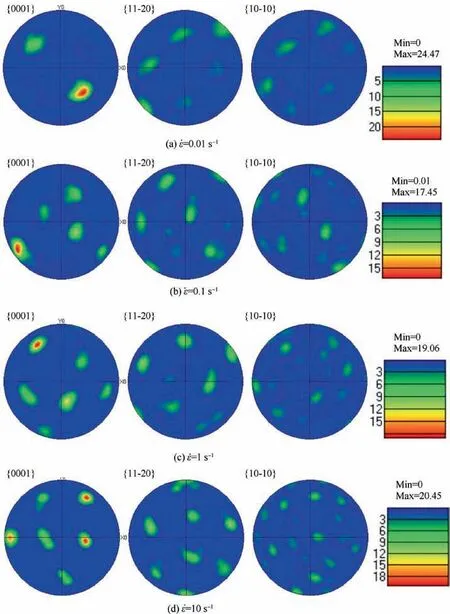
Fig. 26 Pole figures of α phase of LSFed TC4 after deformation at 800°C and different strain.
4. Conclusions
(1) Stress-strain curves are sensitive to the strain rate and deformation temperature. At the same strain rate, the flow stress increases with the decrease of the deformation temperature, and at the same deformation temperature, the flow stress increases with increasing strain rate.
(2) The constitutive equation parameters (n, α, lnA and Q)of the LSFed TC4 alloy were calculated at different strains (0.1, 0.2, 0.3, 0.4, 0.5, 0.6 and 0.7). The average relative error between the predicted stresses and experimental values is 10.4% at temperature range of 800-950°C and this error is 8.3% at temperature range of 650-800°C, which indicates that the calculated data are basically in line with the experimental curves.
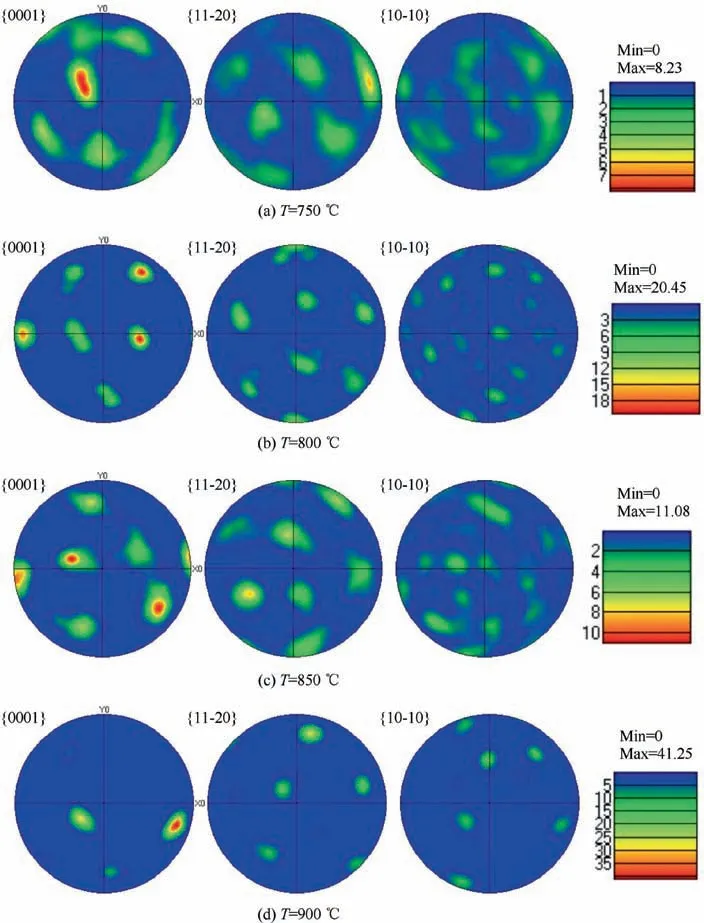
Fig. 27 Pole figures of α phase of LSFed TC4 after deformation at 10 s-1 and different temperature.
(3) The hot processing map for the LSFed TC4 alloy was established. The microstructure of stable region of the LSFed TC4 alloy after deformation at strain rate 0.01 s-1and two temperatures (750°C and 800°C)represents the typical dynamic recrystallization characteristics. The microstructure of the unstable region of LSFed TC4 alloy after deformation at 650°C/1 s-1exhibits a strong flow instability with band shape, and exhibits free surface cracks at condition of 900°C/0.01 s-1.
(4) At the highest strain rate 10 s-1, a cross-distributed microstructure with fine equiaxed grains and coarsened martensite is found under temperature 750°C. When temperatures are 800°C and 850°C, some equiaxed grains are elongated and the equiaxed crystal ratio decreases significantly. When temperature is 900°C,the grain orientation changes greatly and the <010 >crystal orientation is dominant. At temperature 800°C, the equiaxed grains distributed uniformly along the direction of <122 >and <121 >under strain rate 0.01 s-1. When strain rate is 1 s-1, the lath martensite is the majority of microstructure and the equiaxed grains distributed randomly among the laths. When strain rate is 10 s-1, lath like α-martensite distributed abundantly in the microstructure.
Declaration of Competing Interest
The authors declare that they have no known competing financial interests or personal relationships that could have appeared to influence the work reported in this paper.
Acknowledgements
The authors would like to acknowledge the National Key Research and Development Program of China (No.2016YFB1100104), the National Natural Science Foundation of China(No.51875470),the State Key Laboratory of Solidification Processing (NPU, China) (2019-QZ-01), and the financial support from the fund of SAST (SAST2016043).
 CHINESE JOURNAL OF AERONAUTICS2021年5期
- CHINESE JOURNAL OF AERONAUTICS的其它文章
- Ferrofluid moving thin films for active flow control
- Preliminary study on heat flux measurement data of TT-0 flight test
- An analysis and enhanced proposal of atmospheric boundary layer wind modelling techniques for automation of air traffic management
- Jet sweeping angle control by fluidic oscillators with master-slave designs
- Electrochemical trepanning with an auxiliary electrode
- A method for automatic detection and characterization of plasma bubbles using GPS and BDS data
