A method for automatic detection and characterization of plasma bubbles using GPS and BDS data
Qing LI, Ynbo ZHU, Zhipeng WANG, Kun FANG
a National Key Laboratory of CNS/ATM, School of Electronics and Information Engineering, Beihang University,Beijing 100191, China
b Aviation Data Communication Corporation, Beijing, 100191, China
KEYWORDS Depletion drift;Ground-Based Augmentation System (GBAS);Ionosphere gradient;Plasma bubble;TEC depletion
Abstract Detecting and characterizing Total Electron Content (TEC) depletion is important for studying the ionospheric threat due to the Equatorial Plasma Bubble (EPB) when applying the Ground-Based Augmentation System (GBAS) at low latitudes. This paper develops a robust method to automatically identify TEC depletion and derive its parameters.The rolling barrel algorithm is used to automatically identify the TEC depletion candidate and its parameters. Then, the depletion candidates are screened by several improved techniques to distinguish actual depletions from other phenomena such as Traveling Ionospheric Disturbance (TID) or abnormal data. Next,based on the depletion signals from three triangular receivers, the method derives EPB parameters such as velocity,width and gradient.The time lag and front velocity are calculated based on crosscorrelation using TEC depletions and the geometrical distribution of three triangular receivers.The width and gradient of slope are then determined by using TEC depletion from a single receiver.By comparison,both the station-pair method and proposed method depend on the assumption that the EPB morphology is frozen during the short time when the plasma bubble moves between the receivers.However,our method relaxes the restriction that the baseline length should be shorter than the width of slope required by the station-pair. This relaxation is favorable for studying small-scale slope of depletions using stations of a longer baseline. In addition, the accuracy of the width and gradient is free of impact from hardware biases and small-scale disturbance, as it is based only on the relative TEC variation. The method is demonstrated by processing Global Positioning System(GPS)and BeiDou Navigation Satellite System(BDS)data on 15 August,2018,in a solar minimum cycle.
1. Introduction
Equatorial Plasma Bubble (EPB) refers to the depletion of plasma densities that is frequently observed in the nighttime ionosphere at equatorial and low-latitude regions regardless of whether there are storms or not.1The Raleigh-Taylor instability triggered by seeding perturbations is generally accepted as the mechanism responsible for the appearance of plasma bubbles.2EPBs consist of depletions with an abrupt decrease in electron densities in the transition region, and it is commonly followed by a recovery to the value preceding the depletion.3
The signal delay due to EPBs is widely regarded as the greatest threat to single frequency Ground-Based Augmentation System (GBAS) operations at low latitudes.4-7The extreme magnitudes of EPBs parameters combined with some worst configuration scenarios for the GBAS could potentially result in large yet undetected differential positioning errors for an approaching aircraft.8Parameters such as the drift velocity of EPB, width of slope, and gradient are defined to assess an ionospheric threat model for the GBAS.9Based on measurements of the Atmospheric Explorer E satellite and ALTAIR radar, Tsunoda et al.10found that the zonal drift of an ionospheric plume associated with plasma bubbles ranged from 150 to 200 m/s during in July and August of 1978. The statistical observations of C/NOFS satellite from 2008 to 2014 showed that the nighttime zonal drift of plasma bubble increased from about 60 m/s near the solar minimum to 120 m/s close to the solar maximum.11Based on Global Positioning System (GPS) observations, the steepest part of the slope with a width of about 5.3 km and transition region with a total length of 35.3 km was reported on 8 April 2008 at Ishigaki (24.30°N,124.20°E).12An EPB maximum gradient of 850.7 mm/km was reported on 1 March 2014 in Brazil,8while a gradient of 540 mm/km was obtained on 8 April 2008 at Ishigaki in the Asia longitudinal sector.12However,as only a limited number of EPBs based on Global Navigation Satellite System (GNSS) were characterized, more data analysis is needed to provide sufficient justification on the upper bounds of parameters for the threat model.13
Various methods for detecting plasma bubbles or depletions based on GNSS Total Electron Content(TEC)data have been proposed, which include fourth order polynomial fit,14moving average,15band-pass filter technique3,Savitzky-Golay filter16,17and Mechanical Rotary Motion-Implicit Terrain (MRMIT) filtering.18TEC depletions are usually associated with fluctuations because the satellite-receiver ray paths pass through a region of plasma bubble, and there exists electron density disturbance inside and around the bubble.19,20Due to the impact of bubbles and disturbance occurring successively or simultaneously,methods relying on the determination of a logical baseline or a quiet day reference tend to misjudge data anomaly as artificial depletions. For example,methods based on a polynomial fit or moving average often mistake depletions as large amplitude wave oscillations.18
Estimation of the velocity of EPB generally involves identifying the characteristic points of three TEC time series, which are then used as inputs for the three-station-based trigonometric method.9Such a method has been applied to estimate the speed of mid-latitude ionospheric wedge,21velocity of irregularity22and velocity of EPB in the Brazilian region.9The accuracy of velocity is largely dependent on manual identification of the occurrence time of the characteristic points.To estimate the gradient, station-pair and time-step techniques have been widely used.20,23,24The accuracy of the gradient derived by the station-pair method is very sensitive to receiver hardware bias errors and baseline length of the selected receiver pair.23The time-step method, though free of bias error, uses a single receiver’s temporal rate of TEC to estimate a mixture of spatial and temporal gradient.20
This paper describes an automatic method to identify depletion based on GNSS data, and further estimates the depth, drift velocity, width, and gradient of TEC depletion.The method uses an improved rolling-barrel algorithm to filter the original TEC time series to detect TEC depletions and does not rely on a predetermined smooth TEC model or a quiet day reference. The velocity is estimated based on the geometrical locations of stations and time lags by cross-correlation of the depletion signal and Rate of TEC (ROT). Based on the velocity, the method derives the width and gradient using a single TEC depletion signal from one station, thus relaxing the restriction that a short baseline distance of a pair of receivers is required in the station-pair method. In addition, the width and gradient are free of impact from hardware biases and small-scale disturbance, as it is only based on the relative TEC variation.The algorithm is illustrated using the measurements of 3 triangular GNSS receivers in Hong Kong Satellite Positioning Reference Station Network at low latitudes. The results are compared and verified with those via other techniques.
2. Data
To demonstrate its features, the method is applied to process Global Positioning System (GPS) and BeiDou Navigation Satellite System (BDS) data at low latitudes on 15 August,2018, in a solar minimum cycle. Fig. 1(a) shows a map of the geographic locations of the 19 GNSS stations in Hong Kong(geographic lat.22.3°N,long.114.1°E,and geomagnetic lat. 12.7°N). These stations receive multiple GNSS signals,such as GPS (L1, L2 and L5), and BDS (B1, B2 and B3) signals.A minimum distance of less than 15 km for the neighboring stations can be computed for the network.
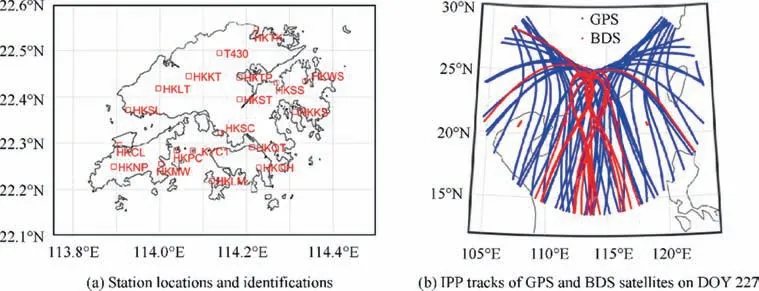
Fig. 1 Stations and IPP tracks over the Hong Kong region.
Assuming the ionosphere as a thin layer at a theoretical height of 350 km, the ionospheric delay is measured as the TEC at the Ionospheric Pierce Point (IPP) by the satellite-toreceiver line-of-sight intercepted with the layer.The IPPs move with a velocity of approximately 60-600 m/s as the satellite elevation angle varies from 90 to 5 degrees. The corresponding moving distance of an IPP in a 30-second interval is approximately 1.8 and 18 km. Fig. 1(b) shows that the typical IPP tracks of 31 GPS(blue)and 14 BDS(red)satellites visible from HKSL station cover a large area of longitudes, i.e., 105°E to 123°E, and latitudes, i.e., 14°N to 29°N. The dense distributions of IPPs provide abundant TEC observations of the northern crest of the equatorial anomaly.
In the paper, we use measurements on 15 August 2018(DOY 227)from six stations,whose identifications are HKSL,T430, HKKS, HKCL, HKKT and HKQT.
3. Method of detecting and characterizing plasma bubbles
First, Slant TEC (STEC) and ROT are calculated from the dual frequency code and carrier observations. Furthermore,carrier-derived TEC is adjusted to code-derived TEC. Next,the TEC depletion signal is derived by processing STEC using a rolling barrel and Savitzky-Golay filter. Then, the front velocity is estimated by using three triangular receivers.Lastly,the width and gradient of slope are derived using the slant TEC depletion of a single receiver.
3.1. TEC and ROT calculations
The ionospheric delay is calculated from the dual frequency code and carrier phase measurements and converted to STEC,as follows23,25:
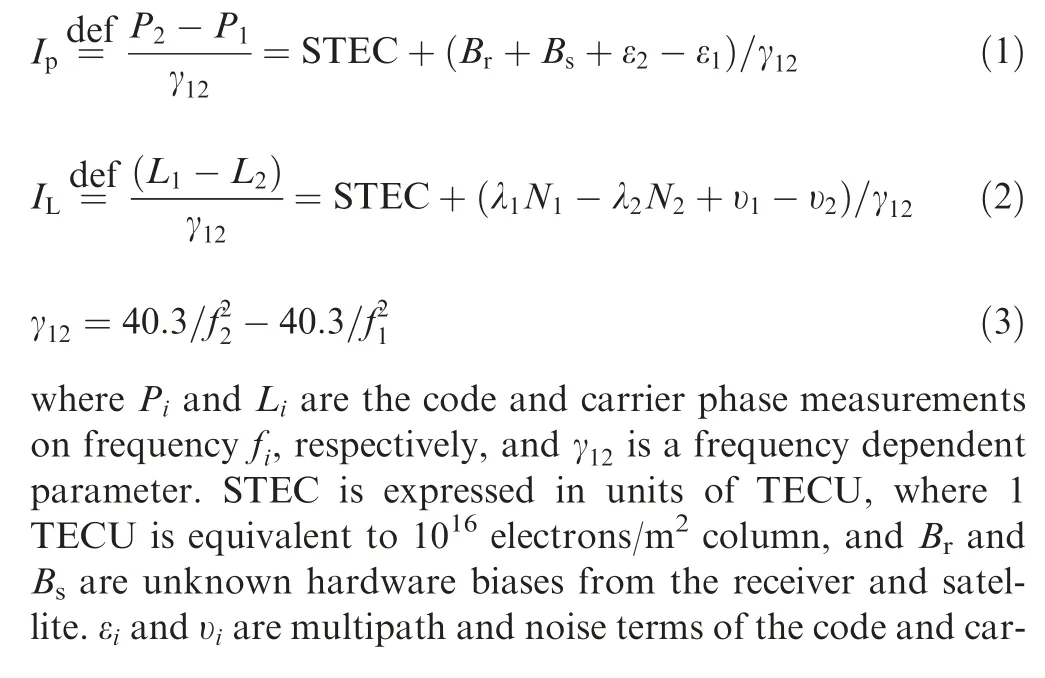
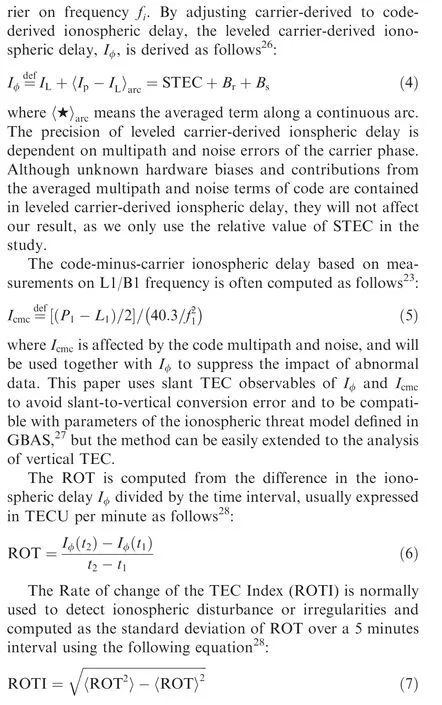
3.2. Rolling barrel and Savitzky-Golay filter
An improved rolling barrel algorithm is applied to each consecutive leveled TEC arc to find the occurrence time of potential TEC depletions. The basic algorithm finds a number of contact points by rolling an imaginary cylindrical barrel on an ionospheric delay time series to skip over depletions. At each time the algorithm takes the previously determined contact point as the pivot point, and then the angular distance between the barrel’s edge and the following data points within a time interval is computed as follows18:
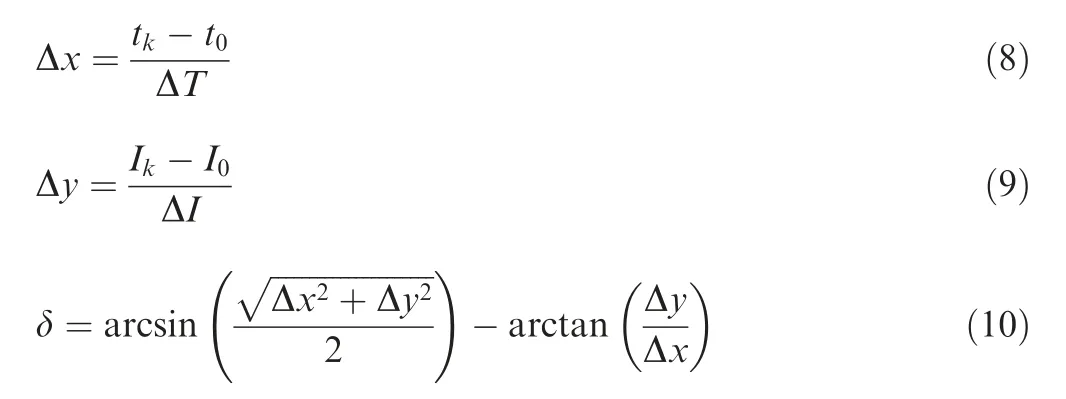
where I0is the TEC value at the current time t0,Ikis the TEC values at time tkwithin a predetermined time span, which can be set larger than the duration scale factor ΔT,and ΔI is a TEC scale factor adjusted according to the interested bubble depth.For instance, if depletions of short durations are concerned,ΔT can be decreased;thus,data points within a shorter period would be included as candidates of contact points. The TEC scale factor can be increased if we are interested in bubbles of larger depths.
Then, the newly found contact point with the minimal angular distance is used as the new pivot point for the next iteration. By rolling the barrel from the start to the end epoch of a TEC consecutive arc,the algorithm will identify a number of contact points and skip any data gap due to either an actual plasma bubble or abnormal data. Based on these identified contact points, a Savitzky-Golay filter17is used to derive a smooth TEC trend. Data gaps with durations greater than ten minutes are selected as TEC depletion candidates for further analysis, whose occurrence time, duration and depth are automatically recorded.
Several improved techniques are used to screen depletions candidates, and verify they are truly linked to EPBs rather than other phenomena such as Traveling Ionospheric Disturbance (TID) or abnormal data.
First, ROT and ROTI around the depletion candidates are screened because they are good indicators of ionospheric irregularities and EPBs.28The difference between 95% and 5% of the absolute value of ROT is compared with 0.85 TECU/min,18and ROTI is evaluated against 0.5 TECU/min.22
Second, dual rolling-barrel algorithms are implemented based on Iφand Icmc. The depths from Iφand Icmcare computed and compared with the each other to ensure they are consistent. The depth derived based on Iφshould be more accurate but susceptible to cycle slips; nevertheless, the depth based on L1-only Icmcis less accurate yet more robust.
Third,the magnitude of depth is compared with a threshold of 4-5 TECU to exclude the impact of traveling ionospheric disturbance. It was observed that the amplitude of Large-Scale Traveling Ionospheric Disturbance (LSTID) was between 0.6 and 2.0 TECU,29and that of Medium-Scale Traveling Ionospheric Disturbance(MSTID)was 1 TECU.30However, the magnitude of depth due to EPBs could be generally larger than 10 TECU during low solar activity and 40 TECU during high solar activity.3,31
In the end,the occurrence time,duration and depth of TEC depletions are obtained after the improved screening.
3.3. Velocity estimation
Once the TEC depletions are derived,the drift velocity of EPB could be estimated by using depletions and ROTs from 3 triangular receivers. The idea is based on the spaced-receiver technique which is widely used to estimate zonal irregularity velocity.22
Assuming that the plasma bubble is drifting with a linear wave front at a constant speed, similar TEC depletion characteristics will be observed at spatially distributed receivers when the bubble passes through them.Then the front velocity can be estimated by using the distances among the IPPs and times lags corresponding to the locations when the characteristic point of the TEC depletion is observed.
The time lag is determined by computing cross-correlation between two TEC depletion signals as follows:

where xnand ynare derived similar TEC depletion signals or ROTs at two spaced receivers.
At least 3 non-collinear receivers are needed to compute the velocity and direction of EPB,and it is preferable that 2 of the 3 receivers are aligned approximately along the geomagnetic equator which is the most probable drift direction of EPBs.Based on the geometrical locations of the IPPs corresponding to the receivers, the normal direction and apparent velocity of the wave front can be estimated by solving the following equations22:
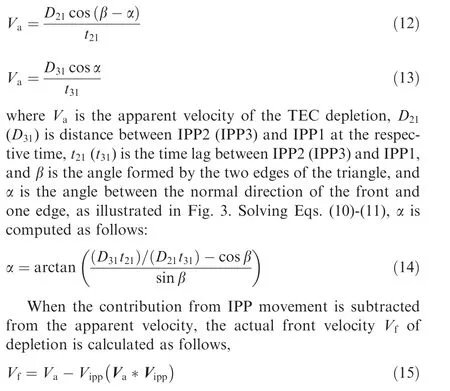
where Vais apparent velocity vector of the TEC depletion,Vippand Vippare IPP velocity expressed in the scalar and vector forms.
Traditional methods rely on manual identification of characteristic points over 3 stations to determine time lags, which are usually visually determined via laborious efforts.22Nevertheless, our method computes time lag by cross-correlation of identified depletion signals, whose occurrence time and duration are automatically determined in the previous step.In addition,both depletions and ROTs of the same period are used to cross check the velocity. Only when the difference between time lags based on depletions and ROTs is within a threshold can the derived velocity be considered valid for the EPB.
3.4. Width and gradient calculations
The gradient is defined as the steep slope within the TEC depletion. Taking two IPPs of leading and trailing points at a slope inside a depletion corresponding to t and t+Δtwg,the gradient can be obtained as follows:
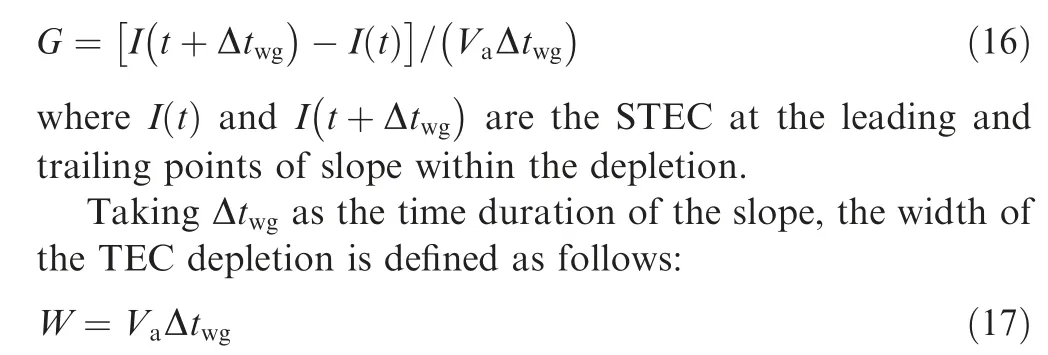
As the width and gradient are computed based only on the relative TEC variation, the accuracy is free of impact from hardware biases and small scale disturbance.
4. Results
4.1. Detection of depletion signal
GNSS data received at HKSL station on 15 August 2018 are used for illustration of the automatic detection of TEC depletions. The paper uses the relative value of ionospheric delay,which is a combination of slant TEC combined with an arbitrary bias because we only care about the relative change.The temporal and spatial features of STEC and the identified depletions of two satellites are presented in Fig. 2.
Fig. 2(a) shows the code-minus-carrier ionospheric delay Icmc, leveled carrier-derived ionospheric delay Iφ, TEC trend and elevation angle of GPS PRN21. Plasma bubbles caused the first obvious depletion (denoted as Depletion 1) from 20.80 LT (Hong Kong Local Time=UT+8 h), and then,a recovery followed when the satellite-receiver ray paths no longer passed through the bubble. After the recovery of the first depletion,a second TEC depletion(Depletion 2)appeared from 22.08 LT.As shown in Fig.2(c),by using the rolling barrel algorithm,the two depletions are detected:the first one with a maximum depth of 4.3 TECU occurring from 20.80 LT to 21.70 LT,and about 24 minutes later,another one with a maximum depth of 8.0 TECU from 22.08 LT to 22.62 LT. ROT and ROTI within and near the depletion show levels of significant disturbance when compared to the outside depletion.ROTI of greater than 0.5 and 1 TECU/min are detected.According to the IPP track of GPS 21 presented in Fig. 2(e),the locations of the TEC depletions span from geographic latitudes 17°N to 22°N when the satellite moves southward.
Figs.2(b),(d)and(f)show similar results from BDS 13,an Inclined Geosynchronous Satellite Orbit (IGSO) satellite of BDS-2 constellation.As shown in Figs.2(b)and(d),three consecutive TEC depletions of 7.9, 10.0 and 9.5 TECU are detected, which might be related to the quasi-periodic occurrence of plasma bubbles which had been reported by in-situ satellite observations32,33.During the periods of three depletions, i.e., from 20.68 LT to 21.43 LT (Depletion 1), from 21.77 LT to 22.59 LT (Depletion 2) and from 22.60 LT to 23.41 LT (Depletion 3), the magnitudes of ROTI grow to be greater than 0.5 TECU/min. As shown in Fig. 2(f), the locations of the depletion span from geographic latitudes 15°N to 21°N, when BDS 13 moves southwestward with the elevation decreasing sharply from 50 to 15 degrees. After examinations of TEC from other satellites, it is found that the rolling barrel algorithm can detect depletions from 10 satellites on this day. The depletions usually occur after sunset with a duration of several tens of minutes, which is a typical feature near the northern crest of the anomaly during the low solar activity year 2018.3,15The example case showed that the rollingbarrel algorithm could detect depletions with automatically determined parameters of depth, occurrence time and period.Moreover, the advantage is that the parameter of depth is impacted little by wave disturbance when compared with traditional methods like the polynomial fit technique.18
4.2. Estimations of front velocity
The plasma bubble drifts zonally and vertically when it appears at the bottom side of F region,34,35then it is observed successively by a number of nearby receivers. Taking GPS 21 as an example, Fig. 3(a) presents a similar pattern visible in the slant TEC data at HKSL, T430 and HKKS stations. A small oscillatory wave like pattern is also visible inside the TEC depletions. As shown in Fig. 3(b), these three receivers form a triangle, and the distances of the three edges are 25.5,39.5 and 22.7 km for the three receivers. The triangular stations observe a similar TEC depletion structure when the same plasma bubble sweeps from HKSL to T430 and lastly to HKKS.
Assuming that the plasma bubble is drifting with a linear wave front at a constant speed, the drift velocity and normal direction of the front can be derived using the TEC depletion signal of GPS PRN 21 at three stations as shown in Fig. 4(a).Cross correlation based on TEC depletion is computed and illustrated in Fig. 4(b). The time lags are about 20 epochs between HKSL and HKKS stations and 15 epochs between HKSL and T430 stations, where 1 epoch equals 30 seconds for the sample.
As ROT inside and near the bubble varies significantly in a similar pattern,cross correlation of ROT may be calculated to validate the time lags. The ROTs of GPS PRN 21 at these three receivers are shown Fig.4(c).The derived time lags from ROT are 20 epochs between HKSL and HKKS and 15 epochs between HKSL and T430 respectively as shown in Fig. 4(d).The consistent results based on the depletion signal and ROT confirm that the time lags can be computed robustly using cross correlation.
Once the time lags are obtained, by solving Eqs. (12)-(14),the apparent drift velocity and azimuth of the wave front are derived to be 57 m/s and 60 degrees relative to the geographic north.
In order to verify that the front velocity is correct, another group of triangular stations,i.e.,HKCL,HKKT,and HKQT,is processed, and the front azimuth of velocity 59 m/s and 61 degrees are estimated. The consistent results confirm that the drift velocity and direction of the front are relatively stable across the selected stations.
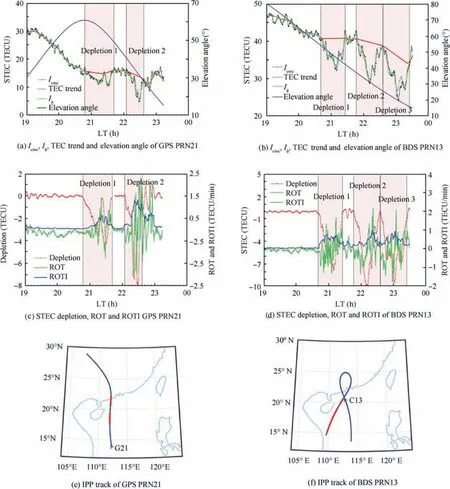
Fig. 2 STEC depletion, ROT and ROTI at HKSL station on 15 August 2018 (DOY 227).
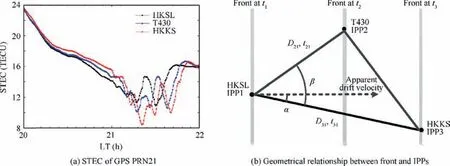
Fig. 3 STEC and geometrical relationship at HKSL, T430 and HKKS on 15 August 2018.
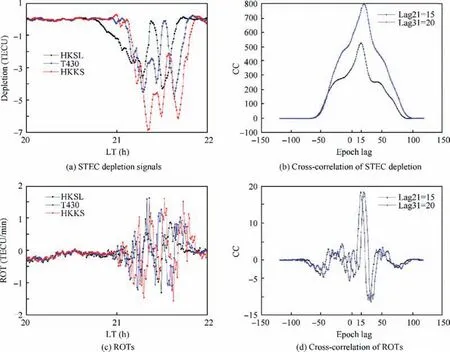
Fig. 4 Cross-correlation of STEC and ROT of GPS PRN 21 on 15 August 2018.
Considering that IPP moves to the azimuth of 184 degrees at the speed of 61 m/s,the IPP velocity is about 33-36 m/s projected in the reverse direction of the front drift, therefore the actual front velocity of 20-23 m/s is computed by using Eq. (13).
The derived velocity is a relatively lower value. Previous studies found that the drift velocity is dependent on solar radio flux,geomagnetic activities,season and local time.11The statistics of average pattern over all seasons from the C/NOFS satellites measurements reported that zonally drift velocity could range between 15 and 60 m/s in four local times near the solar minimum. Additionally, the drift velocity increases with the solar flux. On 15 August, 2018, the geomagnetic activity is quiet (Kp less than 2 and magnitude of Dst less than 10 nT).Because the year 2018 is near solar minimum, we consider the lower value of drift velocity may be related to the environmental condition during the low solar activity.
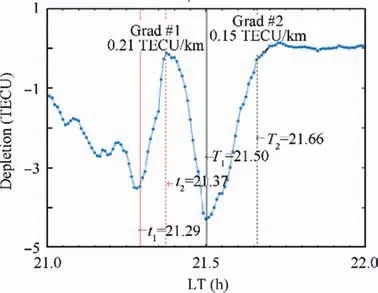
Fig. 5 Two gradients determined from STEC depletion of GPS PRN 21 at HKSL on 15 August 2018.
4.3. Estimations of width and gradient
When the front drift velocity is determined,based on the TEC depletion signal from GPS PRN 21 at HKSL station, we calculate the widths and gradients of two slopes, the first one starting from 21.29 LT(t1)to 21.37 LT(t2),as denoted by vertical red solid and dotted lines in Fig. 5, and the second from 21.50 LT (T1) to 21.66 LT (T2), as denoted by vertical black solid and dotted lines, respectively. Using Eqs. (16) and (17),the first gradient (Grad #1) of 0.21 TECU/km (34 mm/km)with a width of 15.3 km, and the second gradient (Grad #2)of 0.15 TECU/km (24.3 mm/km) with a width of 32.3 km are determined.

Fig. 6 STEC and gradient of GPS PRN 21 on 15 August 2018 at HKSL and T430 stations.
The station-pair technique is commonly used to compute the gradient. Gradients are determined by dividing the TEC difference of two receivers by their distance.It should be noted that any error in the hardware biases (Br) and TEC disturbances would be directly translated into the gradient error estimated by the station-pair. Here, we use the station-pair technique based on the data of 2 closely spaced stations HKSL and T430 with a distance of 25.5 km. It is assumed that the mean ionospheric difference outside the bubble is zero to remove the impact from hardware bias. As shown in Fig. 6(a), the first gradient (Grad #1) grows to 0.10 TECU/km(16.2 mm/km) at 21.37 LT (No.1), and after that epoch, the gradient gradually increases to the local maximum of 0.13 TECU/km (21.1 mm/km) at 21.43 LT (No.2). The second one (Grad #2) grows to a maximum of 0.16 TECU/km(25.9 mm/km) at 21.63 LT (No.3). As shown, Grad #2 with a value of 0.16 TECU/km is consistent with the value of 0.15 TECU/km derived by the proposed method in the paper.Grad #1 (No.1) is significantly smaller than 0.21 TECU/km.This can be explained from the leveled carrier derived TEC of GPS 21 at HKSL and T430 stations shown in Fig. 6(b).The period of Grad #1 at HKSL is denoted by vertical red solid and dotted lines, and that of Grad #2 by vertical black solid and dotted lines. The two red curve lines denote STECs from HKSL and T430 as shown in Fig.6(b),and they indicate that the periods of HKSL and T430 impacted by Grad #1 do not overlap in the time domain. When Grad #1 impacts HKSL,it has not reached the location of T430;however,a significant disturbance preceding the gradient impacts T430;thus,it leads to a decreased maximum(No.1)of Grad#1.The gradient at 21.43 LT (No.2) occurs during the period (vertical green solid line in Fig. 6(b)) of another slope, and is outside the period of Grad #1. For Grad #2, the periods of HKSL and T430 impacted by the slope overlap partly from 21.63 LT to 21.66 LT during the period (vertical solid and dotted black line), therefore the gradients from the station-pair technique and our method are consistent.
As noted, the gradient derived from the station-pair varies significantly because there are complex irregularities inside the depletions, which were also suggested by other researchers.13,20,36This is because in order to obtain actual gradient of the slope, the station-pair relies on two assumptions,i.e.,temporal variation of the EPB morphology and geometrical relationship between the slope and station baseline.Basically, both the station-pair and our method depend on the assumption that the EPB morphology is frozen during the short time when the plasma bubble moves between receivers, and it is usually true over a short period such as several minutes. In addition, the station-pair method relies on the assumption that the periods of two stations impacted by the slope partly overlap in the time domain, and then, the IPPs of both stations have the chance to be located on the same slope. Otherwise, if the periods do not overlap, the gradient from the station-pair method would be a mixture of one slope and another.The assumption can be hold true or false depending on whether the baseline length is smaller or larger than the width of slope. In other words, it requires that the baseline length should be shorter than the width of slope when applying the station-pair technique.
However,our method relaxes this restriction.As long as the morphology of EPB is frozen over a short time, correlation analysis using 3 triangular stations can be successfully conducted to obtain the velocity by our method.Then the gradient of slope can be estimated based on the TEC depletion signal from one station. Our method has the main advantage of applying to a situation even when the periods of the stations impacted by the slope do not overlap.The advantage is favorable when studying slopes of small-scale sizes using stations of longer baselines.
In the above example,our method can be used for baselines between 22.75 and 39.5 km to estimate Grad #1 with a width of 15.3 km and Grad#2 with a width of 32.3 km.When applying the station-pair method to a baseline length of 25.5 km between HKSL and T430, Grad #1 is underestimated because the slope with a smaller width leads to a mixture of the first slope and small-scale disturbance, while Grad #2 is consistent with our method for slope with a larger width than the baseline length.
It should be noted that in the above discussion, we neglect the difference between the drift direction of plasma bubble and the baseline direction of station-pair.This is valid in the example case, because the difference of directions is so small that they can be safely neglected.However,when they are different,the baseline should be projected to the drift direction of plasma bubble to determine the effective length.
5. Conclusions
This paper developed a robust method to automatically identify TEC depletion and derive its parameters related to ionospheric threat when applying GBAS at low latitudes.
(1) The TEC depletion signal is detected by processing leveled carrier-derived TEC using the rolling barrel algorithm and Savitzky-Golay filter.Then,the time lags and front velocity are estimated based on cross-correlation using three triangular receivers. Lastly, the width and gradient of slope are derived using the slant TEC depletion of a single receiver by considering that its drift velocity is constant in a short period.
(2) The method is illustrated using GPS and BDS measurements from stations of Hong Kong at low latitude on 15 August, 2018, in a solar minimum cycle. The time lags are compared by cross-correlation calculations of depletion and ROT with a group of triangular receivers. The velocity is cross-verified by use of another group of receivers. The gradient is compared with that derived by station-pair techniques.
(3) This paper demonstrates that by using an improved rolling barrel algorithm, the proposed method could automatically identify TEC depletion and its parameters of occurrence time, duration and depth. The basic algorithm is improved by several techniques, which consist of ROT and ROTI test, dual rolling-barrel implementations, and checking of depth.
(4) The method of estimating the velocity relies on automatically identified depletion signal and ROT rather than manually identified characteristic points in the traditional method. Additionally, the method computes dual time lags based on cross-correlation of the depletion signal and ROT.The dual time lags are checked to be consistent to ensure that the derived velocity can be considered valid.
(5) Both the station-pair technique and our method depend on the assumption that the EPB morphology is frozen during the short time when the plasma bubble moves between receivers. Nevertheless, our method relaxes the restriction that the baseline length should be shorter than the width of slope required by the station-pair technique. This relaxation is favorable for studying smallscale slopes of depletions using stations of longer baselines.
Future work will focus on applying this method to determine the statistics of plasma bubbles based on GNSS data.
Declaration of Competing Interest
The authors declare that they have no known competing financial interests or personal relationships that could have appeared to influence the work reported in this paper.
Acknowledgements
The contribution of data from IGS, MGEX, and Survey and Mapping Office of the Lands Department,Hong Kong Special Administrative Region is greatly appreciated. The work was carried out with financial support from National Key Research and Development Program of China (No. 2017YFB0503404),the National Natural Science Foundation of China (Nos.61871012,U1833125),Open fund project of Intelligent Operation Key Laboratory of Civil Aviation Airport Group (No.KLAGIO20180405), The National Key Research and Development Program of China (No. 2018YFB0505105), and Beijing Nova Program of Science and Technology (No.Z191100001119134).
 CHINESE JOURNAL OF AERONAUTICS2021年5期
- CHINESE JOURNAL OF AERONAUTICS的其它文章
- Ferrofluid moving thin films for active flow control
- Preliminary study on heat flux measurement data of TT-0 flight test
- An analysis and enhanced proposal of atmospheric boundary layer wind modelling techniques for automation of air traffic management
- Jet sweeping angle control by fluidic oscillators with master-slave designs
- Hot deformation behavior and microstructure evolution of the laser solid formed TC4 titanium alloy
- Electrochemical trepanning with an auxiliary electrode
