Jet sweeping angle control by fluidic oscillators with master-slave designs
Ziyan LI, Kaiwen ZHOU, Yingzheng LIU, Xin WEN,*
a Key Lab of Education Ministry for Power Machinery and Engineering, School of Mechanical Engineering, Shanghai Jiao Tong University, Shanghai 200240, China
b Gas Turbine Research Institute, Shanghai Jiao Tong University, Shanghai 200240, China
KEYWORDS Adjustable spreading angle;CFD;Fluidic devices;Master-slave fluidic oscillator;TR-PIV
Abstract The fluidic oscillator is an instrument that can continuously generate a spatially sweeping jet entirely based on its internal geometry without any moving parts. However, the traditional fluidic oscillator has an inherent limitation,that is,the spreading angle cannot be controlled independently, rather by the jet volume flow rate and internal geometry. Accordingly, two types of fluidic oscillators based on the master-slave design are developed in current study to decouple this correlation. In both designs, the master layer inherits the similar oscillation mechanisms of a sweeping jet,and the slave layer resembles a steady jet channel.The difference between the two designs is that Design A has a short diverging exit in the slave layer,but Design B adds a long interaction chamber in the exit channel to intensify flow instability. The external flow fields and governing oscillation properties of these two designs are experimentally explored with time-resolved Particle Image Velocimetry(PIV),while the internal flow dynamics and driving oscillation mechanisms are numerically investigated. By fixing the total volume flow rate, the jet spreading angle of Design A can be increased smoothly from 0° to above 100° by increasing the proportion of master layer’s flow rate from 0 to 100%.For Design B,the control authority of the master layer is significantly enhanced by adding the interaction chamber in the slave layer.In addition,the added chamber causes notable jet oscillation even when the master layer has none input.
1. Introduction
Fluidic oscillator, also called sweeping jet actuator, is a device that can continuously issue oscillatory jet without any mechanically moving parts.Due to its excellent scalability and integration, large frequency bandwidth, robustness in severe environments, and intrinsic oscillatory nature, this instrument has been attracting the increasing interest of scientists and engineers in the flow control1-3and heat and mass transfer enhancement fields.4,5Recent decades have witnessed its successful and wide range applications in issues like separation control,6-13cavity noise suppression,14,15bluff body drag reduction,16-18combustion control,19heat transfer enhancement,4,5,20,21mixing enhancement,22,23jet impingement24-27etc. Especially, several impressive novel designs28,29are developed recent years, which further broaden the application scenarios of traditional fluidic oscillators. Though, the most commonly used wall-attachment fluidic oscillator (see Fig. 1)has some marked intrinsic properties, which possibly limit its wider applications. In the aforementioned occasions, the impact region of the sweeping jet is directly decided by the jet spreading angle.However,the spreading angle is frequently reported to be closely related to jet flow rate (though not linearly) and internal geometry.25,26,30This implies that, in order to render the spreading angle adjustable to various control targets, it has to always change the flow rate or even replace the existing oscillator by a new shape,which is impracticable in the most applications. Therefore, the decoupling of spreading angle from volume flow rate and oscillator geometry for the wall-attachment fluidic oscillators is significantly critical for sweeping jet actuators to compete with other flow control technologies, such as plasma actuator,31vortex generator32and synthetic jet,33just to name a few.
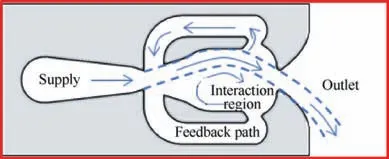
Fig. 1 Sections of traditional fluidic oscillator.
As another critical parameter, the oscillation frequency is also repeatedly reported to be linearly related to jet volume flow rate.30,34-36Considerable explorations have been made to decouple frequency from volume flow rate. An intuitive approach is with the aid of external forces,37-40which can be more direct and controllable. Gregory et al.37,38designed a variable-frequency fluidic oscillator driven by piezoelectric devices. The oscillator shows an operating frequency up to 1.2 kHz and a good modulation level under the piezo resonance frequency.It’s declared that this method can be an alternative to synthetic jets and plasma actuators on occasions where high momentum is required for control authority.However,the modulation level decreases a lot at the high operating frequency. Gregory et al.39invented a fluidic actuator that combines the arbitrary driving frequency property of plasma actuators and the high momentum property of fluidic actuators.Not only the decoupling of frequency is fulfilled,but also the advantages of two types of actuators are retained. However,high-voltage and high-frequency power source is required in this design. Culley40designed a variable frequency fluidic diverter actuator with one inlet, two separate outlets and two control ports. By means of a programmable microcontrollerbased drive circuit or signal-generator-based digital circuit,it’s very simple to achieve the flip-flop effect between the two discrete outlets, and hence the oscillatory jet with variable frequency at constant flow rate can be obtained. Though, this method fulfills the decoupling of frequency, the discrete exits render the jet’s motion non-continuous in the spatial domain,let alone the decoupling of spreading angle. Since these attempts rely on the external excitation,this category of design can be more regarded as an‘‘impure”fluidic oscillator.To sum up, with the help of external excitations, the actuators can show a more effective modulate property in a wider range of frequency. However, also due to the intervention of external forces,the superiority of fluidic oscillators to other commonly used actuators, e.g. the simplicity, robustness and integrity,gets almost completely lost.
The above drawbacks have diverted people’s attention to actuators which are still solely based on fluid mechanisms,41-43and the device developed to follow the conception can hence be reckoned as a ‘‘pure” fluidic oscillator (what rates a mention here is that the actuator is historically called fluid-ic just due to its design totally originating from fluid logics44). In order to decouple oscillation frequency from mass flow rate,Bettrich and Niehuis41used a two-layer construction, where the bottom layer is the traditional fluidic oscillator and the top layer is a steady flow channel.Working fluid is introduced from the feedback channels of the bottom layer and then passed on to the sides of the main flow in the top layer. Since the flux in feedback channels varies with time, the side force exerted on the main flow also varies, and hence the oscillation generates.High operating frequency up to 8 kHz is achieved to make this Design A candidate for triggering boundary layer transition. However, this design adopts a discrete exit design,which makes the issued jet discontinuous in spatial design,and hence the decoupling of spreading angle can’t be achieved at all. Tomac and Sundstro¨m43also used the layered construction,but they used a steady jet in the master layer and a sweeping jet in the slave layer, thus obtaining the adjustable frequency property at a constant flow rate. However, by increasing the proportion of master flow rate in total flow rate,the jet spreading angle is quickly reduced, and after a threshold, the master layer loses control of the jet spreading angle.
In all, the previous efforts are mainly devoted to the investigations on the frequency decoupling. With respect to the spreading angle, to the best knowledge of the authors, so far there has been only a little attention specially devoted to decouple it from jet volume flow rate. Only recently, Tomac and Sundstro¨m45proposed a design to control the spreading angle by injecting external steady jet at the throat.They found that the spreading angle has an inverse relationship with the magnitude of the external control jet. In addition, in order to produce notable control effect, the control jet needs to be adequately strong.Hence,without no exaggeration,the decoupling of spreading angle from the flow rate in a more efficient way is not a trivial problem and is directly relevant to applications in heat transfer and mixing enhancement fields.
To this end, the paper draws lessons from the practice of decoupling frequency, and accordingly develops two types of fluidic oscillators specially designed to decouple spreading angle from volume flow rate. Time-Resolved Particle Image Velocimetry (TR-PIV) technique is employed to investigate the detailed external flow fields and governing oscillation characteristics.In combination with the extracted velocity and turbulence information of the emitted external jet,a fundamental understanding can be gained on the two actuators’ distinct potential applications. Meanwhile, to gain an insight into the internal flow dynamics and driving mechanisms,the Computational Fluid Dynamics (CFD) simulation is also performed.
2. Experimental and data processing methods
2.1. Geometry structure of the master-slave oscillator
Fig. 1 illustrates the internal structure and basic flow mechanisms of traditional wall-attachment fluidic oscillators. The reason for generating an oscillatory jet without the aid of mechanical parts is often stated as follows. When the pressurized working fluid enters into the interaction chamber, it will arbitrarily attach to the island at one side due to the Coanda effect, i.e. the flow attachment to solid surfaces.46-48Then the flow is bifurcated by the splitter.One part of the fluid goes out into the external environment to become an impinging jet,and meanwhile another part is directed into the feedback channel and flows back to the root of the injected fluid.This part of the flow will evolve into a big vortex between the island and main flow. As the so-called separation bubble grows adequately strong, the main jet will flip over to another side. At the same time, the ejected fluid will also turn to another direction, finishing a half cycle of oscillation. Next is to repeat the above process and achieve a sweeping motion continuously in time domain.
Given that the flow rate in feedback channels consecutively varies with time,it’s inspired to have this part of fluids become the‘‘actuator”that excites the oscillation of a steady jet.Then it’s not surprising to design the two-layer constructions as displayed in Fig.2(a)and 2(b).Both the bottom layer in Fig.2(a)and 2(b), which is named the master layer, essentially resembles the shape of the traditional fluidic oscillator in Fig. 1,except for the discrete-exit design so as to more smoothly guide the outflow into two control ports.The top layer is named the slave layer, which comprises a main flow channel where a steady jet is emitted, and two control channels which are separately connected to the aforementioned control ports in the master layer. Apparently, it’s the control ports locating at the two sides of the main flow channel that provide the motivation of oscillation and turn a steady jet to an oscillating one.What truly distinguishes Fig. 2(b) from Fig. 2(a) is that the outflow channel of Fig.2(b)adds a long cucurbit-like chamber in order to increase the flow instability in the slave layer,42the shape of which just derives from the interaction chamber of the traditional fluidic oscillator (see Fig. 1). The exit throats of both of these two master-slave designs are rectangles of 10 mm×2.5 mm. Therefore, the exit’s aspect ratio is 4, and actually,from the authors’practical experience,a bigger aspect ratio contributes a lot to the steadiness of oscillation.
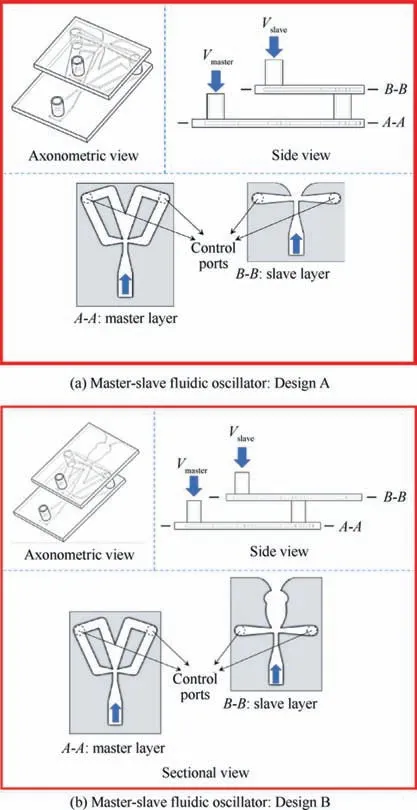
Fig. 2 Sections of two types of novel master-slave fluidic oscillator.
2.2. Experimental apparatus
As shown in Fig.3,the experiments were conducted in a transparent water tank which has enough space to avoid any potential sidewall effects on the free jet. A transparent glass sheet was fixed on the top of the experimental instruments and immersed into the water to prevent the light scattering caused by water surface fluctuations.The master and slave inlets were connected to two non-intersecting flow passages supplied by a mutual pump. Two identical flow meters with an uncertainty level of 2.5% were used to measure the volume flow rates of the master and slave inlet separately. By controlling the flow rate, the corresponding Reynolds number Re, based on the hydraulic diameter of the slave layer throat Dhand jet velocity at the throat USJ, ranges from 3893 to 5191. The origin of the coordinate system is set at the middle point of the exit plane;the x-axis points to the streamwise direction and y-axis the transverse direction, as shown in Fig. 3.
The external flow fields of the actuators were measured by a TR-PIV system.Glass beads with diameter d ≈20 μm and density ρ ≈1050 kg/m3were evenly seeded throughout the water tank as tracer particles. A 5 W continuous laser (MGL-N-532a-5w,CNI)was utilized to illuminate the tracking particles with a 2-dimensional 1 mm thick laser sheet.A high-speed camera (Dimax HS4, PCO.) was used to capture the illuminated region. The frame rate was set at a constant value of 4000 Hz, which can well resolve the particle movement within a not wide range of Reynolds numbers and ensure the movement of a particle between two adjacent images is less than one-fourth the interrogation window. The exposure time was fixed at 50 μs to guarantee sufficiently bright snapshots and meanwhile avoid the trailing of particles.A PIV software package, Micro-Vec (PIVTec, China), which combines a multigrid cross-correlation technique and subpixel recognition by Gaussian fitting,was used to calculate velocity vector fields from the two adjacent particle images.The interrogation window to calculate the cross-correlation was set as 32×32 pixels with a 50% overlap in order to guarantee 6-10 particles in each window, which results in a spatial resolution of about 2 mm in the free jet velocity fields. Based on the above principles, the measurement uncertainty is estimated not to surpass 1%.49
2.3. Data processing methods
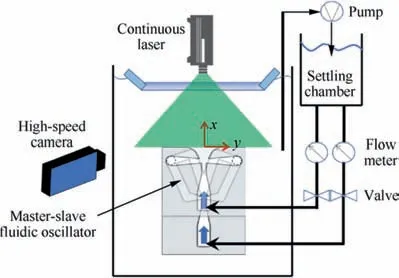
Fig. 3 Sketch of experimental setup.
For a turbulent flow containing ordered structures, the first priority after obtaining experiment data should be given to the triple-decomposition of data, so as to find the coherent organized patterns. The triple-decomposition process50is displayed as:
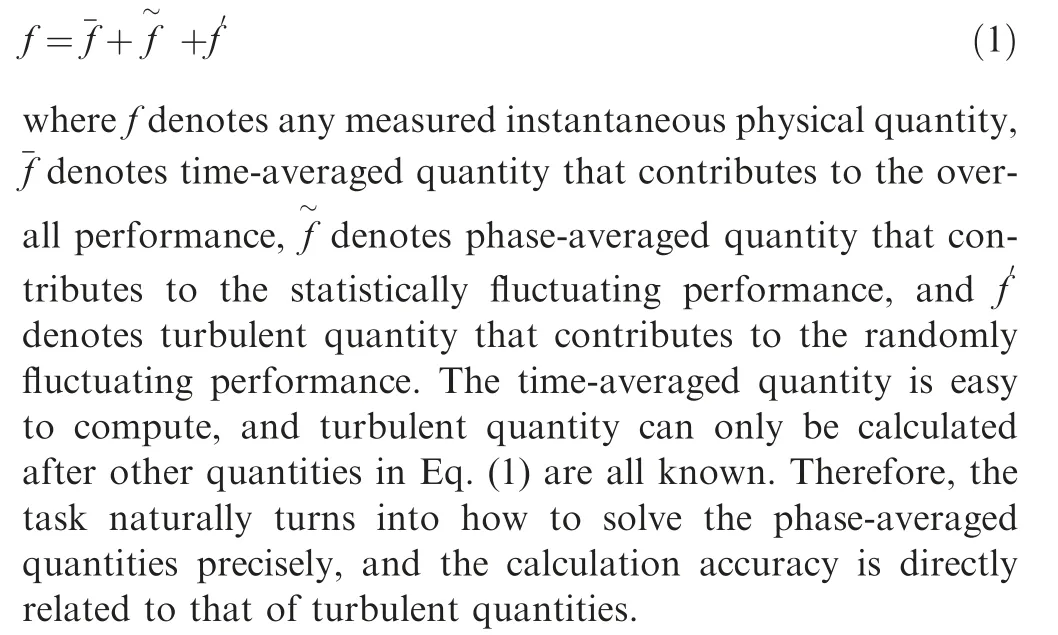
For the signal-based problems, such as synthetic jets, it’s direct to acquire the phase information from external excitations, and hence the phase-averaged process is natural and simple. However, the fluidic oscillators are solely based on fluid motions and without any external reference signals.Therefore, the phase-averaging process of fluidic oscillators can only rely on experimental or numerical data themselves,or in other words, it’s a data-driven process.
In this paper, the phase-averaging process (see Fig. 4) is performed as follows: first, extract the time-resolved velocity signal between two symmetry points in the flow fields and find the difference between these two signal sequences; second,apply a low-pass filter to the difference signal in order to obtain a cleaner signal; third, perform cross-correlation between the above clean signal and its fragment, and where the correlation coefficients cross the zero horizontal line marks the 0° phase and 180° phase and the remaining phases are acquired by interpolation; forth, do phase-averaging on the instantaneous flow fields according to the phase information;finally, relabel the phase-averaged flow fields based on actual physical meanings.Herein,the zero phase is arbitrarily defined as the instant when the jet deflects to the left-most position.The above-mentioned method is found to be the most promising and accurate compared to other methods like Proper Orthogonal Decomposition (POD) and Hilbert transformation in phase-averaging process of a fluidic oscillator.51Similar work and details can also be found in the authors’ previous papers.25,30In this step, around 12,000 velocity fields are distributed to 120 phases and averaged to eliminate the stochastic fluctuations, which is more than sufficient to ensure the convergence of the averaging process.51Here, it’s worth mentioning how to extract the jet spreading angle θspreadfrom the phase-averaged flow fields.The jet deflection angle θ is defined as the arc tangent value of spanwise velocity over streamwise counterpart at a point where its overall velocity magnitude peaks along the entire arc close to the jet exit (refer to Fig.4,the notation in the‘‘phase averaging”step).The deflection angle θ oscillates between the minimum and maximum,which indicates the most left and right deflected positions,respectively. Therefore, the difference of the above two limits,namely the spreading angle θspreadcharacterizes the jet spreading range in a period.
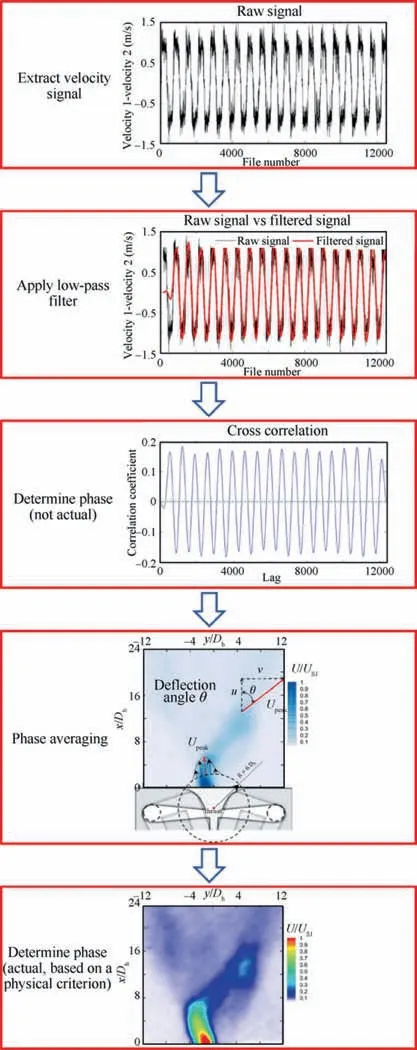
Fig. 4 Data processing methods.
In order to reveal the quantitative fluid properties in the near exit field, the velocity values along arcs of R=5Dh,8Dh, and 11Dhare extracted for further postprocessing, as shown in Fig.5.Since the directly measured values are on discrete square grid points,it’s necessary to interpolate these values onto points along arcs. An intensively used interpolation technique,i.e.Inverse Distance Weighting(IDW)algorithm,52is implemented. With regard to the details of the implementation method, please refer to the authors’ previous work.25
3. Computational fluid dynamics settings
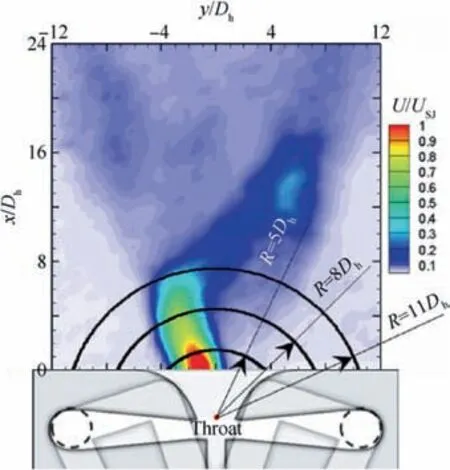
Fig. 5 Schematic diagram of arcs of 5Dh, 8Dh and 11Dh where quantified properties are extracted.
Although the experiments are helpful to fully dig into the external flow dynamics of the ejected jet and its impact regions,they can be powerless to reveal the internal flow fields for the large area of shadow produced by the laser sheet inside the actuator.Above difficulty in PIV experiments forced us to turn to CFD for help.
As shown in Fig. 6, the commercial mesh generator ANSYS ICEM CFD is applied to generate the structured mesh inside and outside the oscillator. The near-wall mesh is thickened to enable the dimensionless first cell height y+to approximate unity.
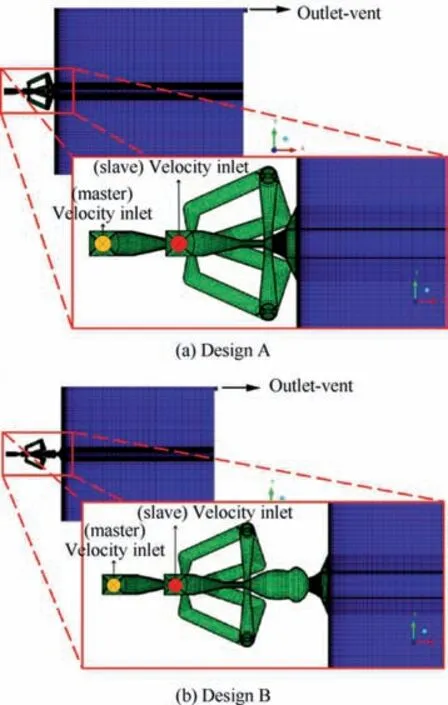
Fig. 6 Mesh generation and boundary conditions.
The mature commercial CFD code ANSYS Fluent is used to solve the 3-dimensional,unsteady Navier-Stokes equations.The turbulence model is Detached Eddy Simulation (DES)model, which combines Reynolds-Averaged Navier-Stokes(RANS) model inside the boundary layer and Large Eddy Simulation (LES) model outside the boundary layer, thus achieving the trade-off between calculation accuracy and time-consumption. The velocity inlet boundary condition is assigned to the flow inlet, the value of which is based on the volume flow rates in the experiments, while the outlet-vent boundary condition is assigned to the flow outlet of the water tank.Rest surfaces are set as no-slip wall boundary condition.The time step size is set as 0.001 s to satisfy the Courant-Frie drichs-Lewy (CFL) condition, namely the Courant number C≈1.
The mesh independence verification of Design A is illustrated by Fig. 7. From the figure, it can be seen that when the total elements approach 1,177,528, the frequency result derived from numerical simulation gradually converges to the experimental result, so 1,177,528 elements are the final mesh of Design A for CFD calculation. Likewise, 1,196,224 elements are used for Design B. With respect to the numerical validation with experiment values, Table 1 demonstrates the typical case of MTR=0.67 for the two designs. The numerical results are found to agree well with the experimental counterparts.
4. Results
4.1. Qualitative external flow fields

Fig. 7 Mesh independence verification (the light blue band denotes the 5% error band).
Fig. 8 gives a first impression of the time-averaged flow effect of these two master-slave fluidic oscillators.From left to right,the proportion of master flow rate in total flow rate (abbreviated to‘‘MTR”in this paper,which is short for Master-Total-Ratio)increases from 0 to 1,but the total flow rate holds constant at a Reynolds number Re=3893. For Design A, the spreading area of the jet increases with MTR, so it can be inferred from the time-averaged flow fields that the jet may smoothly convert from a steady jet to a sweeping jet as MTR increases.It’s not beyond expectations,because as stated in the introduction part,the master layer has the mechanism of oscillation; that is to say, the rise in master flow rate can contribute to an enhanced jet oscillation. From another perspective, it can be deduced that if the master flow rate is held constant, the increase in slave flow rate will inevitably weaken the sweeping motion and hold the rigidity of the jet column.However, it’s not the totally same case for Design B. When MTR is 0, namely the master-slave oscillator only has flow input in the slave inlet and thus actually becomes a one-layer construction(see slave layer in Fig.2(b)),the ejected jet seems to oscillate slightly. It’s inferred to derive from the special cucurbit shape of the slave layer, which intensifies the flow instability. It is interesting to observe that the jet spreading angle of Design B is reduced by increasing MTR from 0 to 0.33, which is opposite to expectation. This implies that the weak flow from master layer suppresses the sweeping motion induced by the interaction chamber in the slave layer. When MTR continues to grow from 0.33,the trend becomes identical to that of Design A,that is,the larger the MTR,the wider the impact region.What’s more,the spreading angle of Design B is evidently larger than that of Design A, especially for the three cases of MTR=0, 0.5 and 0.67. Anyway, for both designs,the spreading angle varies in a large range at a constant flow rate, which means the jet spreading angle has been decoupled from volume flow rate.
Fig.9 clearly illustrates the trends of spreading angle θspreadversus MTR for two designs.In regard to Design A,the curve has a slow growth at first, and then experiences a steep rise to around 100° at MTR=1. In regard to Design B, the spreading angle drops a little at the beginning due to the slight unexpected oscillation at MTR=0, and then shows rapid and steady growth, likewise ending with a value of around 100°.What stands out in the figure is that the spreading angle of Design B is obviously larger than that of Design A, especially at intermediate volume flow rates,which is in accordance with the time-averaged flow effect in Fig. 8.
To further indicate the flow dynamics of sweeping motion,the phase-averaged velocity fields are displayed in Fig.10.For the sake of similarity in qualitative features, only the case of MTR=0.5 for Design B is plotted. Fig. 10 reveals that the sweeping jet stays longer in outer sides than the middle region,thus justifying the V-shape time-averaged impact regions as shown in Fig.8.Moreover,it can be seen that as the jet inclines to the leftmost position at t/T=0,a small vortex generates at the root(as indicated by the red hollow arrow).As time passes by, this vortex moves along the boundary of V-shape impact region (as indicated by the red dashed lines) and grows stronger due to the entrainment of the surrounding fluid. This phenomenon is reckoned to be strongly correlated with heat transfer enhancement, mixing enhancement and boundary layer separation control because the vortex intensifies the mass,momentum and energy transfer between the control fluid and target flow53.With regard to this case,an animation produced by techniques of the LIC streamlines54is provided in the supplementary material, which can give a more explicit evolution of the shear-layer-induced vortex and full-field streamlines in a period.
Not only the velocity,but the turbulence can,from the finescale mixing enhancement aspect,contribute to a better performance of jet impingement and flow control.53Fig. 11 displays the turbulence intensity of two designs at five different MTRs.Generally, the shapes of turbulence fields are similar to those of velocity flow fields. The increase in MTR will result in a broader but shorter turbulent fluctuation region (except for the case of MTR=0 for Design B). It’s noteworthy that the turbulence flow field of MTR=0 for Design A is not like that of a conventional steady jet,which has approximately zero turbulence in the jet core region.55Although for this case, no apparent dominant frequency is solved by Fast Fourier Trans-form(FFT)analysis,the above turbulence property reveals the jet is not a standard steady jet, let alone a sweeping jet. This phenomenon is deduced to result from the complex suddenexpanding exit of the slave layer (see Fig. 2(a)), which to a large extent deteriorates the jet core region.

Table 1 Numerical validation of oscillation frequency.
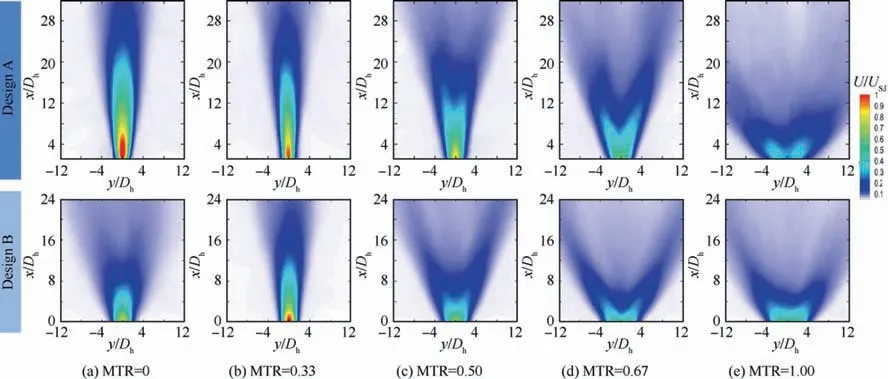
Fig. 8 Time-averaged velocity fields at fixed total flow rate.
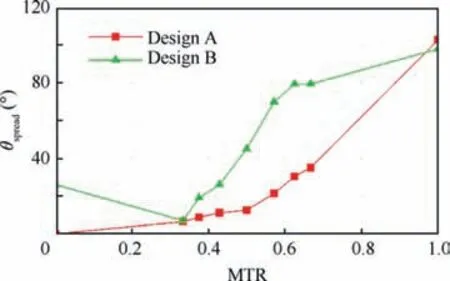
Fig. 9 Comparison of trends of spreading angle θspread versus master flow rate proportion MTR.
4.2. Quantitative comparison of flow properties
To better quantify the flow dynamics, the analysis of timeaveraged velocity and turbulence intensity is presented for 2 designs and 5 MTRs(the total flow rate is fixed),along the arcs of R=5Dh,8Dh,and 11Dh,in Figs.12-15.Before analysis,it is worth mentioning that since the arcs of R=8Dhand 11Dhintersects with the exit wall(see Fig.5)where zero velocity and turbulence are commonly acknowledged, all curves corresponding to R=8Dhand 11Dhin Figs. 12-15 should start from a zero value and end up with a zero value too, namely every curve should form a closed region in combination with the y/Dhaxis.In contrast to this,the arc of R=5Dhdoesn’t join the exit wall (see Fig. 5), so the curves corresponding to R=5Dhmay hang on the top of the y / Dhaxis.
Fig. 12 shows the influence of MTR on time-averaged velocity. Since the total flow rate is constant, it can be concluded that generally, the wider the curve covers, the lower the peak value is. For Design A, as MTR increases, the curve becomes wider and lower, which implies the jet directs more momentum transversely by an intensified sweeping motion.When MTR=0, 0.33 and 0.5, the jets’ spreading regions are almost identical (y = ± 2Dh), but the jet of MTR=0.5 has a marked highest decay rate among the three cases. The peak dimensionless velocity of MTR=0.5 reduces from 0.85 at R=5Dhto 0.45 at R=11Dh(47%), while for the other two cases it reduces from 0.9 to 0.7 (22%,MTR=0.33) and from 1 to 0.8 (20%, MTR=0). This indicates a stronger dissipation or entrainment which is critical to the performance in flow control applications. Nevertheless,when the MTR continues to grow, the decay rate declines to 42% for MTR=0.67 and 33% for MTR=1, respectively.However, the biggest MTR corresponds to the largest spreading region of y=±6Dh,which is the most promising in flow control practice.For Design B,the peak value decay rates have an obvious increase compared to Design A,which are approximately 62%, 56%, 60%, 50%, 50%, respectively. This is in consistence with the finding that Design B issues wider and evener jets than Design A.
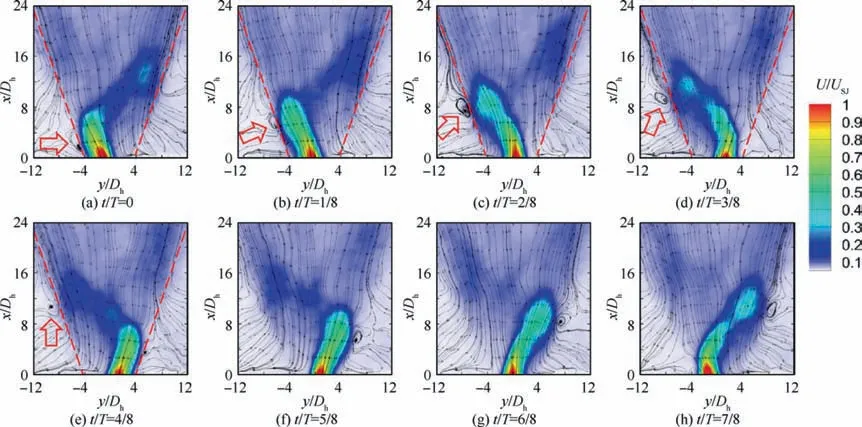
Fig. 10 Phase-averaged velocity fields and streamlines of Design B at MTR=0.5.
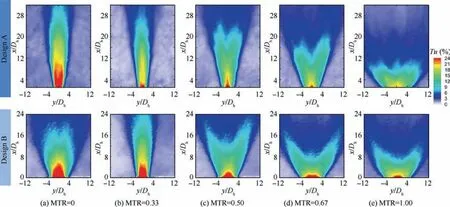
Fig. 11 Time-averaged turbulence intensity fields at fixed total flow rate.
Fig. 13 illustrates the time-averaged turbulence intensity along the arcs of R=5Dh,8Dh,and 11Dhfor the two designs.For Design A, the case of MTR=0 has the largest peak turbulence intensity but meanwhile the smallest impact regions.When MTR=1, the jet induced the evenest turbulent fluctuations in a large region, which derives from the largest sweeping motion and favorable oscillation pattern. The remaining three curves generally show the same distribution and transitional behavior between MTR=0 and MTR=1.For Design B, the situation is a little complex because the trend is not monotonous. The case of MTR=0 has an omnidirectional superiority to the cases of MTR=0.33 and 0.5. As will be mentioned later in Section 5,this is due to the larger oscillation frequency for the case of MTR=0. Cases of MTR=0.67 and 1 have almost the same turbulence distribution. This accords to the trends of time-averaged velocity in Fig. 12.Therefore, the case of MTR=0, 0.67 and 1 generally has the most desired turbulent fluctuations, where the first case has the largest peak turbulence intensity and the last two cases have evener distributions in larger regions.
To compare in another dimension,Figs.12 and 13 are reorganized into Figs. 14 and 15, where the decay rates of total velocity and turbulence intensity at various MTRs are displayed in a more explicit way.From Fig.14,it’s very apparent that the Design B has a larger decay rate than Design A, and the impact regions of Design B are bigger than Design A.From Fig. 15, it can be seen that the turbulence intensity of Design B has a wider distribution than that of Design A,which results from the larger spreading angle of Design B. On the other hand, the peak turbulence intensity of Design B at various distances and MTRs are not smaller than that of Design A, so it implies that the Design B can be superior to Design A with respect to flow control performance.
4.3. Qualitative internal flow fields
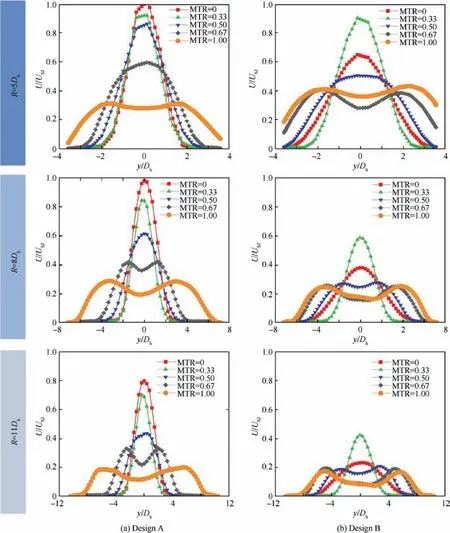
Fig. 12 Time-averaged velocity along the arcs of 5Dh, 8Dh, and 11Dh away from the throat at different master flow rate proportions MTRs.
To gain an insight into the internal mechanisms driving external oscillation,the CFD simulations are performed for several representative cases. Since the variation trend of Design A, as shown in Figs. 8, 9 and 11, is generally monotonic, only the case of MTR=0.67 are investigated numerically. Two phase-averaged flow fields which represent the left-most and right-most deflection positions of the external ejected jet are illustrated in Fig. 16 (a). As t / T=0, namely the jet reaches the left-most position, there is more fluid transported in the right branch (as indicated by the red arrows) than the left one. Hence, the fluid from the right control port naturally pushed the steady jet in the slave layer to the left position.After a half period goes away, the situation reverses. The left branch transports more fluid and thus dominates the pushing force. Therefore, the ejected jet turns right to accommodate more fluid from the left branch. Fig. 16 (b) demonstrates the mass flow rate variation with time in the two branches. In accordance with our previous deduction, the flow rates in the two branches wanes and waxes. And more importantly, the flux in one branch wanes as that in another branch waxes.This flux difference is transformed into the time-varying pushing force exerted on the steady jet from the slave layer, and thus the oscillation of the external jet forms unsurprisingly.
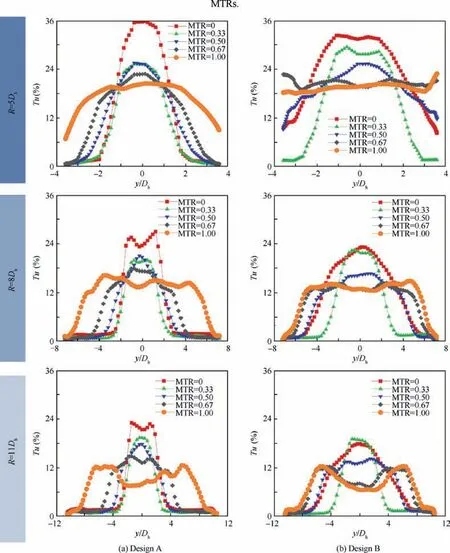
Fig. 13 Time-averaged turbulence intensity along arcs of 5Dh, 8Dh, and 11Dh away from the throat at different master flow rate proportions MTRs.
As for Design B, the situation becomes a little bit complex due to its addition of an extended interaction chamber.Hence,three cases, which represent three developing stages as MTR changes from 0 to 1, are numerically explored. Fig. 17 illustrates the first stage, with two instants during an oscillation period at MTR=0. Although the master flow rate is zero and hence there are no straightforward driving mechanisms as aforementioned in Design A, the jet emitted from the slave layer can still have a not little oscillation of 26° around (refer to Fig. 9). This phenomenon is worth investigating deeply.From Fig. 17, we can see several trapped vortices in the interaction chamber. However, at a specific moment, there is only one vortex dominating the turning of the ejected jet. To be concrete, at the beginning of an oscillation period, the topleft vortex as indicated by the red arrow has the biggest volume,so it squashes the main jet into the right side of the interaction chamber and hence the ejected jet reaches the left deflection position. While the time reaches half of the period,the top-right vortex dominates the process and the ejected jet deflects to the right position. However, it’s worth noting that although there is one dominant vortex at one instant, the remaining vortices still exist in their original locations, with their volumes changed. The volume variation of the vortices is spontaneous and continuous, without any external varying excitation.In a word,it’s the instability of the trapped vortices that drives the inherent oscillation. What’s more, this characteristic inspires us that if only the slave channel is maintained,then an actuator without feedback channels, but generating a self-sustained oscillation, can be obtained. This instrument,which inherits the sweeping merit of traditional actuators,and meanwhile largely decreases the size pressure loss compared to traditional fluidic oscillators (see Fig. 1), can hence have a promising future in flow control fields.
When the master layer begins to transport fluid to the slave one, the oscillation mechanisms go into the second stage. In agreement with experimental results displayed in Fig. 9, the Fig.18(a),which represents the case of MTR=0.33,exhibits a notably smaller oscillation than that in Fig. 17. The newly injected fluid from the master layer, instead of contributing to the oscillation,destroys the trapped vortices seen in the case of MTR=0. This directly leads to a sharp decrease in the spreading angle (only 7° around).
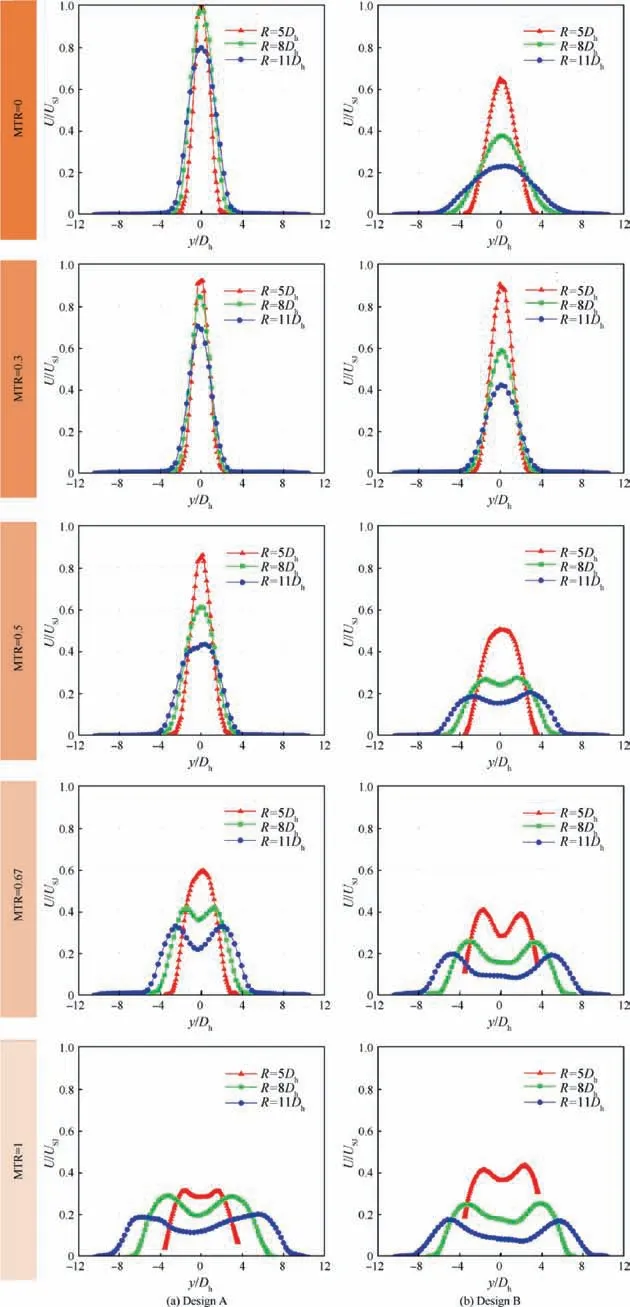
Fig. 14 Time-averaged velocity along the arcs of 5Dh, 8Dh, and 11Dh away from the throat at different radial direction.
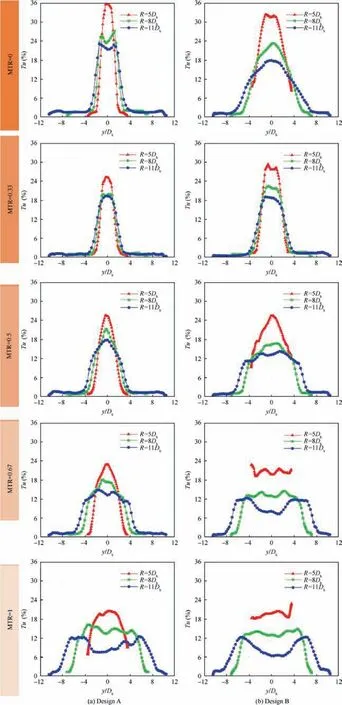
Fig. 15 Time-averaged turbulence intensity along the arcs of 5Dh, 8Dh, and 11Dh away from the throat at different radial direction.
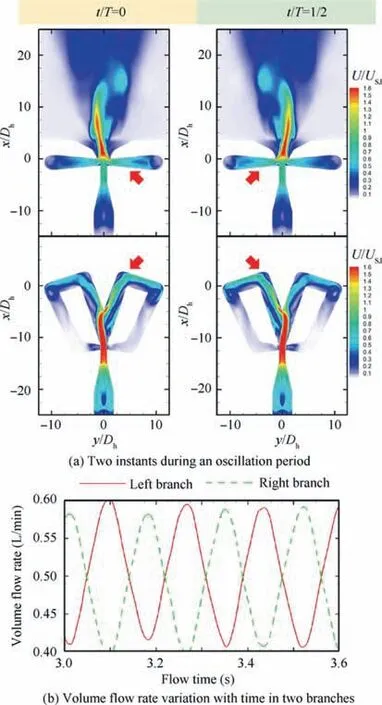
Fig. 16 Flow dynamics of Design A at MTR=0.67(the red arrow points out dominant branch at this moment).
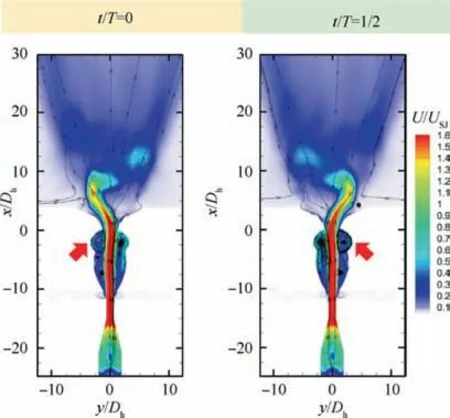
Fig.17 Two instants of Design B during an oscillation period at MTR=0 (the red arrow points out dominant vortex at this moment).
As the master flow rate continues to grow, say MTR=0.67 in Fig. 19, the third developing stage emerges,namely the spreading angle restores and increases steadily up to saturation.From Fig.19(a),it can be easily seen whichever the instant there are always two vortices occupying the relatively large volumes, where the vortex indicated by the red arrow is the most dominant,and the vortex by the green arrow is the second dominant.Just the same as the situation in Fig.7,the vortex indicated by the green arrow directly leads to the deflection.However,it’s now not the instability of the trapped vortex system that drives the oscillation process. The addition of fluid from the master layer feeds the volume growth of the vortex indicated by the red arrow. It can be easily imagined that at t/T=0,just due to the volume growth of this vortex can the main jet be driven from the left-most deflection position to the right side. Likewise, the process of jet deflection from the right-most position to the left side is initiated by the vortex indicated by the red arrow at t / T=1/2. Interestingly, this is just like the driving mechanism of the traditional fluidic oscillator(see Fig.1),where the vortex indicated by the red arrow here plays the role of the separation bubble in the interaction chamber of the traditional actuators.What’s more,by comparing Fig.18(b)and 19(b),it can be found that when MTR=0.33, the master and slave volume flow rates wanes and waxes around 0.25 L/min, with the fluctuation of around 25% of the mean level (0.25 L/min). However, when MTR=0.67, the fluctuation increases to around 50% of the mean level (0.5 L/min). The considerable distinction about fluctuation levels should also to some extent be responsible for the huge difference about spreading angles.
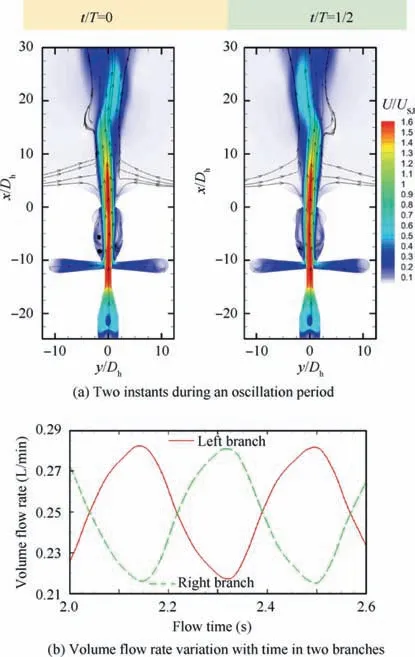
Fig. 18 Flow dynamics of Design B at MTR=0.33.
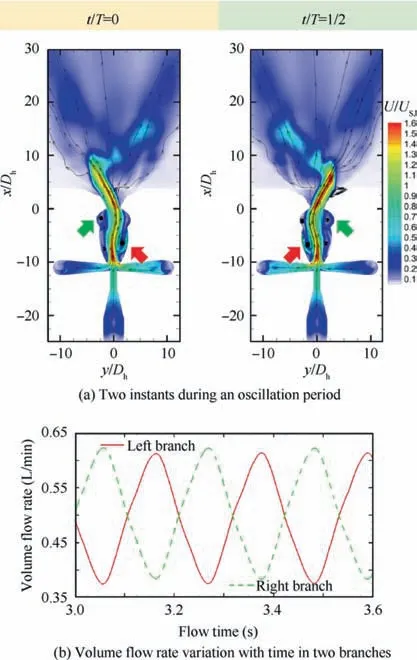
Fig. 19 Flow dynamics of Design B at MTR=0.67 (red arrow points out the most dominant vortex at this moment, and green arrow the second dominant vortex).
5. Decoupling effect
The results aforementioned reveal the flow dynamics of the two master-slave oscillators,and the ultimate goal of designing these two structures is to decouple spreading angle (and oscillation frequency if possible) from volume flow rate. To this end, the spreading angle θspreadand oscillation frequency f under all experimental conditions are displayed in the way of bubble charts, as illustrated by Figs. 20-23. For all bubble charts, the x-axis denotes the master volume flow rate Vmaster,the y-axis denotes the slave volume flow rate Vslave, and the third physical quantity is represented by the area of the bubbles.
Fig.20 displays the spreading angle θspreadof the two types of master-slave fluidic oscillators under all experimental conditions. Note that the diameter of a circle is proportional to the value of spreading angle θspread. As mentioned in preceding part,since the master flux promotes oscillation while the slave counterpart restrains oscillation (holds the shape of a steady jet), it can be convincingly deduced that the spreading angle θspreadincreases with the master flow rate Vmasterbut decreases with the slave counterpart Vslave.Fig.20 proves this deduction.What’s more, it’s found that for Design A, values of the normalized spreading angle θspread/ VR (here, VR=Vmaster/Vslave)are very close,provided that neither the master flow rate Vmasternor the slave counterpart Vslaveis too small, as shown by Fig.21(a),while there exhibits no simple linear relationship between the spreading angle θspreadand the flow rate V for a traditional fluidic oscillator25,30,35,36,56.This finding may make it possible to approximately predict the impact region of the Design A at any MTRs. When it comes to the array configuration of fluidic oscillators, the pre-knowledge of spreading angle can provide engineers with an important reference of what oscillator spacing is the most appropriate. For Design B, on account of a more complex slave layer structure, there is no such a simple regularity in regard to the spreading angle θspread(Fig. 21 (b)).
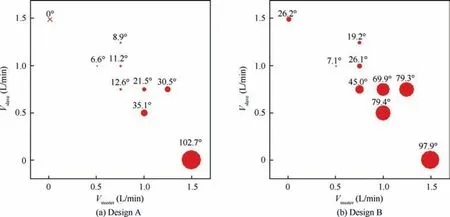
Fig. 20 Bubble chart of spreading angle θspread (the diameter of a circle is proportional to the value of spreading angle θspread).
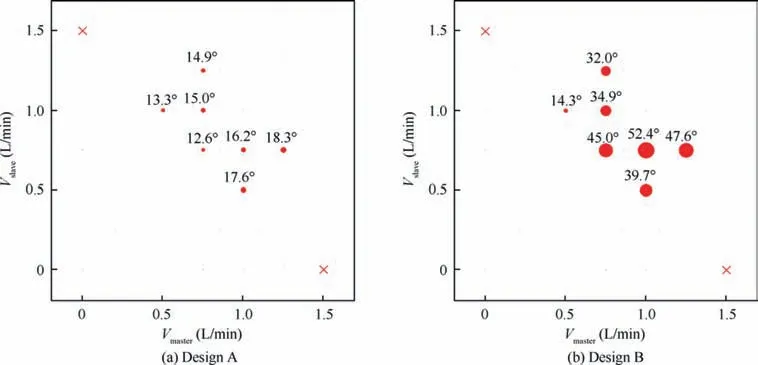
Fig.21 Bubble chart of spreading angle normalized by volume flow rate ratio θspread/VR(the diameter of a circle is proportional to the value of spreading angle θspread divided by volume flow rate ratio VR).
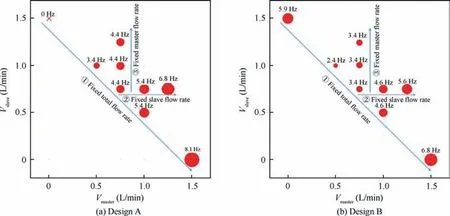
Fig. 22 Bubble chart of oscillation frequency f (the diameter of a circle is proportional to the value of oscillation frequency f).
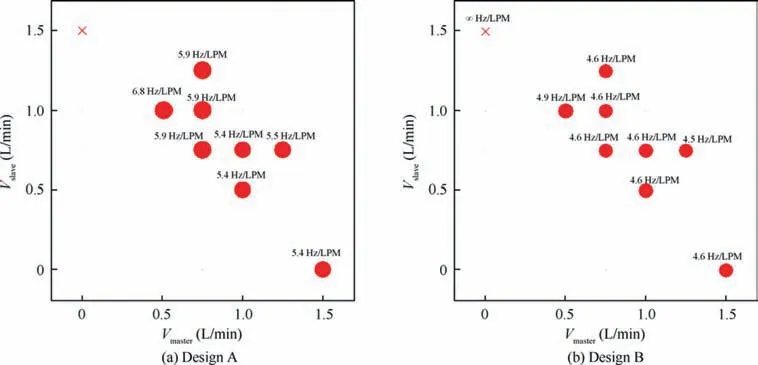
Fig. 23 Bubble chart of oscillation frequency normalized by master flow rate f / Vmaster (the diameter of a circle is proportional to the value of oscillation frequency f divided by master flow rate Vmaster).
Apart from spreading angle θspread, oscillation frequency f is another governing property that has a significant influence on flow control57and heat and mass transfer performance58. In Fig. 22, the area of each circle is proportional to the value of oscillation frequency f.Fig.22 should be seen in three directions.First,along the line marked by‘‘①”are five experimental conditions of constant total flow rate. It can be seen that although the total flux is fixed, the oscillation frequency can still increase with the master flow rate Vmaster(or MTR).This indicates that the linear relationship between oscillation frequency and volume flow rate of traditional fluidic oscillator has been fundamentally changed. Note that for Design B, the case of MTR=0 is an exception to the above trends.As mentioned earlier,although the master flow rate,namely the source of oscillation, is zero, the issued jet can still oscillate at a big frequency near that of case MTR=1 due to the special cucurbit structure of the slave layer. To find out the factor (Vmasteror Vslave) dominating oscillation frequency, the graph should be seen from the horizontal and vertical directions. The horizontal line marked by ‘‘②” represents that the slave flow rate Vslaveis fixed while the master counterpart Vmasterchanges,and reverse is the vertical line marked by ‘‘③”. It’s obvious that,either for Design A or B, it is only the change of master flow rate that can lead to a variation in oscillation frequency f; it cannot be changed by slave flux Vslave. It’s not beyond our expectations,since,erstwhile introduced,only the master layer has a shape of traditional fluidic oscillator, which has an intrinsic property of oscillation.
For a traditional fluidic oscillator (as illustrated in Fig. 1),the linear dependence of oscillation frequency f on volume flow rate inspires us to find a proper quantity for the master-slave fluidic oscillator, which also has a linear relationship with oscillation frequency f.Fig.23 displays the normalized oscillation frequency f/Vmaster.This trend exactly reappears in large master flow rates, but distorts further as Vmasterapproaches zero. This also means that for the master-slave fluidic oscillators, the oscillation frequency f cannot linearly rely on total volume flow rate (Vmaster+Vslave) and slave volume flow rate Vmaster. Furthermore, this finding reinforces that the master layer is a dominant factor of oscillation.
6. Conclusions
Two types of novel master-slave fluidic oscillators that can produce a continuous sweeping jet with the spreading angle decoupled from volume flow rate are experimentally investigated by 2-dimensional TR-PIV in a water tank. The decoupling effect is attained by employing the double-layer structure and connecting the bilateral feedback channels in the master layer to the corresponding control ports in the slave layer.In this way,the difference of flow rates in feedback channels is converted to the variation of lateral force exerted in the slave steady jet. Therefore, the oscillation of issued jet can be fulfilled only by means of fluid mechanisms. Since the oscillation solely originates from the fluid motions in the master layer, the spreading angle can be changed with master flow rate. If the slave flow rate is varied in a reverse way in order to keep the total flux constant, the decoupling of spreading angle from (total) volume flow rate can be achieved. The experiments on both of these two designs in a water tank confirmed the control authority.
From the aforementioned analysis,the following promising merits of the two master-slave fluidic oscillators can be deduced easily:
(1) They both fundamentally overcome the dependence of spreading angle and oscillation frequency on(total)volume flow rate,thus broadening the workable conditions of fluidic oscillators in flow control and heat and mass transfer enhancement applications.
(2) Only by adjusting the share of volume flow rate between the master and slave inlets,or in other words,by holding the total volume flow rate constant can the ejected jet change its shape from a steady impinging jet with a nearly zero spreading angle to a sweeping impinging jet with a large spreading angle approaching 100°,which implies the impact region can be regulated arbitrarily based on actual situations.
(3) Both the velocity and turbulence intensity have an even sweeping distribution, which is a striking superiority to traditional fluidic oscillators. This trait is valued for its guarantee of the isotropic control effect in all covered spatial directions.
From the CFD simulation, the driving oscillation mechanisms can be summarized as follows:
(1) For Design A, the driving mechanism derives from the time-varying flux difference in the two branches. Then the time-varying flux difference turns into the timevarying force difference exerted on the main jet, and finally the deflection and oscillation forms naturally.
(2) For Design B, to sum up, there are three developing stages.At the first stage,namely MTR approaches zero,the instability of the trapped vortex system results in the unexpected oscillation. At the second stage, namely MTR approximates 0.33, the trapped vortices are destroyed and hence the oscillation process nearly no longer exists. At the third stage, namely MTR increases from 0.33 to 1,the spreading angle increases steadily up to saturation. Now the vortex directly feed by the fluid from the master layer dominates the oscillation process and drives the external jet from one side to another.This mechanism is just like that of traditional fluidic oscillators, where the vortex here plays the role of the separation bubble in traditional actuators.
With respect to the pros and cons of these two designs, it can be concluded that each has its own merits. Design A can smoothly change the jet’s shape from a steady jet to a sweeping jet(Design B cannot issue a steady jet at MTR=0),thus having a prospect in applications where the spreading angle of the impinging jet matters. For instance, when using Design A to impinge upon cylinders of different diameters for heat transfer enhancement, considering the above excellent shape conversion property,the impact region of the jet can match very well to the diameter of the cylindrical surface,only by changing the ratio of master flow rate to slave counterpart. Design B has a wider and evener distribution of jet momentum in the spatial domain, and the decay rate of Design B is much higher than that of Design A, which implies stronger entrainment of surrounding low energy and even stagnant fluid (e.g. the fluid in boundary layer). These advantages render Design B a more promising candidate than Design A to flow control and mixing enhancement applications. Besides, Design B can have a not little oscillation when the jet only passes through the slave layer channel, namely MTR=0. This phenomenon inspires us to Design A sweeping jet actuator which has much lower size than traditional actuators. Of course, whichever the design, they both achieve the decoupling effects, which is the initial aspiration to develop these novel structures. Further work will be done to optimize and upgrade the design to achieve a configuration wherein one master jet drives multiple slave jets.
Declaration of Competing Interest
The authors declare that we do not have any commercial or associative interest that represents a conflict of interest in connection with the work submitted.
Acknowledgements
The authors gratefully acknowledge the financial support from the National Natural Science Foundation of China (Nos.12072196 and 11702172), Science and Technology Commission of Shanghai Municipality (No.19JC1412900), Aeronautics Power Foundation (No. 6141B09050393) and Key Laboratory of Aerodynamic Noise Control (No.ANCL20190106) extended to this study. In particular, the authors want to express great appreciation to Yudan Liu(School of Mechanical Engineering, Shanghai Jiao Tong University) for her constructive and valuable work in CFD part.
 CHINESE JOURNAL OF AERONAUTICS2021年5期
- CHINESE JOURNAL OF AERONAUTICS的其它文章
- Ferrofluid moving thin films for active flow control
- Preliminary study on heat flux measurement data of TT-0 flight test
- An analysis and enhanced proposal of atmospheric boundary layer wind modelling techniques for automation of air traffic management
- Hot deformation behavior and microstructure evolution of the laser solid formed TC4 titanium alloy
- Electrochemical trepanning with an auxiliary electrode
- A method for automatic detection and characterization of plasma bubbles using GPS and BDS data
