Nondestructive acquisition of the micro-mechanical properties of high-speed-dry milled micro-thin walled structures based on surface traits
Da QU, Wei ZHENG, Bo WANG, Bo WU, Huajun CAO,*, Hao YI
a The State Key Laboratory of Mechanical Transmissions, Chongqing University, Chongqing 400044, China
b College of Mechanical Engineering, Chongqing University, Chongqing 400044, China
c Aerospace Research Institute of Materials & Processing Technology, Beijing 100076, China
d Centre for Precision Engineering, Harbin Institute of Technology, Harbin 150001, China
KEYWORDS Dimension reduction;High-speed dry micromilling;Mechanical property;Nondestructive acquisition;SVR
Abstract Requirements for the service performance of aeronautic microelectronic components are increasingly strict. However, sever issues, that the acquisition of the service performance such as micro-mechanical properties is destructive, limit the subsequent application of the tested components. Addressing this issue, this paper proposes a nondestructive acquisition method of the micro-mechanical properties of the accelerometer micro-components, based on analyzing surface traits. To select qualified components without damage, we firstly developed a quasi-static microtensile tester and then established a combination prediction model of mechanical properties based on micro-milled surface traits. The model works due to the thin-walled structure, which makes the machined surface traits have significant influences on the mechanical properties such as Young’s modulus,yield strength,tensile strength,and elongation at break.Surface roughness,surface structure, and surface anisotropy are extracted to comprehensively present surface traits from different aspects. For improving the practicability of the model, the principal component analysis (PCA) is adopted to reduce high-dimensional traits explanatory variable space into two dimensions, and regression analysis models are comparative established in predicting the mechanical properties.Residuals analysis and error analysis are carried out to show the prediction accuracy. The maximum prediction error is about 10.62%, but the significance levels in the t-test of the predicted Young’s modulus and yield strength are not ideal. Therefore, kernel support vector regression(SVR)is imported to improve the prediction ability of the combination prediction model.The residuals analysis result shows that SVR is effective in enhancing the prediction ability of this model.
1. Introduction
With the rapid development of the aerospace field, more and more strict requirements of the functional component are proposed. Typically acting as a core component of an accelerometer, the thin-walled micro-structured Elgiloy component is required with high mechanical properties such that Young’s modulus, tensile strength, elongation at break, and fatigue strength, which directly determine the service performance1of the accelerometer. Among these mechanical properties,the first three mechanical properties can be obtained generally through a quasi-static tensile test.However,it is difficult when the tested components are featured at the micro-scale.
For testing such a micro-scaled component, some researchers have developed specific testing devices. Nandy et al. developed a micro-tensile device for testing mechanical properties of thin-walled components, such as thin films and Graphene Oxide (GO) paper, with additively manufactured components.2Quantitative measurements of GO thin film buckling under compression were realized with the use of an atomic force microscope (AFM). Sharpe et al. developed a tensile system of micro-structure polysilicon components to study Young’s modulus of this material.3In the system,the strain can be measured by laser interferometry. Meszmer et al. developed a micro-tensile system. The V-shaped aluminum actuator provides a displacement resolution of 1 μm by heating itself, and the nano-leveled Newton force can be measured by micro-scaled pressure and resistance sensor.4This flexible tensile platform can be used for various testing environments, but the actuator displacement is sensitive to the temperature by which the accuracy is affected during the tensile process. Park et al. designed a tensile system with adding fatigue load.5,6The test result shows that the fatigue strength of the bone-shaped NiCo component is greatly affected by its width size. Dzˇugan et al. tested micro-scaled components by the small punch test (SPT).7Tensile strength,cross-section reduction, and elongation of the specimen can be obtained. However, it is difficult to grasp the SPT time,and the measurement method is complicated and expensive.8Dubelman et al. established a dynamic tensile device based on a split Hopkinson pressure bar (SHPB) to test monocrystalline silicon specimens, and displacement can be measured within 100 μm.9Hsu et al. constructed an in-situ tensile testing system which composed of piezo stages, force sensor, and specimen holders inside SEM and for the nanoscale tensile testing and directly tested the interfacial tensile strength of SiC/Si.10Konopı´k et al. established a tensile system using digital image correlation (DIC) to obtain strain during stretching a sample with the size of 1.5 mm×1 mm.11DIC is multi-functional and useful for obtain strain during a micro-tensile test but is also expensive. Vo et al. used a in situ micro-tensile device to obtain proton beamirradiated stainless steel with micro-structure of 1.3 μm×1.3 μm and found that the measured strain corresponds well with macroscopic expectations even on the micron scale.12
Previous works show that the tensile test is significant for obtaining mechanical properties of micro-scaled specimens and needs carrying out in a quasi-static tensile process by a specific tester. Hence, we firstly developed a mechanical property tester to carry out quasi-static tensile tests. However, the test of mechanical properties is not the ultimate goal,the application of these components is,and qualified components which have excellent mechanical properties are selected. Generally,a quasi-static tensile test is adopted to obtain the mechanical properties, including Young’s modulus, yield strength, tensile strength, and elongation at break. During the test, the tested component experiences from elastic deformation to plastic deformation, and then to fractured. Although the quasistatic tensile test works, the tested component is destroyed and cannot be used anymore in the subsequent service.Hence,a nondestructive acquisition method of the mechanical properties should be proposed with making the most of the manufacture features of the component.In this study,the aimed microstructured components are manufactured by high-speed dry(HSD) micro-milling,13which is a crucial process to produce thin-walled structures. The generated surfaces generally have a strong influence on mechanical properties such as Young’s modulus14and fatigue strength,15especially for a microstructure with a thickness that is at the same order of magnitude of HSD machining parameters. During the manufacturing process, many factors, such as manufacture error of tool,tool wear, machining vibration and dynamic properties of machine tool axis,etc.,have impacts on the machined surfaces,and will furtherly affect mechanical properties. Therefore, the analysis of machined surface traits is very important for the nondestructive acquisition of mechanical properties.
For the HSD micro-milling process, most machining traits reflect on the machined surface comprehensively.A more comprehensive analysis of the machined surfaces is taken, more precise the prediction of mechanical properties of the machined component is. Among the analysis of surface traits of the machined surface, analysis methods of surface quality such that profile roughness and the root-mean-square roughness (RMS) cannot reflect surface traits of machined surface completely.To this end,more and more researches are carried out surrounding surface characterization. Kulesza and Bramowicz compared some characterization methods of machined surfaces, including box-counter, surface roughness,and autocorrelation method based on fractal dimensions, to analyze surface traits of the diamond thin film.16However,the characterization result based on the box-counter method is not ideal. T¸a˘lu et al. used fractal geometry to characterize defects of internal thread surfaces generated by cutting tap and rolling tap,17and only the two-dimensional fractal dimension was used in the analysis.Zhu et al.explored the tool wear mechanism of nickel-based superalloy Inconel 718 in single grain scratching tests, and fractal theory was used to evaluate the grain wear process.18The analysis result shows that microfracture is caused by surface crack. Chen et al. analyzed surface traits of machined potassium dihydrogen phosphate(KDP) crystal and compared surface traits generated by micro-milling and single point diamond turning (SPDT).Based on a two-dimensional fractal dimension analysis of directional profiles on the machined surface, the surface isotropy degree of micro-milled KDP is higher than that of SPDT.19To quantitively analyze surface isotropy degree of machined surface, Li et al. proposed a spectral moments method based on a two-dimensional fractal dimension. They then compared the surface isotropy degree of surfaces machined by grinding and turning, adopting this method.20Liang et al.analyzed performances of various characterization methods on differentiating engineer ceramic surfaces, and the analysis shows that the fractal dimension based on the variation method is best.21In characterization research of thinfilm surface traits of Ga-doped ZnO,Jing and Tang22analyzed relationships between improved variation method and surface traits, surface energy, surface roughness, and material properties. They found that the fractal dimension has a very close relation to the material grain size and is easily affected by surface defects. Wei et al. proposed a fractal dimension based on RMS deviation to estimate surface roughness of engineer ceramic machined by rotary ultrasonic grinding. Compared with surface roughness, this characterization is very effective and is a kind of method that has better resolution and sensitivity as well.23Zhang et al. compared four different methods of fractal dimensions in characterizing generated profile and measured profile,in which box size method and variogram method show good fractal traits.24However, the methods of surface generation function and three-dimensional fractal dimensions still need to be discussed. As characterization methods based on fractal dimension works to present surface traits from aspects differing from surface roughness, they are good ways to characterize surface traits of the micro-milled component.
Although some researches on mechanical properties and surface characterizations have carried out, less research focuses on the nondestructive method of obtaining mechanical properties,mainly based on surface traits of HSD micro-milled surfaces. This paper firstly established a micro-tensile device for measuring Young’s modulus (impacting on the sensitivity of the accelerometer), yield strength (impacting on the measurement range), tensile strength (impacting on the resistance of failure), and elongation at break (impacting on the resistance). Then the relationship between the surface traits and the mechanical properties of the thin-walled structured Elgiloy was analyzed. Based on mapping the relationship between a dimension reduction analysis of comprehensive surface traits and mechanical properties, the mechanical properties can be obtained through a none-damage surface test method. The acceptable thin-walled structured Elgiloy can be then selected out more easily.
2. Method and experiments
2.1. Prediction method of mechanical properties
Fig. 1 shows the flow chart of establishing a combination prediction model of the mechanical properties of the thin-walled micro-structured Elgiloy component. HSD micro-milling is employed to manufacture the thin-walled structure on the component. The section thickness of the components is obtained by processing the SEM images. Three-dimensional surface height and surface width can be obtained together by laser scanning confocal microscopy(LSCM). The section area can thus be calculated and used furtherly in the tensile test to transform the load-displacement curve to the engineering stress-strain curve. Young’s modulus, yield strength, tensile strength, and elongation at break are obtained as the aimed results. From the three-dimensional surface height generated by HSD micro-milling operation,surface quality,surface accuracy, surface structure, and surface anisotropy are extracted.Two predictors are generated by using the dimension reduction method PCA, and the combination prediction model is then established by regression methods.
2.2. Mechanical property tester and material of component
A two-axis machine tool developed independently was used for testing the mechanical properties of the thin-walled components after being micro-milled. Its control logic is shown in Fig.2(a).The control program sends orders to motion control card(PCI1240U,Advantech,China)by an industrial personal computer, and the platforms can be driven by stepping motor and servo motor though motor drivers.Among them,the stepping motor is used to adjust the level between the fixed platform and the mobile platform. A standard gauge block can be fixed horizontally on the mobile platform with one cantilevered end above the fixed platform. The fixed platform is driven up along the axis Z and stops until a force amplitude form another force sensor reaches the micro-leveled contact force. The acquisition of the force data is operated by a data acquisition card (DAQ card) (PCI1710, Advantech, China)whose maximum sampling frequency reaches 100 kHz. The resolution ratio of the adopted grating feedback is 5 nm, and the accuracy of measuring force is about ±12 mN.
Fig. 2 (b) shows the test principle. Another force sensor with 20 mN of force resolution, deemed as a fixed platform along axis Y, is used for measuring the tensile load in the tensile process.The other platform,deemed as a mobile platform,is driven by a servo motor to move at a very slow and constant speed by which the whole tensile test can be accepted as a quasi-static tensile process. The tensile length can be monitored in real-time by a displacement sensor.An optical grating system with 5 nm resolution is used as the displacement sensor.The load-displacement curve can then be calculated and furtherly transforms to engineer stress-strain curve.
Before the test,both ends of the component should be fixed on the two platforms,respectively.Its orientation can be operated through the observation in a CCD microscope and fixing by adhesive bonding. Using specific adhesive and limiting its use level to generate very little heat during its solidification.As the device can only obtain the relationship between displacement and force applied on one side of the tested component, the structure of the tested component should be measured for calculating the corresponding stress. The thickness of the machined components is calculated by analyzing pixels in SEM images, and the width of the components are obtained with the same method in LSCM images.The machine tool and its testing process are shown in Fig. 4 (a).
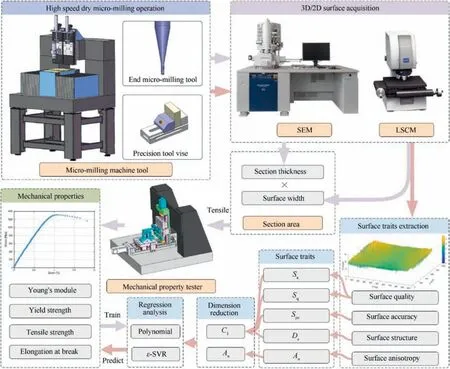
Fig. 1 Flow chart of establishing combination prediction model.
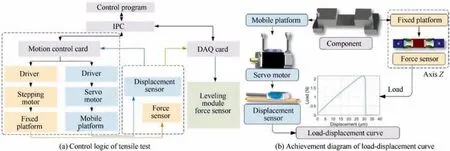
Fig. 2 Construction diagram of mechanical property tester.
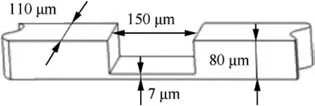
Fig. 3 Structure features of component.
As the core component of the military accelerometer, Elgiloy alloy (strip alloy, Elgiloy specialty metals company, USA)is the typical material. The thickness of the micro-structure of this component is only about 7 μm25is shown in Fig.3.It is a cobalt-based alloy with excellent physical performance such that high strength, high ductility, low thermal conductivity,and excellent chemical performance.26The Elgiloy with an original thickness of 80 μm used in this experiment is machined to 10 μm for an easy measurement.The related composition is shown in Table 1.
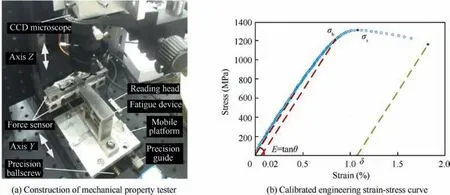
Fig. 4 Machine tool for testing mechanical properties and calibration result.

Table 1 Composition of Elgiloy (wt%).26
The main mechanical properties, which include Young’s modulus E, yield strength σ0.2, tensile strength σb, and breaking elongation δ,27are calculated from the engineering stress-strain curve of the tested component. For calibrating related calculation parameters, an original component is tested.The calibrated parameters can be set as criteria for subsequent tests,and the standard mechanical properties are listed in Fig. 4 (b) and Table 2.
2.3. Machine tool and experiment design
A four-axis micro-milling and micro-grinding compound machine tool developed independently was used for micro-milling experiments, as shown in Fig. 5. The CNC control system of this machine tool is Universal Motion and Automation Controller (UMAC) manufactured by the American Delta Tau company. The employed high-speed micromilling spindle is air bearing with both less than 0.125 μm of axial and radial run-out (Loadpoint, British) electric spindle.The grating resolution of the three linear axes is 5 nm after being subdivided, and the precision of feed drives is 150 nm.Tool setting is performed by a CCD camera equipped on the machine tool. The employed micro-milling tool is two-flutedend mills(NS tool,Japan)whose relevant information is listed in Table 3.

Table 2 Mechanical properties of Elgiloy components.
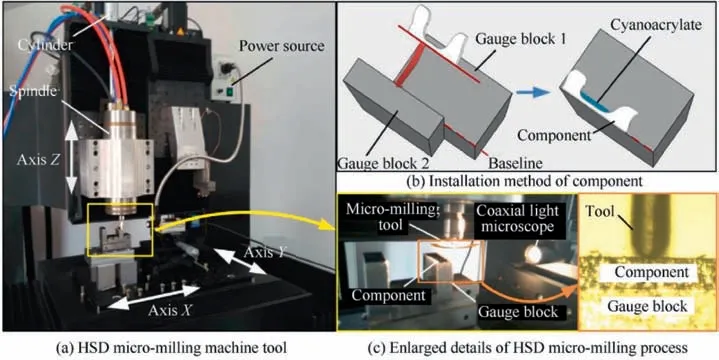
Fig. 5 Experimental method and machine tool.

Table 3 Geometric parameter of the micro-milling tool.
In the micro-milling process, multi-step milling28was used to make a balance between machining efficiency and surface quality.The selection of milling parameters,which affects surface quality29and burr formation, is strictly required due to the size effect.30Only the combination of varying axial milling depth related to residue thickness of micro-slot was taken in this experiment. Axial milling depths are taken as 5 μm,2 μm, and 1 μm, respectively. Milling times of the depths of 2 μm and 1 μm should be more than two, and that of 5 μm should be taken as much as possible. In this experiment, spindle speed and feed rate are chosen randomly for generating machining surfaces with various traits. All the components were manufactured by low-speed wire electrical discharge machining from a small area of the same intact Elgiloy, and the thickness of all the components, which is 80 μm, change slightly within 1 μm. In this experiment, the targeted removal thickness is set as 70 μm. The milling-depth operations are listed in Table 4. The clamping method of thin-walled microstructured components in Ref.31was used.
3. Surface traits
3.1. Surface quality
To comprehensively present surface quality, we selected three kinds of traits, including mean surface roughness Sa, surface roughness RMS Sq, and surface accuracy Spv.32Sarepresents the micro geometrical mean error of the machined surface,33and Sqrepresents RMS of the machined surface geometrical error. Surface accuracy shows the difference in surface peak and value that deviates the ideal machine surface.The calculation methods of the three surface traits which reflect surface quality are shown as follows.

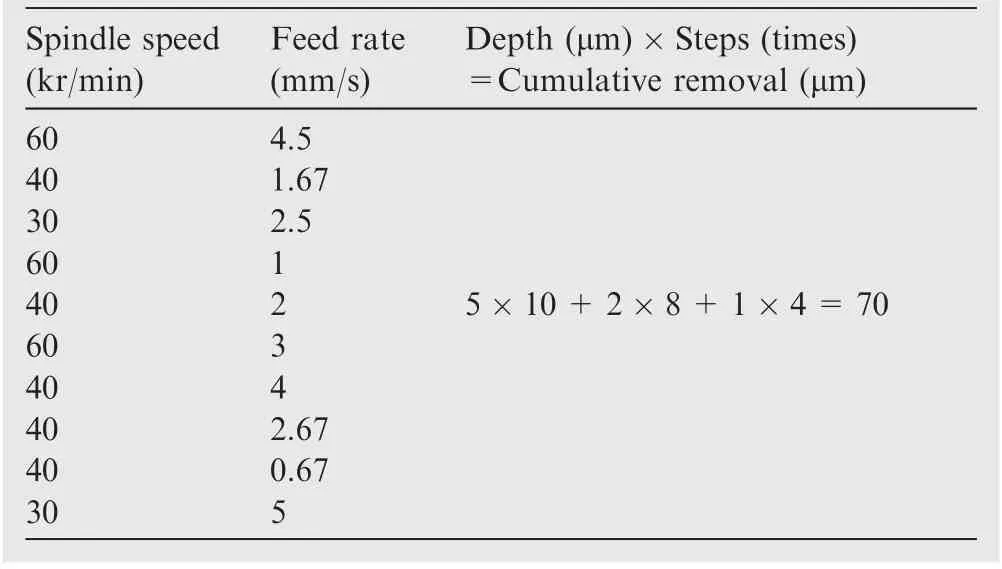
Table 4 Micro-milling depth in each operation step.
where Φ(x,y )denotes the three-dimensional surface height and ψ(x,y) denotes the datum plane of Φ(x,y). S is the surface area of Φ(x,y).
3.2. Surface structure
As using surface roughness only presents surface quality, surface structure strait should also be calculated to present the surface from another aspect,where a three-dimensional fractal dimension Dsis always used.In calculation methods of Ds,the variation method34,35is applied due to its applicability of analyzing a machined surface.
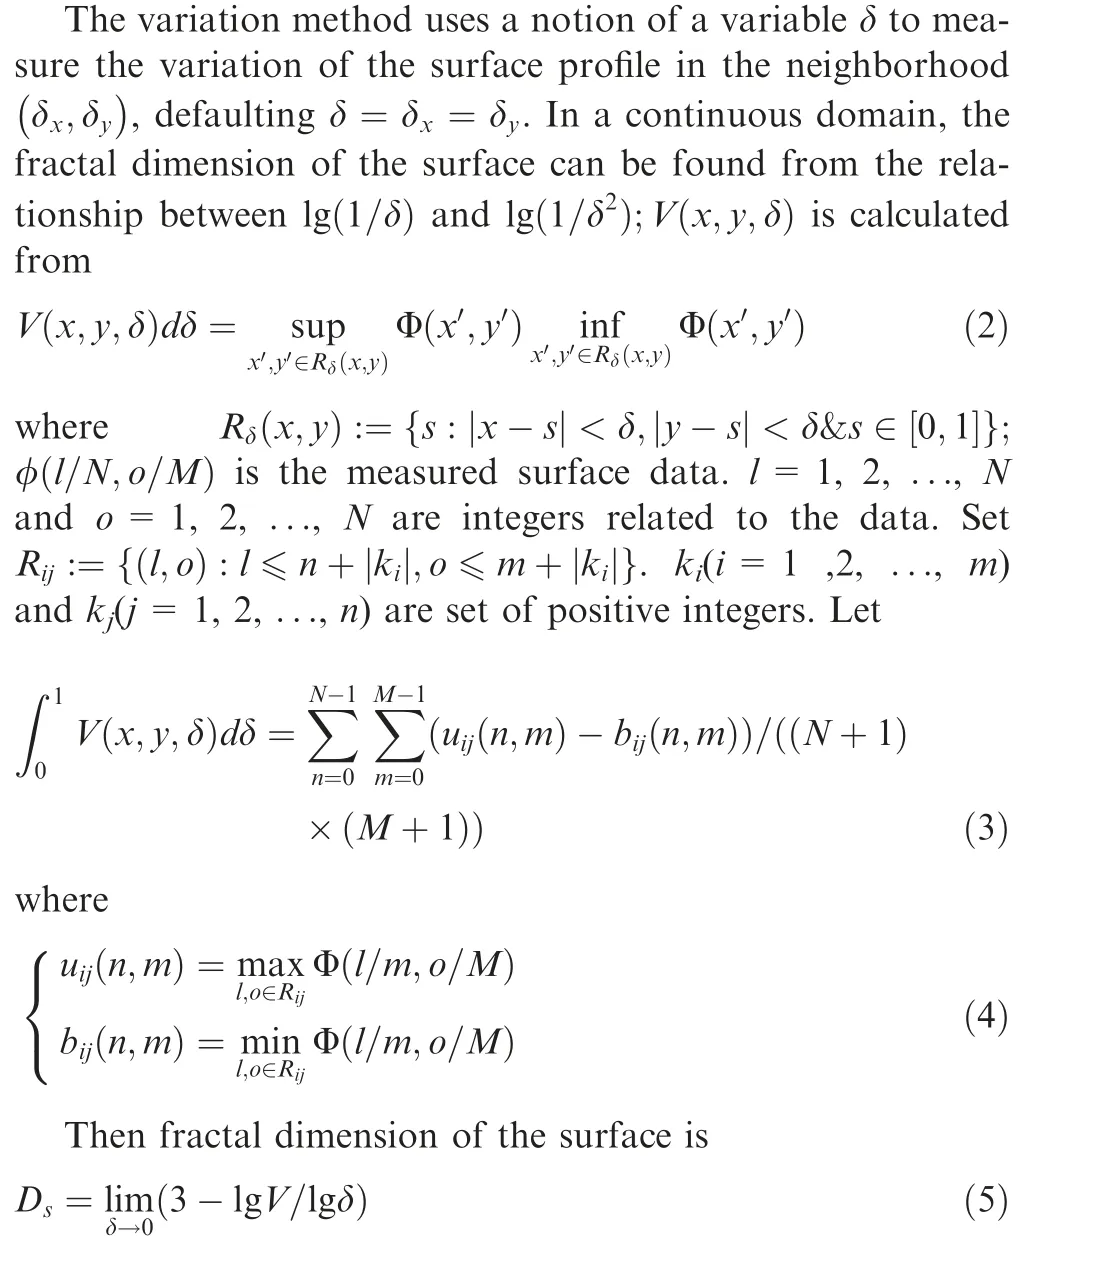
3.3. Surface anisotropy
Spectral moments of the surface profile can offer references on evaluating the anisotropy of profile and surface.The rth-order profile moment mrand rth-order surface moment mr-q,qare defined as36

where r=0,1,2,...,N and q=0,1,2,...,r. Then, the spectral moments m0and m2of the profile between the frequency bandwidth of ω1and ωhare
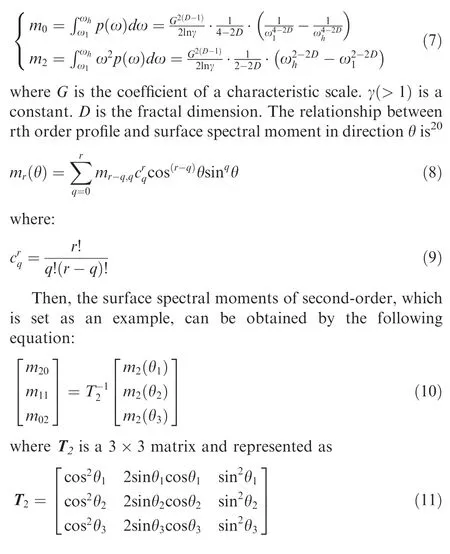
4. Combination prediction model
4.1. Dimension reduction analysis of high surface traits space
Based on the above analysis on surface traits, Young’s modulus, yield strength, tensile strength, and elongation at break can be predicted by multielement nonlinear regression analysis.However,its difficulty and calculation amount increase due to the high space dimensions of the independent variables constructed by the surface traits. Therefore, a new and lowdimension integrated trait space can be formed under the condition of little loss of original information by a useful dimension reduction analysis on the recombination of surface traits.
Notwithstanding,the new integrated traits are generated by the original surface traits,namely the specifics and amounts of the original surface traits do not change, the amount of the new integrated traits that take part in the regression analysis decreases. The test progress of the mechanical properties of the machined workpiece can be detailed as the dimension reduction analysis of the workpiece surface traits after captured is firstly carried out. The modeling and regression analysis is then carried out.The calculation cost can be saved,and the modeling difficulties can be reduced as well,by the dimension reduction analysis.
This paper adopts a general linear dimension reduction method, namely, principal component analysis (PCA).37Fig. 6 shows the relationship matrix of PCA. As can be seen from the table, the correlation between the surface anisotropy and the surface mean square root is only about -0.525, and the surface anisotropy has a small correlation with other surface traits. Hence, the surface anisotropy can be considered as an independently characteristic independent variable.
Table 5 shows the results of the Kaiser-Meyer-Olkin(KMO) and Bartlett’s test. As can be seen from the KMO results, which shows the sampling adequacy, the value is only about 0.589 in the case of the existing sample.It means that the existing samples can be barely taken for PCA, because the value is within the range of (0.5, 0.6].38,39Combining with the relationship matrix shown in Fig. 6,the lowest correlation degree is from surface anisotropy.Therefore,the surface anisotropy must be picked out from the PCA and deemed as an independently characteristic independently variable.
Fig. 7 shows the correlation coefficient matrix of four surface traits, including surface roughness, surface mean square root, surface figure accuracy, and 3D fractal dimension.Table 6 shows the KMO and Bartlett’s test of the PCA. The KMO value is already larger than 0.6, which means the PCA of four surface traits is now mediocre and acceptable.38,39Meanwhile, the P-value of Bartlett is smaller than 0.01, prov-ing that each surface trait has a good linear relationship.Thus,the selected surface traits can be dimensional reduction by the PCA. If the 3D fractal dimension were extracted out, the KMO value would increase, and the PCA could be improved to be Middling. However, an additional independent variable increases the difficulties of modeling as well. Therefore, the current model is accepted.

Table 5 KMO and Bartlett’s test.
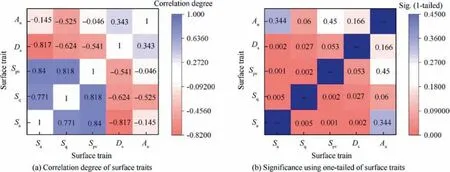
Fig. 6 Relationship matrix of PCA containing all factors.
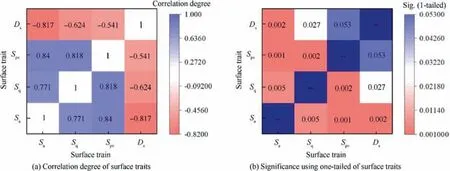
Fig. 7 Relationship matrix of PCA containing four factors.

Table 6 KMO and Bartlett’s test without surface anisotropy.
Fig. 8 is the common factor variance of PCA. As can be seen from the table,the initial degree of the variable mutation of each surface trait that can be explained equals to 1,namely 100%.In the extracted results,the degree of the variable mutation of the surface traits that can be explained is smaller than 100%.It means that the PCA reserves the common portion of all the surface trait variables.Thereinto,the variable mutation of Dscan be explained only by 68.3%.
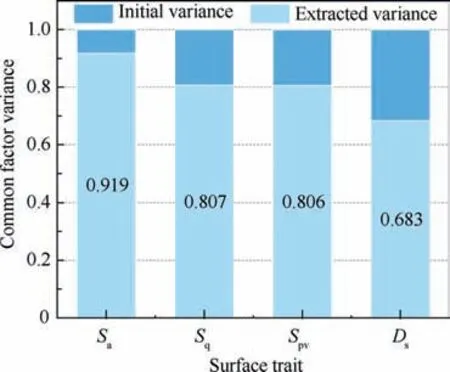
Fig. 8 Explained degree of variable mutations.
Fig. 9 shows the explained total variance of the PCA. The first principal component contains the most data of surface traits mutation, whose eigenvalue is about 3.214, accounting for 80.354% of the total accumulation. Combined with the analysis of Fig.10,only one principal component has an eigenvalue which is greater than one.The only principal component thus needs reserving.
Fig. 11 shows the component matrix, which represents the factor load matrix A in the PCA. The transfer matrix in PCA can be represented by the principal load matrix U and factor load matrix A, showing the relationship as follows,

where λiis the eigenvalue. Only one principal component is extracted in the PCA, then i=1. According to Eq. (12), the obtained principal component C1is

where the variables with superscripts denote the standard scores after standardized treatment on the eigenvalues of original surface traits. The relationship between standardized treatment and the eigenvalues of original surface traits can be illustrated as:

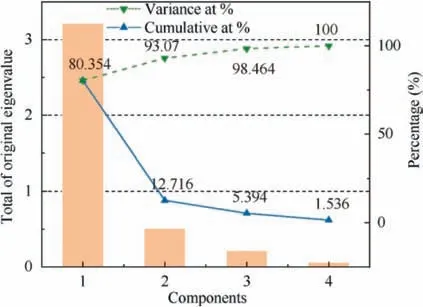
Fig. 9 Explained total variance.
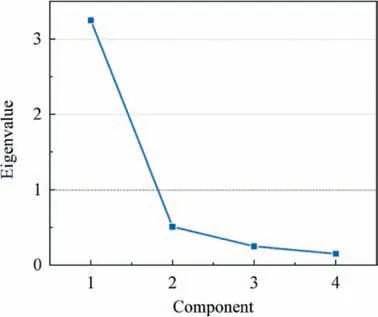
Fig. 10 Scree plot of principal components.
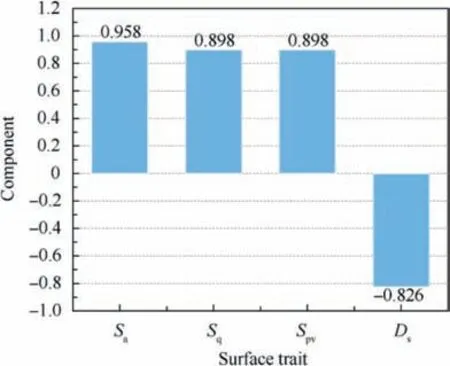
Fig. 11 Component matrix without considering surface anisotropy.
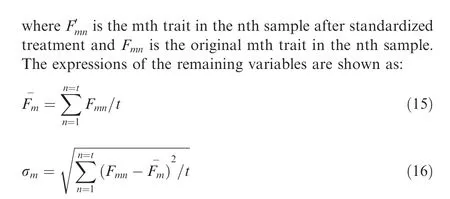
where t is the total number of samples. Then the mean matrix and the standard deviation matrix can be shown as follows respectively,
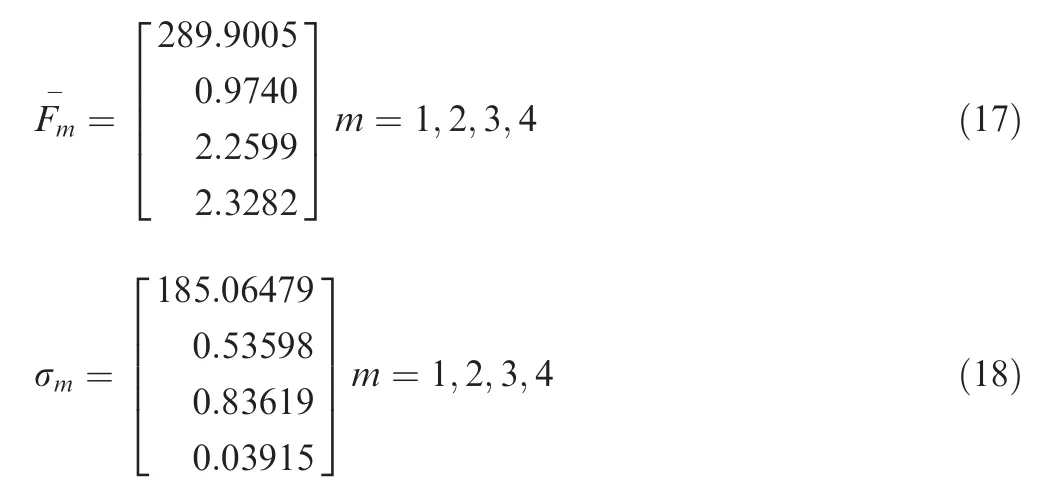
Then the principal component C1that formed by original surface traits can be shown as:

4.2. Prediction model based on PCA of surface traits
In the multivariate nonlinear regression analysis, polynomial regression can be used directly to predict the mentioned mechanical properties because the explanatory variable space of surface traits has been reduced to planar. The polynomial regression is a right choice due to its simple, intuitive, and small-cost computation.The pure quadratic form and quadratic form regression with cross-terms are comparatively analyzed. In the analysis, seven sets of data were used for regression analysis,and three sets of data were used for model verification. The regression results of the mechanical properties are shown in Fig. 12, where the predictive power of the proposed regression models is tested by R-squared, the significance of the F-test, and root-mean-square error (RMSE).
As can be seen from Fig. 12, the RMS and R-squared values of the polynomial fitting regression with cross term are smaller than those without cross terms. It means that the former models have better regression results on these mechanical properties,and the interaction of the principal component and surface anisotropy has impacts on mechanical properties. The RMS of Young’s modulus and yield strength,however,is only a little bit smaller than that of the latter models for Young’s modulus and yield strength, and the significance P shows that the models without cross term have more significance than the models with cross terms.Besides,the significance P of the two regression models for predicting Young’s modulus and yield strength is comparatively larger than those for predicting tensile strength and elongation at break. Hence, according to the analysis above,the regression models with cross term are more suitable for predicting tensile strength and elongation at break,and those without cross term are more suitable for predicting Young’s modulus and yield strength. The regression models are shown as follows:

where M is the surface anisotropy, and F is the principal component C1generated by PCA.Based on the above analysis,the changing trend of the predicted mechanical properties is shown in Fig.13,and the influence of the principal component generated by PCA on the mechanical properties can also be seen.The optimal Young’s modulus of the micro-milled thinwalled Elgiloy component appears when the principal C1is minimum, same with the condition of generating the optimal yield strength and tensile strength.However,there is no apparent law of the surface anisotropy corresponded by the optimal yield strength and tensile strength. It means that the surface anisotropy only has a significant impact on Young’s modulus and elongation at break of the thin-walled Elgiloy component after being micro-milled and does not have a significant impact on changing the rests of mechanical properties.
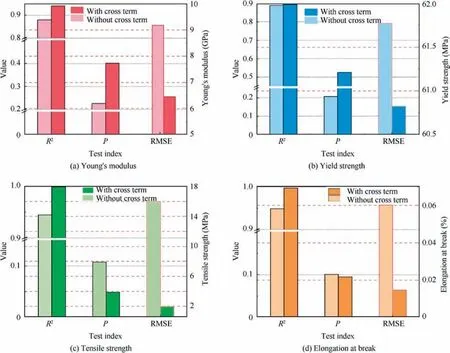
Fig. 12 P of statistic F and R2 of regressions.
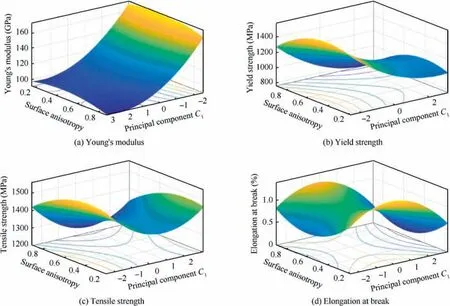
Fig. 13 Variation tendency of predicted mechanical properties.
The feasibility of the prediction model can be analyzed by the residual analysis and error analysis. There are no over fittings in each regression model, because only binary quadratic polynomial regression is used.Fig.14 shows the residual analysis and error analysis of each mechanical property in 95%confidence interval. The residual analysis shows that all the proposed prediction models are rational for the four mechanical properties. As can be seen from the results of error analysis, the maximum relative errors of Young’s modulus, yield strength, tensile strength, and elongation at break are 7.74%,10.62%, 9.59%, and 9.02%, respectively. Considering the maximum relative errors and the above analysis on significance P, the prediction models for Young’s modulus and yield strength still need improved,due to the limitations of deeming the factors as ideal linear in the polynomial regression analysis.
4.3. An extended prediction model based on SVR
To improve the prediction performance on Young’s modulus and yield strength, we should propose an extended prediction model for making up the insufficient prediction performance with consideration of using simple and small calculation due to its engineering application. Compared with the neural network, the SVR has excellent performance on data mining and feature recognition, such as being able to analysis on the case of small samples and easy to obtain the optimal global solution. Considering this experiment belongs to the case of a small sample, SVR is a good selection for predicting the remaining mechanical properties.
Aiming at nonlinear regression analysis, a nonlinear mapping is required to be established to map the sample to a higher dimensional feature space. The regression models are then established by mapping the established regression model in the higher dimensional feature space to the original feature space. In the SVR, a kernel function can be used to simplify the nonlinear approach.40The kernel function k(x,x′)satisfies k(x,x′)=<φ(x),φ(x′)>and the Mercer condition, and it is required to be an asymmetric positive real function. Where the Mercer condition is∫∫k(x,x′)g(x)g(x′)dxdx′>0, g ∈L2,The polynomial function is selected as kernel function in SVR because there is no overfitting and good significance level,combining with the analysis result in Fig. 13. Kernel function can be drawn as:

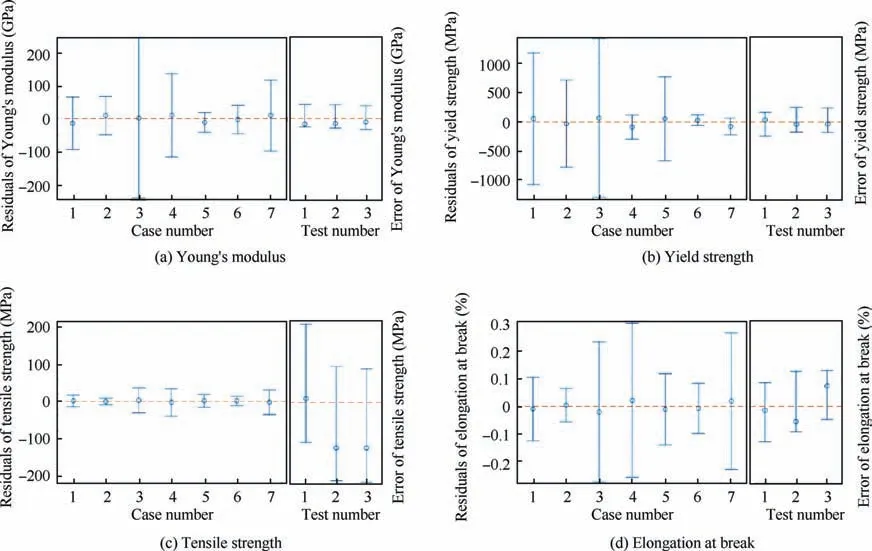
Fig. 14 Residual analysis of mechanical properties predicted by regression models.
where x denotes input variable space, symbol ‘‘<>”denotes inner product, φ denotes mapping function, and c is kernel function parameter. a is to specify a polynomial kernel of order a, and a=2 with regards to the polynomial regression analysis. Then, ε-SVR turns to the optimal solution,where α denotes dual variable.In the predictions,ε and C is 0.5 and 100, respectively. A data standardization, which is shown as Eqs. (14)-(16), is carried out before the prediction. The regression result of ε-SVR is shown in Fig. 15. The changing trend of tensile strength is basically the same as that in Fig. 13. However, the regression result of ε-SVR shows that the optimal Young’s modulus and yield strength appear when the principal component C1decreases to the minimum value,and the influence of surface anisotropy on the twos is slightly,compared with the condition that the principle component C1is large. As the predicted Young’s modulus and yield strength are within the standard changing ranges,the proposed models are deemed effective.To verify the regression performance and prediction accuracy of the ε-SVR, we tested the same above samples.Fig.16 shows the residual analysis and error analysis of predicting Young’s modulus and yield strength.The relative error decreases to 7.72% for Young’s modulus and 4.78% for yield strength,respectively.Compared with the binary quadratic polynomials without cross term, the relative error is only improved by 0.02%. However, the RMSE decreases from 14.194 GPa to 8.784 GPa with ε-SVR. This result shows that ε-SVR can make up the insufficient prediction performance of predicting Young’s modulus and yield strength by polynomials regression.
5. Conclusions
This paper provides a method to obtain mechanical properties of thin-walled specimens with avoiding destroyed through establishing a combination model of predicting mechanical properties based on HSD micro-milled surface traits. In the application of the models, Young’s modulus, yield strength,tensile strength, and elongation at break can be predicted through the one-time surface acquisition without any damage,and the simple construction of the models can easily adapt to the condition of random factors generated during the machining process, including the machining parameters. Combining the above analysis, some conclusions are drawn as follows.
(1) Comprehensive surface traits that are extracted from the HSD micro-milled surface can reflect the surface more integrally.Based on the analysis of ε-SVR,the machined surface cannot be comprehensively reflected merely by surface roughness and surface accuracy. In the regression analysis, the surface anisotropy has a great impact on Young’s modulus and elongation at break.Thus,it is better to extract as many surface traits as possible to fully reflect surface trait information and furtherly increase the prediction accuracy.
(2) The analysis results show that the binary quadratic polynomial models with cross terms have a good performance on predicting tensile strength and elongation at break,and the binary quadratic polynomial model without cross term has good performance on Young’s modulus and yield strength. Young’s modulus and elongation at break is significant affected by surface anisotropy when the principal component C1is constant,and a good surface quality helps to improve Young’s modulus,yield strength,tensile strength,and elongation at break.
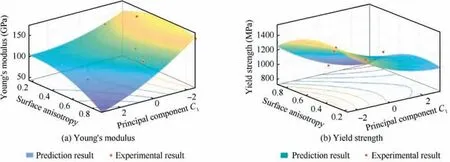
Fig. 15 Prediction and residuals analysis of tensile strength.

Fig. 16 Analysis of residuals and prediction errors for ε-SVR models.
(3) The ε-SVR model helps to improve the prediction accuracy and to make up for the insufficient prediction performance of binary quadratic polynomial models. The usage of ε-SVR decrease the RMSE of predicting Young’s modulus from 14.194 GPa to 8.784 GPa and the prediction error of yield strength from 7.72% to 4.78%.
(4) The maximum relative error is generated in the prediction of tensile strength.In the maximum prediction error of 9.59%,the influence of wall thickness is also included,which is generated by the machining error,and the influence is a significant factor that affects the prediction error. However, the machine tool with highpositioning-accuracy axis Z is used in the experiment,by which the thickness error is diminutive.
(5) If the model should be improved, the thickness of the micro-component needs detecting and implementing into the model as an influence factor, but increasing the measurement difficulties simultaneously.
Declaration of Competing Interest
The authors declare that they have no known competing financial interests or personal relationships that could have appeared to influence the work reported in this paper.
Acknowledgment
This work was supported by the National Key R&D Program of China (2018YFB2002201), China Postdoctoral Science Foundation (BX20190048) and National Natural Science Foundation of China (51905138).
 CHINESE JOURNAL OF AERONAUTICS2021年5期
- CHINESE JOURNAL OF AERONAUTICS的其它文章
- Ferrofluid moving thin films for active flow control
- Preliminary study on heat flux measurement data of TT-0 flight test
- An analysis and enhanced proposal of atmospheric boundary layer wind modelling techniques for automation of air traffic management
- Jet sweeping angle control by fluidic oscillators with master-slave designs
- Hot deformation behavior and microstructure evolution of the laser solid formed TC4 titanium alloy
- Electrochemical trepanning with an auxiliary electrode
