Hybrid method based on flame volume concept for lean blowout limits prediction of aero engine combustors
Lei SUN,Yong HUANG,*,Xiwei WANG,Zekun ZHENG,Ruixing WANG,Xing FENG
a Collaborative Innovation Center of Advanced Aircraft-Engine, National Key Laboratory of Science and Technology, School of Energy and Power Engineering, Beihang University, Beijing 102206, China
b School of Aerospace Engineering, Tsinghua University, Beijing 100084, China
c China Academy of Aerospace Aerodynamics, Beijing 100074, China
d Patent Examination Cooperation (Tianjin) Center of the Patent Office, CNIPA, Tianjin 300304, China
KEYWORDS Aircraft engines;Combustors;Flame volume;Hybrid method;Lean blowout limit;Prediction
Abstract The Lean Blowout (LBO) limit is crucial for the aircraft engines. The semi-empirical(such as Lefebvre’s LBO model and Flame Volume (FV) model), numerical and hybrid methods are widely utilized for the LBO limit quick prediction. An innovative hybrid method based on the FV concept is proposed.This method can be classified as a semi-empirical/physical based hybrid prediction method.In this hybrid method,it is assumed that the flame volume varies nearly linearly with the fuel/air ratio near the LBO. The flame volume is obtained directly by the numerical simulation using the threshold value of the visible flame boundary as 900 K.Then the final LBO limits is determined by the FV model. On the premise of keeping the good generality of prediction, the hybrid method based on the FV concept can further improve the prediction accuracy.The comparison with the prediction of the existing available methods on fifteen combustors shows that the hybrid method based on the FV concept achieves better prediction accuracy.The prediction uncertainties between the experimental results and the predicted values by the hybrid method based on the FV concept are within about ±10%.
1. Introduction
The Lean Blowout(LBO)limit is one the most critical parameters for the aero engine combustors.1The occurrence of the LBO may pose a serious hazard to the operation of the aero engines and further the aircraft.2Thus the LBO must be avoided within the whole flight envelope, especially for Lean Premixed Prevaporized (LPP) combustors.3Some methods,such as plasma-assisted method,4,5have also been developed to broaden the LBO limit. In the process of designing a new aero engine, the LBO limits need to be obtained before design finalization. However, it would take much time to determine the LBO limit for a specific combustor configuration by the traditional method, i.e., experimental tests.6Moreover, the cost of the tests is expensive. Thus, a quick prediction for the LBO limit can reduce the cost significantly. An accurate prediction method is urgently needed by the combustor designers.
Generally, the prediction methods include semi-empirical models, numerical method and hybrid method.7The swirlstabilized combustor is the most utilized type for the aero engines. During the past decades, the LBO mechanism and prediction methods for the swirl-stabilized aero engine combustors have been widely investigated. A series of semiempirical models have been obtained. Longwell et al.8firstly proposed that the recirculation zone behind a bluff body could be idealized as a Perfect Stirred Reactor(PSR)which could be regarded as the burning zone. The PSR model became one of the most fundamental assumptions for the study of the LBO semi-empirical models. Later, Lefebvre et al.9,10adopted the thought of the PSR and established a semi-empirical model,i.e. Lefebvre’s LBO model to predict the LBO limits of the swirl-stabilized combustors. Based on Lefebvre’s LBO model,the determinants of the LBO limits could be classified as 3 kinds of parameters,i.e.combustor geometries,operating conditions and the relevant fuel-dependent properties.11Moreover, Lefebvre’s LBO model was validated on eight combustors, including J79-17A, J79-17C, F101, TF41, TF39,J85, TF33 and F100, and the uncertainties are within about±30%.
As an available foundation, Lefebvre’s LBO model has been further improved by many researchers.In order to obtain predictions with better accuracy, Mongia et al.12,13utilized data reduction to analyze the test data. Then they optimized the parameters and exponents in Lefebvre’s LBO model.Ateshkadi et al.14utilized a function of the swirler to replace the constant in Lefebvre’s LBO model. Besides, they added a temperature dependent parameter in their improved model by data fitting of the experimental results.The above improvements could attain better prediction accuracy for those specific combustors. Xie et al.15proposed the FV model to develop Lefebvre’s LBO model with the help of the visualization experiments and further physical modeling. Based on the visualization experiments, the flame could not occupy the whole space inside the combustor liner near the LBO. Besides, the flame volumes varied with the combustor configurations. The FV model could accommodate the effects of the geometrical parameters of the dome and liner on the LBO limits. In the FV model, two parameters are added, i.e. the mass fraction of the dome air and the non-dimensional flame volume (the ratio of the flame volume to the combustor volume). The key point for utilizing the FV model was to obtain the flame volume of a specific combustor under the fixed operating condition. Later, Hu et al.16,17proposed a method of Fuel Iterative Approximation (FIA) based on the FV model. They stated that the results predicted by the FIA method agreed with the experimental results from Ref.11.Xiao and Huang18further considered the effects of the geometry of the swirl cup on the LBO limits. Sun et al.19,20extended the range of application of the FV concept to the multipoint lean direct injection combustors. In fact, the original FV model could just be utilized to analyze the existing experimental results. In order to utilize the FV model,the flame volume of a specific combustor under fixed operating condition is needed in advance.7,21
Besides the models derived from the PSR, some models were developed based on the Characteristic Time (CT) model.Based on the CT model,the shear layer between the main flow and the recirculation zone was regarded as the burning zone.11Zukoski and Marble22proposed a pioneering semi-empirical model.In their model,the criterion was that the ignition delay time of the fuel/air mixtures was equal to the shear layer mixing time. Plee and Mellor23,24improved the above model by including the droplet evaporation rates.They applied the criterion that the shear layer mixing time was equal to the sum of the ignition delay time and the droplet evaporation time.23,24This model has been validated on J85,T63 and AGT1500.25-27
In recent years,the numerical simulation for the flow characteristics is extensively investigated with the improvement of the numerical theory and computing capability. As a result,more and more studies were reported to analyze the LBO phenomena by the numerical simulations. The significant advantage of the numerical simulation is that the detailed flow fields, no matter non-reacting or reacting, could be obtained.7Almost all the studies by the numerical simulations revealed that the flow field shows intense instability under the condition near the LBO.28-32
On the other hand, Mongia et al.12pointed out that the available prediction methods could not achieve credible accuracy to design the combustor for modern aero engine.Epstein33advocated developing physical semi-empirical models or methods urgently.In summary,the methods which could be utilized to predict the key parameters of combustors quickly and accurately are needed.
Recently, some hybrid methods which integrated the numerical simulation and semi-empirical models have been proposed and developed.The hybrid methods could maximize the advantages of both the above two methods. Rizk and Mongia34,35introduced the multi-dimensional methods coupling to the semi-empirical models to predict the parameters of the aero engine combustors,such as the LBO limits.Considering the good performance of the FV model, the hybrid method which combined the FV model and the numerical simulation could be a promising method to achieve high prediction accuracy and keep the good generality. The key point for this hybrid method was to determine the flame volume of a fixed combustor configuration under fixed operating condition.Hu et al.17,21,36tried to use lean flammable limit and fuel concentration contour to determine the flame volume. In fact,the bright visible region was defined as the flame volume in the original study on the FV model based on the visualization experiments. Thus the flame volume defined by the criterion of the temperature should be a proper choice. The available criterion to define the flame volume in the aero engine combustors has been proposed in our recent study.37
In this paper,an innovative hybrid method which combines the FV model and the numerical simulation method is proposed. In this hybrid method, the flame volume is determined by the criterion of the temperature and obtained from the numerical simulation. This prediction method is named as the hybrid method based on the FV concept. The hybrid method based on the FV concept is utilized to predict the LBO limits of fifteen combustor configurations.The predicted LBO limits are compared with the experimental results to validate the accuracy of the hybrid method based on the FV concept. Then, the LBO limits predicted by the hybrid method based on the FV concept are compared with those predicted by the existing available prediction methods.
2. Methodology
2.1. Lefebvre’s LBO model
The typical flow field in a swirl-stabilized combustor based on Lefebvre’s LBO model is shown in Fig. 1. Lefebvre assumed that the flame could occupy the whole space inside the liner near the LBO. The liquid fuel was injected in the flame tube by an atomizer installed on the dome. Thus, all the air would participate in the combustion.
The expression of Lefebvre’s LBO model can be written as

where qLBO,A,fPZ,Vc, ˙ma,P3,T3,D0,λeffand LHV are overall fuel/air ratio at lean blowout, model constant in Lefebvre’s LBO model, mass fraction of air entering combustion zone or flame region, combustor volume ahead of dilution holes,total mass flow rate of combustor inlet, inlet pressure, inlet temperature of combustor, initial mean drop size, effective evaporation coefficient relative to that for JP4 and lower heating value of fuel, respectively.
2.2. FV model
Based on the visualization experiments,as shown in Fig.2,the flame identified by the bright visible region cannot occupy the whole space inside the combustor liner near the LBO. The flame in Fig.2 occupies a limited space downstream the dome.This phenomenon was also confirmed by the recent study of Ren et al.38Besides, the detailed flow field has significant effects on the flame characteristics.39
Xie et al.15simplified the typical flow field near the LBO based on their visualization experiments, as shown in Fig. 3.They assumed that the air fed through the dome and just a part of the liner into the flame tube participated in the combustion.They also assumed that the bright visible region was the flame volume, i.e. the burning zone where combustion took place.
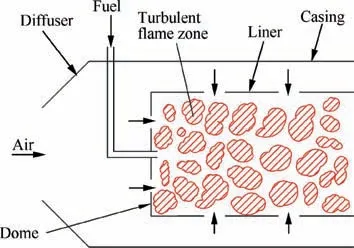
Fig. 1 Schematic of typical flow field in a swirl-stabilized combustor based on Lefebvre’s LBO model.
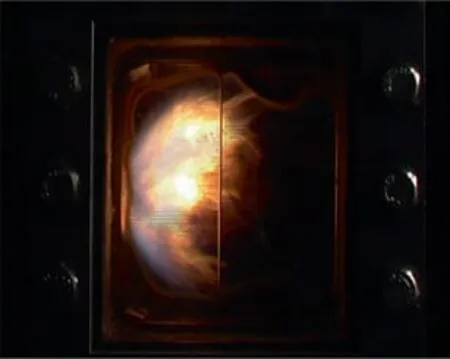
Fig. 2 Flame near LBO recorded by visualization experiments.
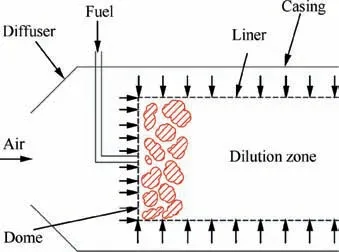
Fig. 3 Schematic of typical flow field in a swirl-stabilized combustor near LBO based on visualization experiments.
Based on the above assumptions, Xie et al.15derived the FV model. The expression of the FV model can be written as

where α and β are mass fraction of combustor dome airflow involved in combustion and non-dimensional flame volume,respectively.
The value of K in Eq. (2) is selected as 43 for all the combustor configurations in Xie’s study. The FV model has been further validated on 25 combustors with different configurations. The prediction uncertainty is about ±15%.
2.3. Hybrid method based on FV concept
The original FV model can just be utilized to analyze the existing experimental results instead of predicting the LBO limit for a fixed combustor under the fixed operating conditions. The flame volume of a fixed combustor under the fixed operating conditions is a prerequisite for the prediction of LBO limits by FV model.7,21
In the present study, the hybrid method based on the FV concept is a method that combines the FV model and the numerical simulation method. The flame volume at the LBO point is determined by the criterion of the temperature and the correlation of flame volume with fuel/air ratio. This method can be classified as a semi-empirical/physical hybrid prediction method. Specifically, the semi-empirical/physical model, i.e. the FV model, is utilized to achieve the prediction of the final LBO limits with the help of the detailed flow field simulated by numerical method.
The schematic of the hybrid method based on the FV concept is shown in Fig.4.There are two curves in Fig.4,i.e.,the FV model and the correlation of flame volume with fuel/air ratio.The FV model was proposed based on the energy conservation of a perfect stirred reactor.On the other hand,the correlation of the flame volume with fuel/air ratio for a fixed combustor configuration is determined by the flow field and chemical kinetics.
The region above the curve of the FV model is the stable combustion condition for the combustors. On the contrary,the region below the curve of the FV model is the extinction condition for the combustors. The LBO occurs on the curve of the FV model. This means that the curve of the FV model is the lean limit.
For a fixed combustor configuration under the fixed operating conditions, a fixed curve of the FV model rather than a fixed point can be obtained and plotted in the coordinate system.All points on this fixed curve fit the FV model.However,the LBO limit should be unique if the combustor configuration and operating conditions are fixed. So another limitation should be introduced to obtain a unique LBO limit.In the present study,the correlation of flame volume with fuel/air ratio is utilized based on our previous studies.37
For a fixed combustor configuration at the fixed operating pressure and inlet air mass flow rate, the flame volume varies with fuel mass flow rate, i.e. fuel/air ratio. This curve does not coincide with the curve of the FV model. Besides, these two curves might intersect at one point because the slope of these two curves are different for the aero combustors. Thus,the LBO might occur at this point of intersection. This is the mechanism to determine the LBO limit by the hybrid method based on the FV concept.
The flame region can be identified by some parameters,such as flammable limit, fuel concentration, reaction rate,etc. In our previous visualization experiments of the LBO to validate the FV model, the flame was identified by the bright visible region on the image. Thus in the present study, the flame region is identified by the iso-surface of the fixed temperature.Ahmed and Huang37simulated the reacting flow field in the combustors that were utilized in our previous study. Then he compared the numerical results with the experimental results. He suggested that the threshold value of the temperature should be about 900 K for the combustors investigated in the present study.Thus,900 K is chosen as the threshold value of the temperature to identify flame for the hybrid method based on the FV concept.The reacting flow field in combustor can be obtained by the numerical simulation. For a specific combustor whose geometrical parameters are known, a series of flame volumes at different fuel mass flow rates can be obtained at fixed inlet air mass flow rate and pressure.
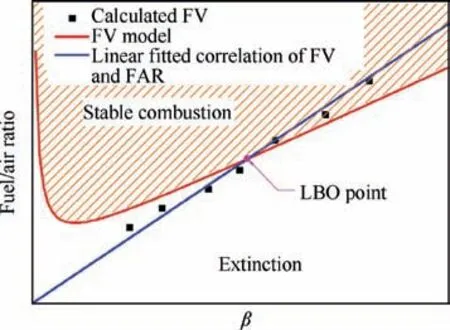
Fig. 4 Schematic of hybrid method based on FV concept.
Thus, the two essential prerequisites are complete for the hybrid method based on the FV concept.Then,the LBO limits for the aero engine combustors can be predicted by this hybrid method.
3. Experimental setup and procedure
3.1. Experimental setup
The LBO experiments were conducted in the fundamental combustion laboratory of Beihang University. Fig. 5 shows the test rig for the LBO which was 1/18 of an annular combustor. The schematic of the cross section of the test rig is shown in Fig.6.Fig.7 shows these three types of swirl cups utilized in the test rig, including dual-axial, axial-radial and dual-radial swirl cups. The operating conditions were as follows: the air mass flow rate of the test rig inlet was 0.589 kg/s; the inlet air temperature without preheat during the experiment was about 300 K; the pressure in the combustor liner was about 320 kPa.
Fifteen combustor configurations with different combinations of the components were investigated in the present study.There are four typical components in the present combustor,i.e.swirl cup(dual-axial/axial-radial/dual-radial),venturi(different throat curvatures), flare (different outlet angles), and primary holes (different hole arrangements). Fig. 8 shows the schematics of the different types of the combustor dome.The types and variation of the swirl cup, venturi and flare can be shown clearly in Fig. 8. Fig. 9 shows the schematic of the variation of the primary holes arrangement. The combustor volumes keep unchanged as 0.00129 m3for all the combustor configurations. The dome height and length of the combustors are 92 mm and 226 mm, respectively.15,17,40The detailed configuration parameters of the combustors are shown in Table 1. In Table 1, Apriand Asecare the effective area of primary swirler and secondary swirler, r1and r2are the curvature radius upstream and downstream from the venturi throat, δ is the outlet angle of flare.
The LBO limit is defined as the ratio of the fuel mass flow rate to the air mass flow rate when the LBO occurred, i.e.

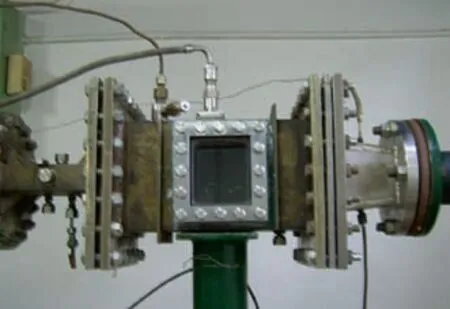
Fig. 5 Test rig for LBO.
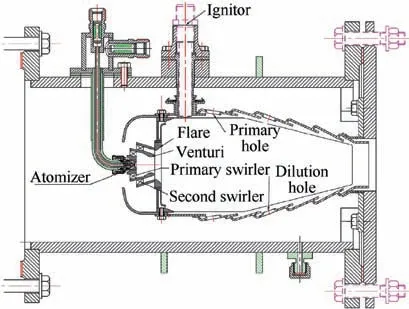
Fig. 6 Schematic of cross section of test rig.
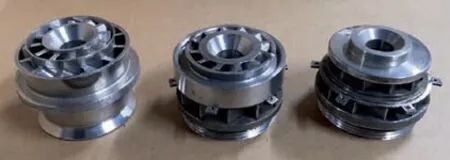
Fig. 7 Different types of swirl cups (from left to right: dualaxial, axial-radial and dual-radial swirl cups).
where ˙mfand ˙maare the fuel and air mass flow rate,respectively.
Based on the previous studies,15,19the experimental uncertainties mainly derive from these aspects: (A) instruments, (B)manual adjustment, (C) signals acquisition, (D) calibration,etc. The experimental uncertainties are analyzed by both the linear method and Root-Sum-Square (RSS) method,respectively.
If the linear method is utilized, as the definition of the global lean blowout fuel/air ratio in Eq. (3), the relative uncertainty can be written as

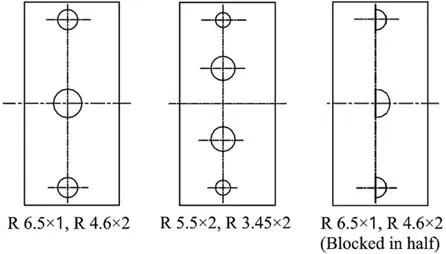
Fig. 9 Schematic of variation of primary holes arrangements.
where the first and second terms on the right side denote the relative uncertainties of the fuel and air mass flow rate,respectively. The relative uncertainty of the fuel mass flow rate includes the calibration uncertainty of the fuel injector, the instrument uncertainty, the manual adjustment uncertainty and the signal acquisition uncertainty, i.e.,

where ef,c, ef,i, ef,mand ef,sdenote the calibration uncertainty,the instrument uncertainty,the manual adjustment uncertainty and the signal acquisition uncertainty of fuel mass flow rate,respectively.
The relative uncertainty of the air mass flow rate includes the instrument uncertainty, manual adjustment uncertainty and signal acquisition uncertainty, i.e.

where ea,i, ea,mand ea,sdenote the instrument uncertainty, the manual adjustment uncertainty and the signal acquisition uncertainty of air mass flow rate, respectively.
Table 2 shows the value list of uncertainties.
The uncertainty of the LBO limits is the sum of the above uncertainties listed in Table 2, i.e. ΔqLBO/qLBO=±3.95%.Thus the measurement uncertainty of the LBO limits is within±4% if the linear method is utilized for the experiments in this paper.
If the root-sum-square method is utilized,19the relative uncertainty can be written as

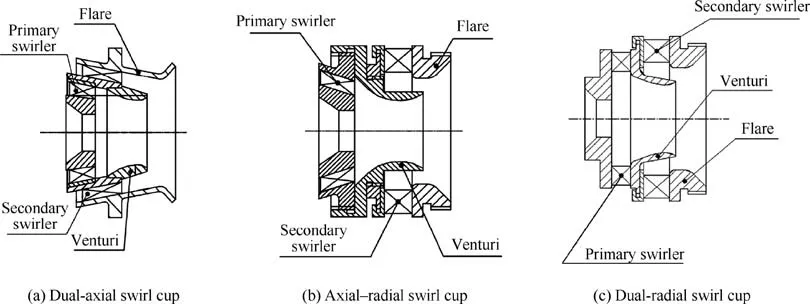
Fig. 8 Schematics of different types of combustor dome.
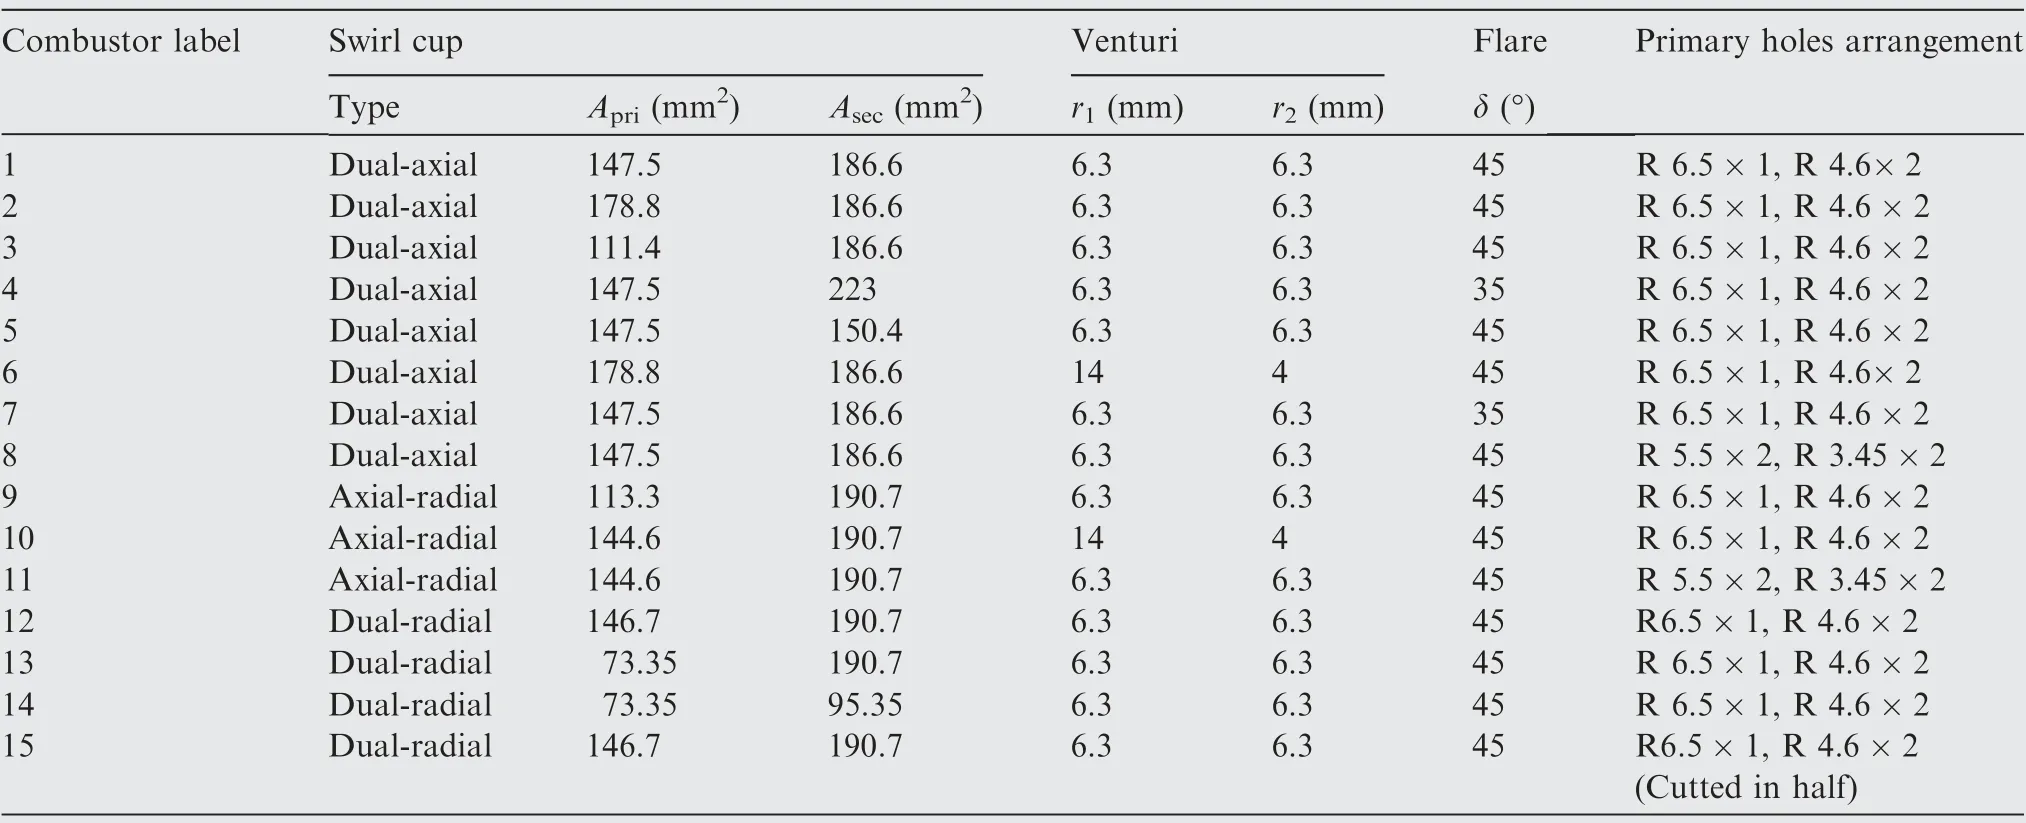
Table 1 Detailed configuration parameters of combustors.

Table 2 Value list of uncertainties.
where the first and second terms on the right side denote the relative uncertainties of the fuel and air mass flow rate,respectively.
The relative uncertainty of the fuel mass flow rate includes the calibration uncertainty of the fuel injector, the instrument uncertainty,the manual adjustment uncertainty and the signal acquisition uncertainty, i.e.

The relative uncertainty of the air mass flow rate includes the instrument uncertainty, manual adjustment uncertainty and signal acquisition uncertainty, i.e.

Substituting the values in Table 2 into Eqs. (8) and(9), the relative uncertainty of the fuel and air mass flow rate can be obtained.Thus the measurement uncertainty of the LBO limits is within ±2% if the root-sum-square method is utilized for the experiments in this paper.
3.2. Experimental setup
The detailed procedure of the LBO experiment can be referred to Ref16:
Step 1. Before the experiment, all sensors, data acquisition system and camera are started.Then the valve of air supply system is opened to regulate the air mass flow rate to a proper value. The pump of fuel supply system is opened to regulate the fuel mass rate to reach a proper value.
Step 2. The ignitor is started to achieve successful ignition.The fuel and air mass flow rate are increased quickly until the air mass flow rate and the combustor pressure reached about 0.589 kg/s and 320 kPa, respectively. Then the air mass flow rate and combustor pressure are kept at about 0.589 kg/s and 320 kPa, respectively. The fuel mass flow rate is decreased gradually to the occurrence of the LBO.It must be noted that when the fuel mass flow rate reaches a new value,all the operation conditions are needed to keep enough time to ensure the thermal equilibrium.
Step 3.When the LBO occurred,the valve of the fuel supply system is closed firstly.Then the valve of the air supply system is closed. Finally, all sensors, data acquisition system and the camera are closed.
4. Numerical simulations
In the present study, ICEM CFD 17.0 and ANSYS Fluent 17.0 are applied for grid generation and numerical simulation,respectively. The reactive flow fields in the combustors are simulated.
4.1. Computational domain and boundary conditions
The computational domain and boundary conditions are shown in Fig. 10. The mass flow rate at the air inlet is 0.589 kg/s. The air temperature is set as 300 K. The operating pressure is set as 320 kPa.Thus the static pressure at the outlet is set as 0 Pa.The type of the boundary conditions for the casing and liner is wall. The Discrete Phase Model (DPM) is utilized for the fuel inlet.
4.2. Grid generation
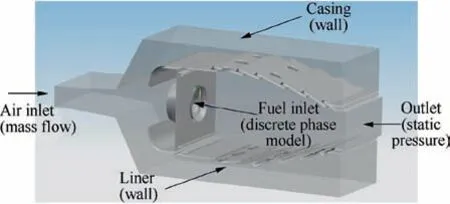
Fig. 10 Schematic of computational domain and boundary conditions.
The computational grid is generated by the ICEM CFD 17.0.The mixed grid is applied in the computational domain due to the complicated configuration. Specially, the computational domain can be divided into two parts, i.e. the regular zone and the irregular zone. The structured grid and unstructured grid are generated in the regular zone and the irregular zone,respectively. Then, the structured grid and unstructured grid are merged on the interfaces, which makes the computational domain connected. The grids near swirlers, primary holes and cooling holes are locally refined. The total grid was about 3.5 million for all cases.
4.3. Relevant models
Reynolds Average Navier-Stokes (RANS) is adopted in the present study to simulate the reacting flow field. Realizable k-ε model is utilized for simulating turbulence. The transport equations for turbulent kinetic energy k and turbulent dissipation rate ε are
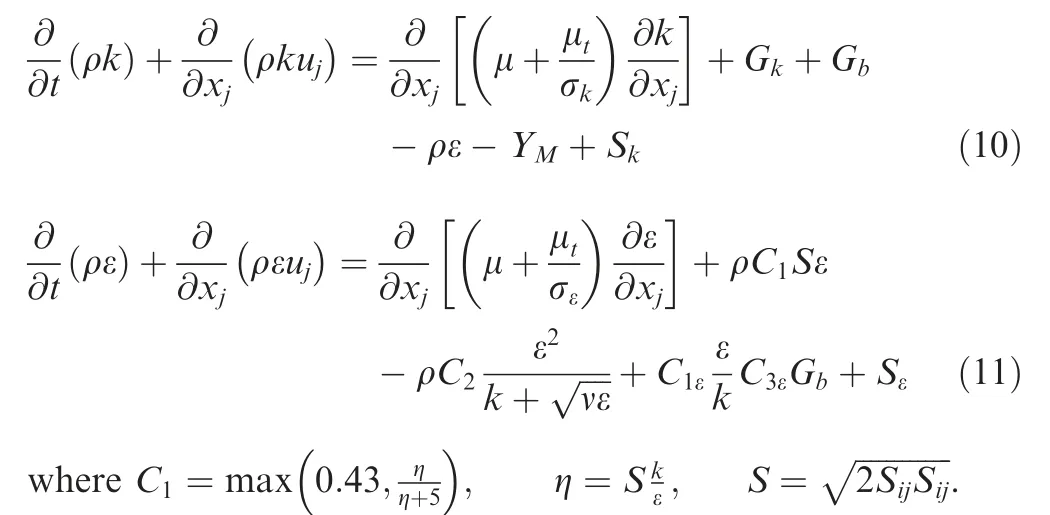
Non-premixed combustion model is utilized for simulating combustion of aviation kerosene in the combustor. A reduced reaction mechanism with 23 reaction steps of Jet-A fuel is utilized.41
4.4. CFD post-processing
When the numerical simulations are completed, the spatialresolved flow fields can be obtained. The zone whose temperature is less than the threshold of the temperature (900 K)can be blanked. The retained zone is the flame zone obtained by the numerical simulations. Then the flame volume can be calculated by integration in the flow field.
5. Results and discussion
5.1. Measurement of LBO limits
The LBO limits measured by the experiments are shown in Table 3. Based on the previous section, the mass flow rate of the test rig inlet, the air temperature during the experimentand the pressure in the combustor liner are 0.589 kg/s, 300 K and 320 kPa, respectively. The experiment for a fixed configuration repeats three times. The LBO limits in Table 3 are the average values of three data. Compared with the previous results obtained by Xie et al.15, the results show good repeatability.
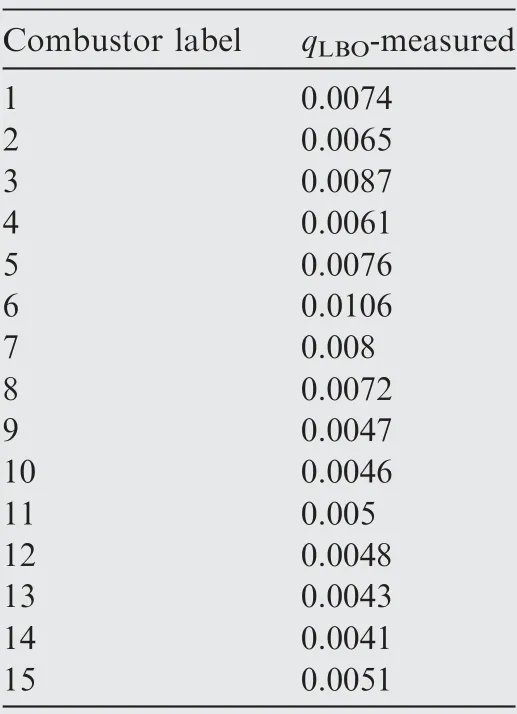
Table 3 LBO limits measured by experiments.
5.2. Variation of flame volume with fuel/air ratio
Fig.11 shows the variation of the flame region in the combustor with the fuel/air ratio q(here the combustor whose label is 8 is taken as the example, and the LBO limit obtained by the experiment is about 0.0072)obtained by the numerical simulation. The red surface in the liner is the iso-surface whose temperature is 900 K. The regions in the red surfaces denote the visible flame region. The fuel/air ratio in Fig. 11 is closed to the LBO limit. Specifically, the increment of the fuel/air ratio is about 0.00072. It can be seen that the flame region in the combustor decreases with the decrease of the fuel/air ratio.
Fig. 12 shows the linear fitted curve of the flame volumes obtained by the numerical simulation. The black squares denote the flame volumes at given fuel/air ratios corresponding to Fig.11.The red straight line denotes the linear fitted curve.It can be seen that the straight line agrees well with the black squares. Based on the subsequent part of this paper, it can be further verified on all the combustor configurations that the calculated flame volumes vary nearly linearly with the flame volumes when the condition is near the LBO. On the other hand, Hu’s previous study showed that the volumes defined by the lean flammable limit also varied nearly linearly with the fuel/air ratio near the LBO.17These two results can support each other.
5.3.LBO limits predicted by hybrid method based on FV concept
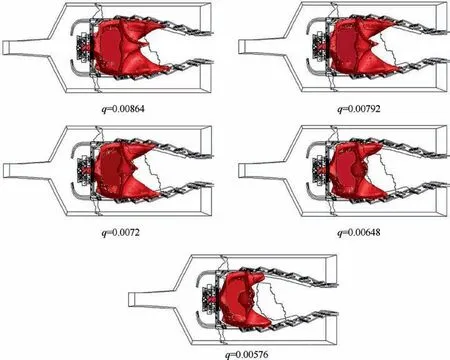
Fig. 11 Variation of flame region with fuel/air ratio for combustor whose label is 8 near LBO.
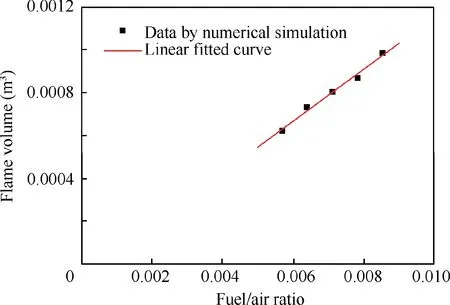
Fig. 12 Linear fitted curve of flame volumes calculated by numerical simulation.
Based on the previous part, it can be assumed that the flame volumes vary nearly linearly near the LBO.On the other hand,the curve of the FV model can also be plotted on the same coordinate system. Then, the LBO point can be determined by the intersection of the linear fitted curve between the nondimensional flame volume and fuel/air ratio and the curve of the FV model.This is the hybrid method based on the FV concept. Fig. 13 shows the schematics of the LBO point determined by the hybrid method based on the FV concept for the fifteen combustor configurations. In Fig. 13, the black squares denote the data obtained by the numerical simulation,and the red straight lines denote the linear fitted fuel/air ratio with the non-dimensional flame volume β. The dark blue curves denote the FV model.It can be seen that near the intersections, i.e. the LBO, the flame volumes vary nearly linearly with the fuel/air ratios.
Based on Fig. 13, the LBO limits of the fifteen combustors predicted by the hybrid method based on the FV concept can be obtained, as shown in Table 4.
5.4. Comparison of predicted LBO limits by hybrid method based on FV concept and measured values by experiments
The comparison of the LBO limits predicted by the hybrid method based on the FV concept and the measured values by the experiments is shown in Fig.14.The columns filled with solid color and oblique lines denote the LBO limits measured by the experiments and the hybrid method based on the FV concept, respectively.
The prediction uncertainty is defined as

Fig. 15 shows the prediction uncertainties of the hybrid method based on the FV concept.The prediction uncertainties of the hybrid method based on the FV concept are within±10%.
5.5. Comparison of predicted LBO limits by hybrid method based on FV concept and other methods
In this part, the LBO limits predicted by the hybrid method based on the FV concept are compared with those predicted by Lefebvre’s LBO model, FIA method,16,17and Hu’s hybrid method.21,36Fig. 16 shows the comparison of the predicted LBO limits between the hybrid method based on the FV concept and other methods. The LBO limits predicted by Lefebvre’s LBO model remain as constant due to its incapability of accommodating the effects of the variation of the combustor dome. Thus the prediction uncertainties can reach ±45%for the present combustor configurations. Besides Lefebvre’s LBO model, the LBO limits predicted by other methods can agree well with the experimental results.The prediction uncertainties of FIA method and Hu’s hybrid method are ±20%and ±16%, respectively. Thus the hybrid method based on the FV concept can achieve a better prediction uncertainty(±10%). For all the above methods except for the Lefebvre’s LBO model, the flame volume is obtained by the numerical simulation. Specifically, the flame volume in FIA method and Hu’s hybrid method is indirectly obtained from the lean flammable limit which is determined by the fuel distribution.On the contrary,the flame volume in the hybrid method based on the FV concept is obtained directly from the region enclosed by the iso-surface whose threshold value of the temperature is 900 K. On the other hand, based on the original procedure of the development and verification of the FV model, the flame volume is directly obtained from the bright visible region which is a result of high temperature.15This might be a reasonable explanation that the hybrid method based on the FV concept can achieve better prediction than the previous methods.
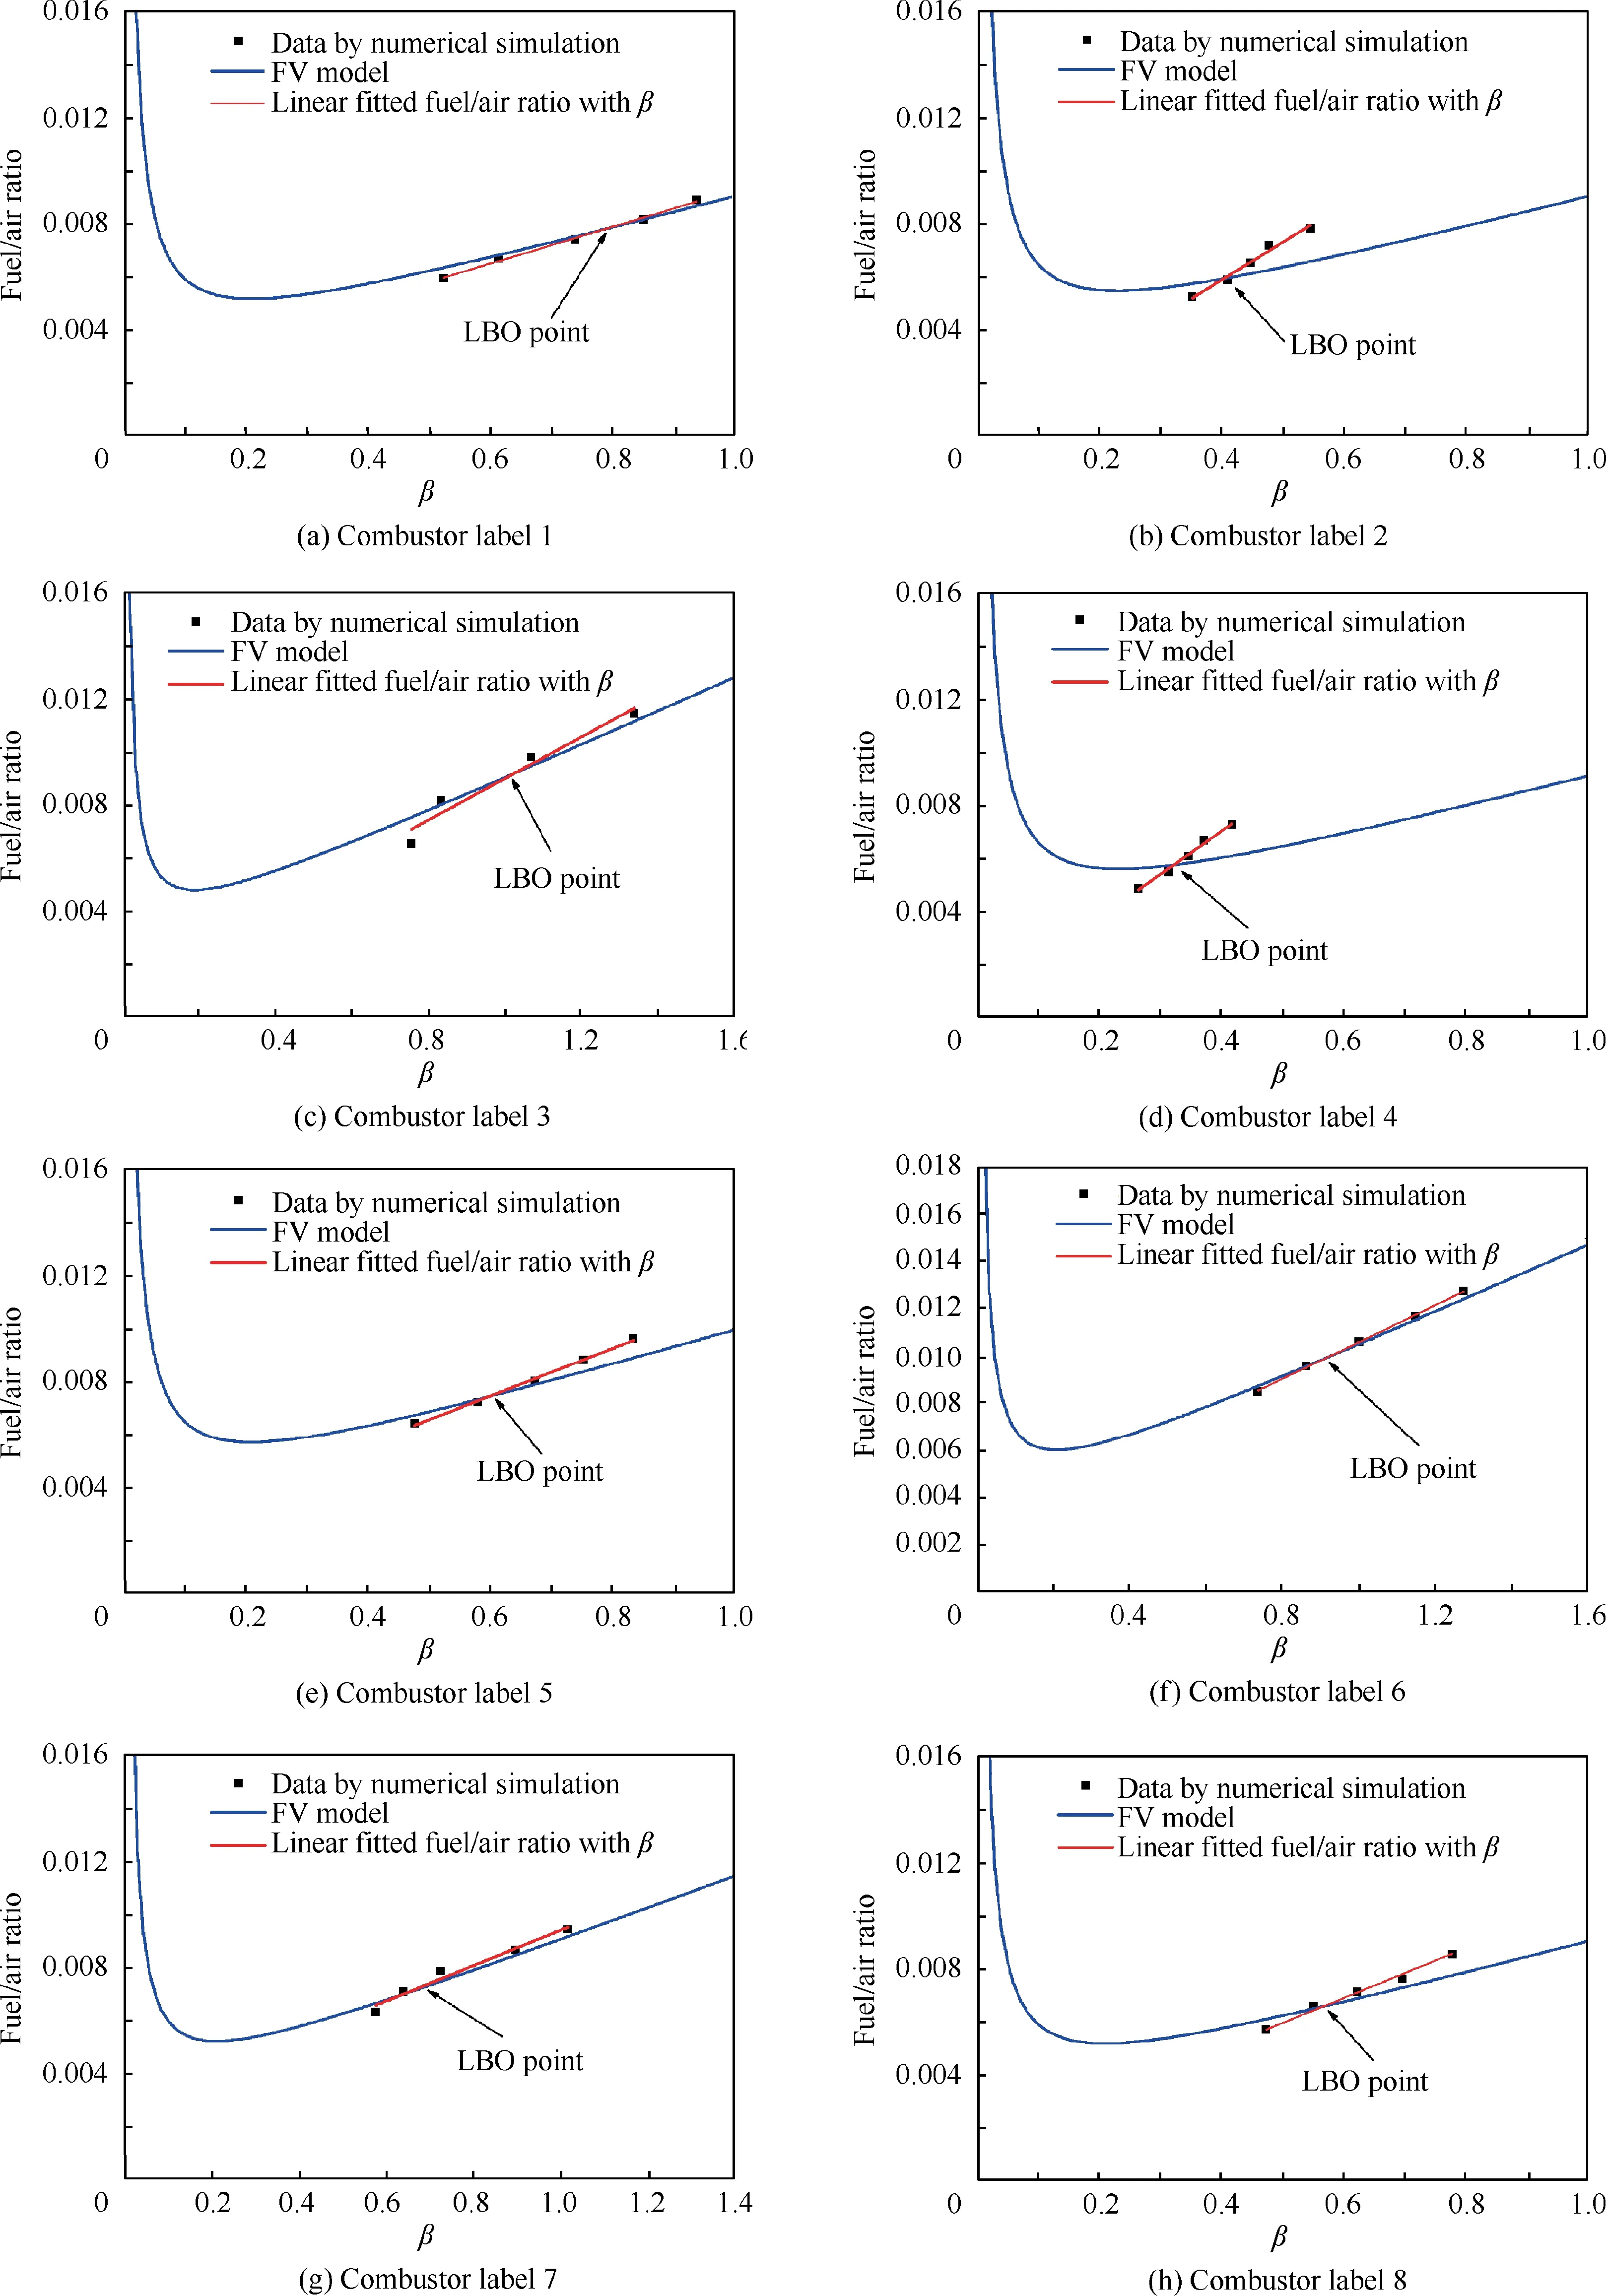
Fig. 13 Schematics of LBO points determined by hybrid method based on FV concept for fifteen combustor configurations.
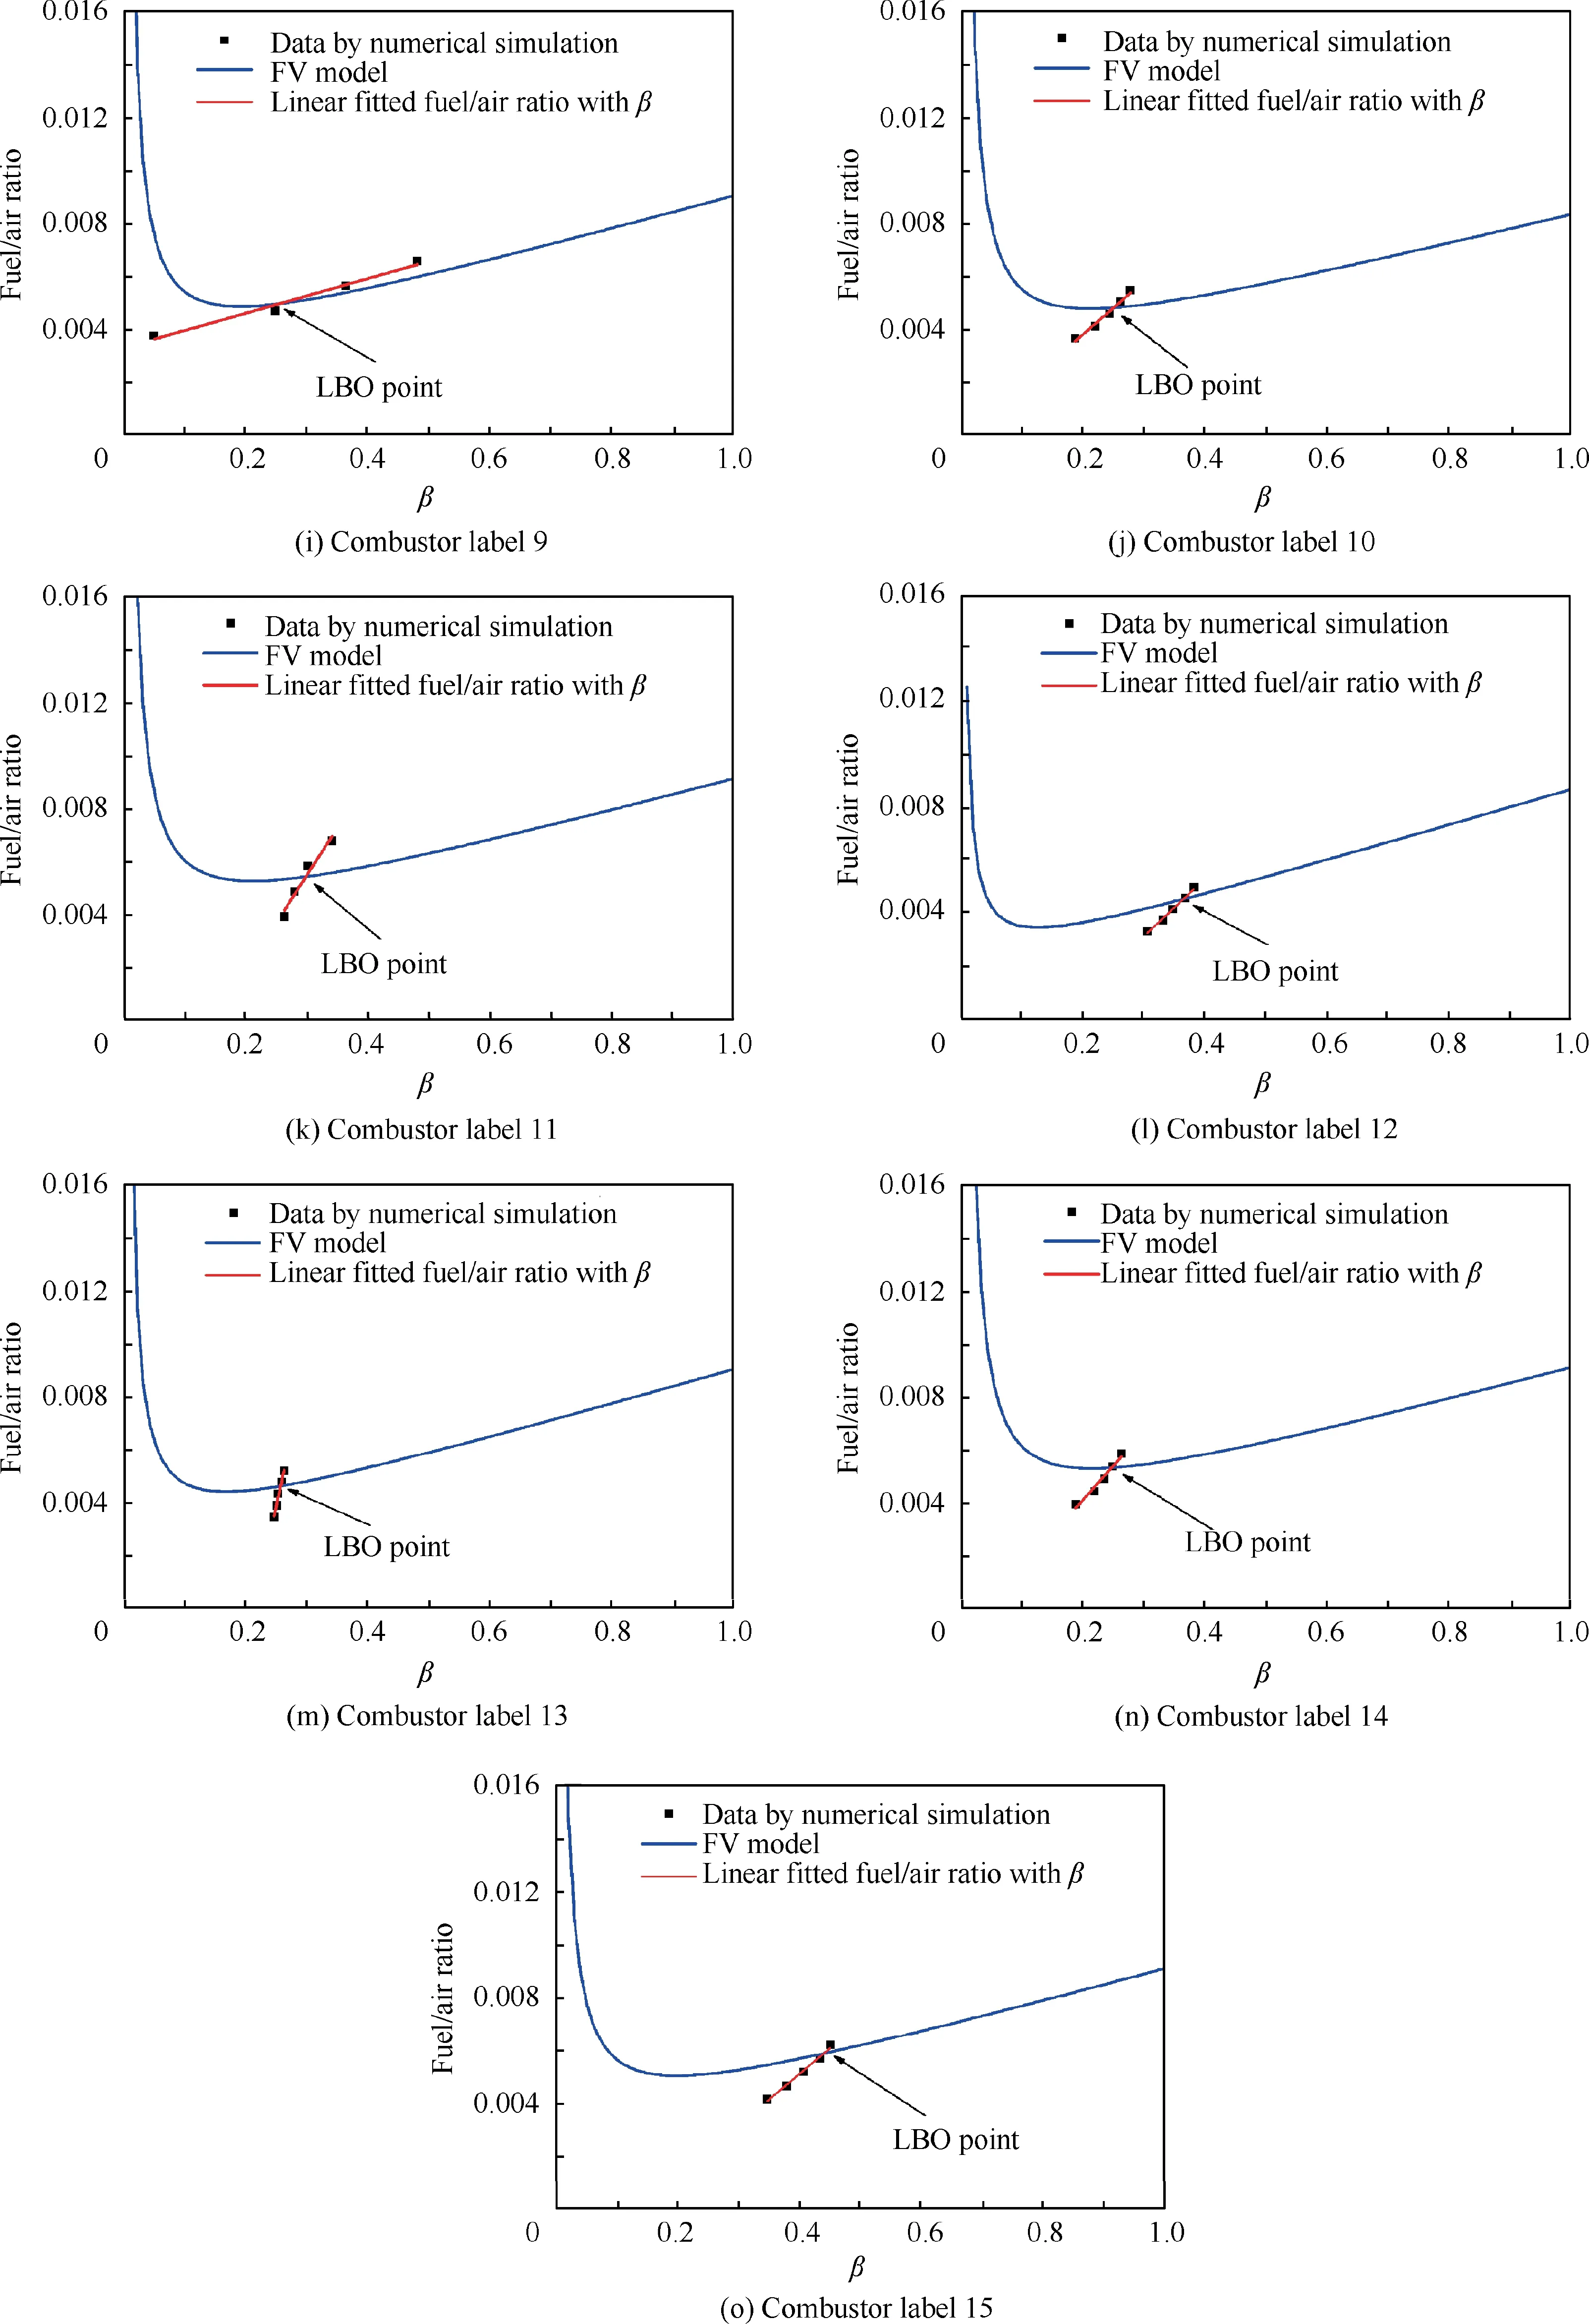
Fig. 13 (continued)
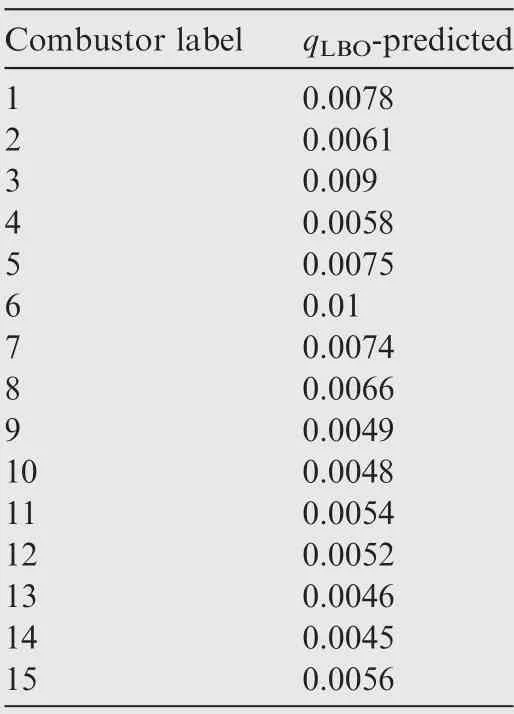
Table 4 LBO limits predicted by hybrid method based on FV concept.
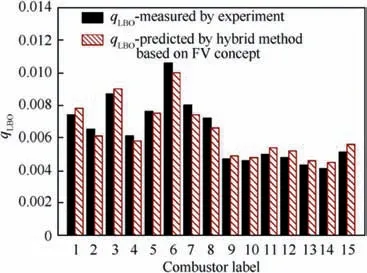
Fig. 14 Comparison of LBO limits predicted by hybrid method based on FV concept and measured values by experiments.
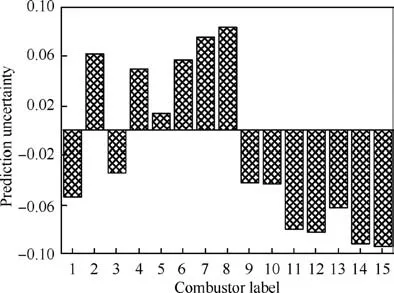
Fig. 15 Prediction uncertainties of hybrid method based on FV concept.
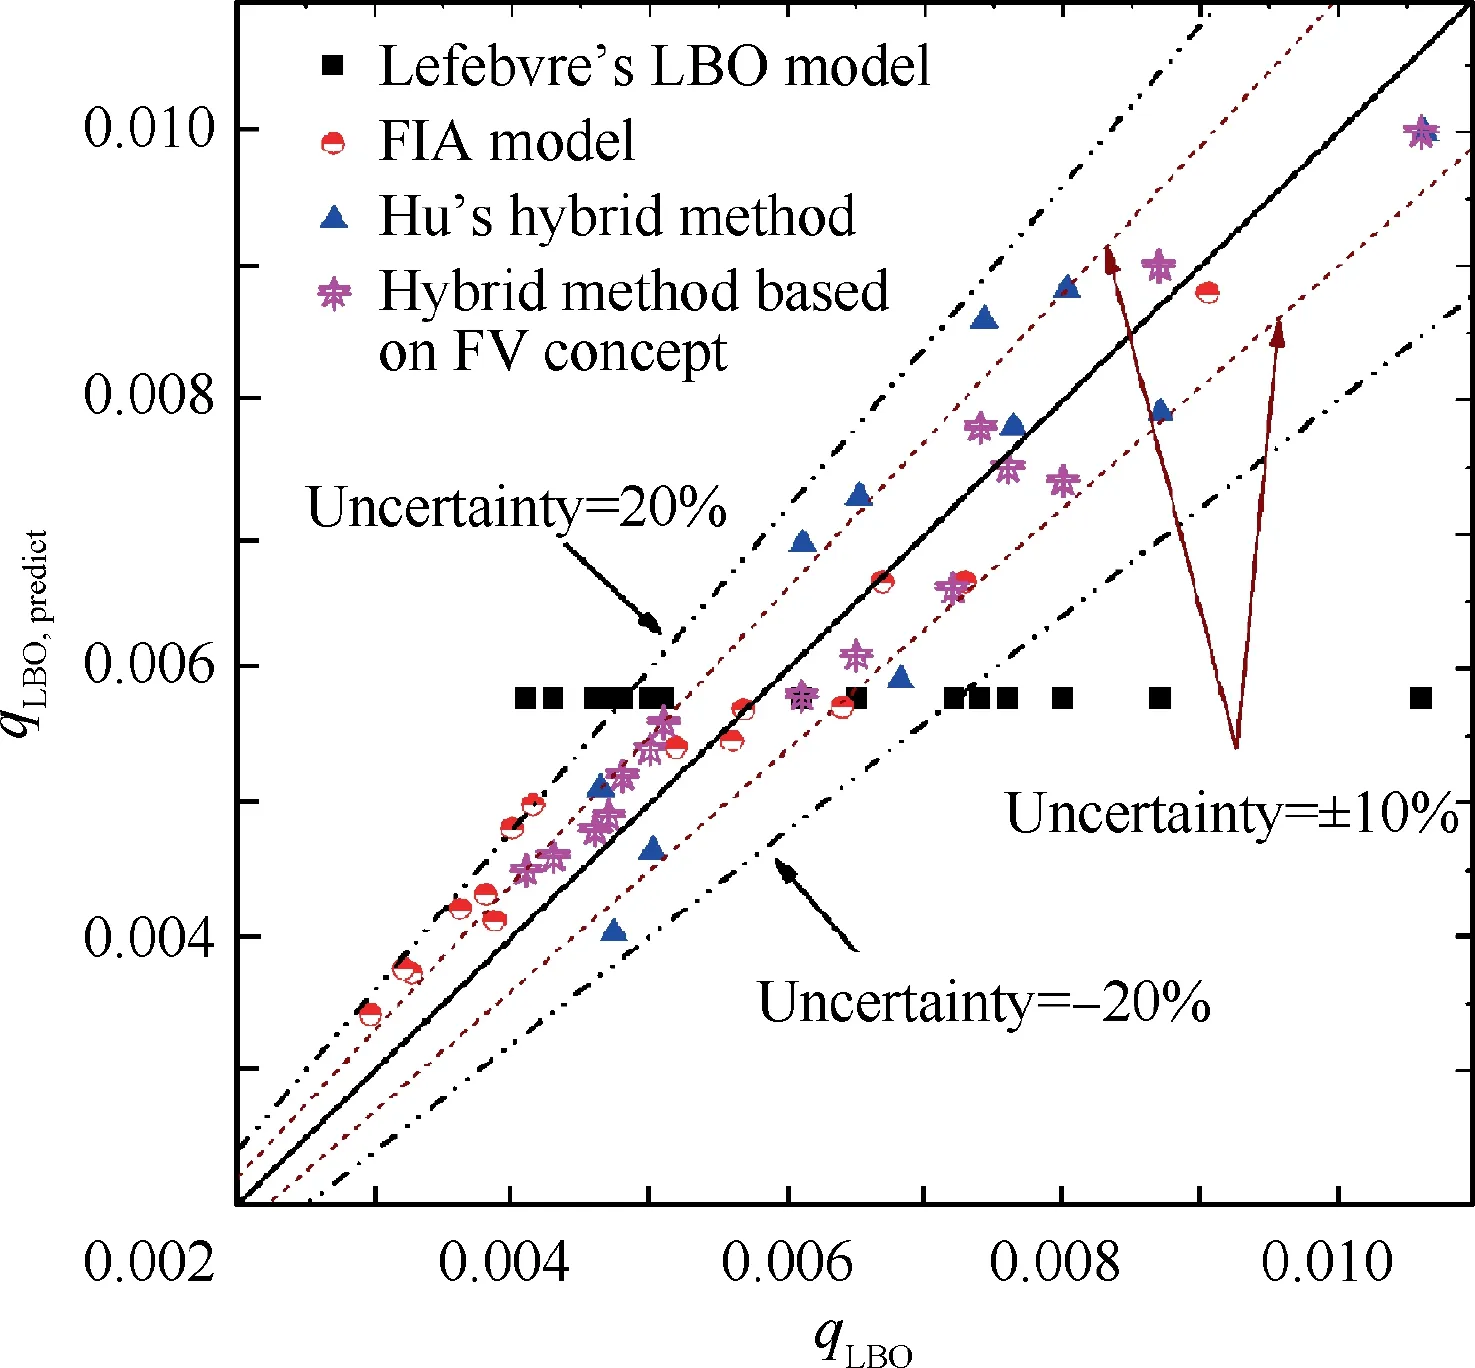
Fig. 16 Comparison of predicted LBO limits between hybrid method based on FV concept and other methods.
6. Conclusions
In this paper, the hybrid method based on the FV concept is proposed.This method is applied to predicting the LBO limits of fifteen combustor configurations with different combinations of the components. The prediction results are compared with the experimental results and the LBO limits predicted by other methods. The following conclusions can be drawn:
(1) The hybrid method based on the FV concept is established by physics-based and logical analysis. This method combines the FV model in which the flame volume is determined by the temperature threshold and the correlation of the flame volume with fuel/air ratio.
(2) The flame volumes obtained by the numerical simulations vary nearly linearly with the fuel/air ratios when the fuel/air ratios are close to the LBO limits. Thus,the correlation of the flame volume with flame volume can be simplified as a straight line near the LBO when the hybrid method based on the FV concept is utilized.
(3) For all the fifteen combustor configurations in the present study, the hybrid method based on the FV concept can achieve better prediction accuracy compared with other prediction methods. The prediction uncertainties between the experimental results and the predicted values by Lefebvre’s LBO model, FIA method, Hu’s hybrid method and the hybrid method based on the FV concept are within about ±45%, ±20%, ±16%and ±10%, respectively.
Declaration of Competing Interest
The authors declare that they have no known competing financial interests or personal relationships that could have appeared to influence the work reported in this paper.
Acknowledgements
This study was co-supported by National Science and Technology Major Project (No. 2017-III-0007-0032) and Key Laboratory Fund (No. 6142702180306).
 CHINESE JOURNAL OF AERONAUTICS2021年5期
- CHINESE JOURNAL OF AERONAUTICS的其它文章
- Ferrofluid moving thin films for active flow control
- Preliminary study on heat flux measurement data of TT-0 flight test
- An analysis and enhanced proposal of atmospheric boundary layer wind modelling techniques for automation of air traffic management
- Jet sweeping angle control by fluidic oscillators with master-slave designs
- Hot deformation behavior and microstructure evolution of the laser solid formed TC4 titanium alloy
- Electrochemical trepanning with an auxiliary electrode
