Aerodynamic performance of a low-Reynolds UAV with leading-edge protuberances inspired by humpback whale flippers
Yng ZHANG, Xu ZHANG, Yi LI, Min CHANG, Jikun XU
a State Key Laboratory for Strength and Vibration of Mechanical Structures, Xi’an Jiaotong University, Xi’an 710049, China
b School of Aeronautics, Northwestern Polytechnical University, Xi’an 710072, China
c Unmanned System Research Institute, Northwestern Polytechnical University, Xi’an 710072, China
KEYWORDS Flippers;Flow control;Humpback whale;RANS;Stall delay;UAV
Abstract The aerodynamic forces and flowfield on a delta-wing Unmanned Aerial Vehicle(UAV)with specific airfoil are studied here. The leading-edge protuberances inspired from the flippers of the humpback whale is introduced in present work to watch its effect on stall delaying and drag reduction. Two installing factors, which are amplitude and wavelength of the protuberances, are considered to study the interaction of leading-edge variation and de-tached vortex. Three changes in both amplitude and wavelength are investigated herein.Generally,the modified models have larger stall angle of attack than that of the baseline model; the difference exists in the attainable lift coefficient and drag reduction.
1. Introduction
Biomimetic system inspired people in many aspects, particularly those used for the Unmanned Aerial Vehicle (UAV).The natural evolution gives creatures many astonishing skills.One example is a humpback whale, Megaptera Novaeanglia,which is one of the most massive mammals living in the world,has special pectoral flippers with many tubercles at the leading edges. During cruising and preying, the humpback whales are exceptionally manoeuvrable, although their large size and cumbersome body, compared to the other species. Bushnell and Moore1firstly suggested the potential benefit of this structure on the aerodynamic performance of a wing. The special structures on their pectoral flippers,reported by Fish and Battle,2are regarded as the main reason of the agility during executing rolls,loops,and banked turns.The stall delay and drag reduction of the wing are the main two advantages by mimicking the protuberances on the flipper leading edge. Miklosovic et al.3assimilated this structure to the Vortex Generator(VG), which is regarded as the most efficient way in passive flow control. This notion, via the experiment, was supported by Hansen et al.4with a conclusion that the tubercles behaved in a similar way to counter-rotating vortex generators. The basic idea of passive flow control was inducing the highmomentum flow into the near-wall region to help the local boundary layer to resist the large adverse-pressure gradient,hence the counter-rotating vortex pair generated by the tubercles are mimicked by a waving leading edge of a wing and performance improvements have been shown in the fundings by Custodio et al.,5Stanway,6Weber et al.,7Dropkin et al.8and Wei et al.9However,Nierop et al.10held different opinion by expressing the tubercles changing the pressure distribution but not energizing the boundary layer to lead a gradual onset of stall,which was also investigated by Yoon et al.11Nevertheless, Zhu12presented that the irrationality of this conclusion was neglecting the wing-tip vortex and applying the potential theory of the inviscid and irrational flow to a rotational flow problem. Although studies by Polacsek et al.,13Clair et al.,14Narayanan15and Kim et al.16also suggested that the leading-edge protuberances decrease the noise induced by separation,the most applications focus on improving the aerodynamic performance of airfoil, such as NACA63(4)021,17-21NACA0021,22NACA001223and so on. Many researchers,via experiments and numerations, have given proofs that the protuberances which are inspired by flipper of humpback whales can enlarge the stall angle,enhance the lift performance and reduce the drag. Miklosovic et al.3reported a 40% delay of stall angle by using idealized models of humpback whale flippers at a half-million Reynolds number. With as much as 50% lift enhancement, Johari et al.17found the maximum lift was decreased. Watts and Fish24presented a perfect experiment that a 4.8%increase in lift and a 10.9%reduction in drag in comparison to wings without tubercles.
Most of earlier investigations were based on the analysis the force,momentum and flow physics on rectangle wings.For the delta wing, which is an essential configuration for UAV aerodynamic design,to the authors’knowledge,only a few of findings can be obtained. Goruney and Rockwell25firstly presented the delta-wing configuration with protuberances leading edge, and they demonstrated the bio-inspired leading edge in a delta wing can affect the flow topology significantly,and the noticeable change occurred when the small ratios of tubercle wavelength to amplitude were used. Chen et al.26,27conducted experiments on a delta wing with swept angle Λ=52o, and the results demonstrated that a small or moderate perturbation (less than 5% chord length) could delay the stall without losing maximum lift coefficient and the different flow pattern compared with the baseline model. However, the existed experiments were based on a flat plate with no profile,which is not similar to those investigations on rectangle wing.Moreover,the UAV,with the necessary equipment,commonly are designed to be a configuration as Lockheed MQ-25. The evaluation of the delta wing with specific airfoil and wavy leading edge should be a consequential investigation.
In the present paper,a computational study is performed to explore the forces and flow pattern on a delta wing with a NACA0012 profile in the streamwise. The configurations with and without leading-edge sinusoidal protuberances at Re=8×10⁴and angles of attack up to α=40o. The computation provides the comparison of surface flowfield, pressure distribution, and near-wall flow patterns which are difficult to measure in the experiment. The numerical scheme and the mesh sensitivity is discussed in Section 2.Results are presented and discussed in Section 3,and the findings are summarized in Section 4.
2. Numerical approaches
2.1. Governing equation
The Navier-Stokes equations are written in conservative form,and this form is suite for both moving or stationary control volume, viz.,
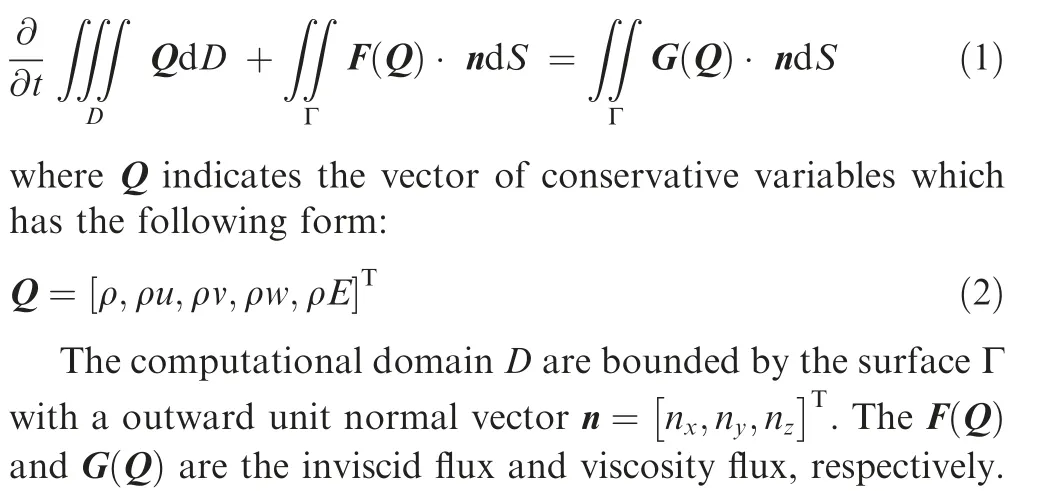
Simulations for the test cases are performed using an inhouse code. The software is a structured finite-volume code,and it solves Navier-Stokes equations for both laminar and turbulent incompressible/compressible flows with a thirdorder upwind-biased spatial differencing for the convective and pressure terms, and second-order central-differencing on the viscous terms.Multigrid and mesh sequencing are available for convergence acceleration with the Message Passing Interface (MPI) parallelization computation. In this work, all of the prediction results were obtained by Shear-Stress-Transport (SST) turbulence model, which is developed by Menter.28
2.2. Verification of flow solver
The purpose of this section is to provide validation for the current solver. The NACA0012, which is employed as the profile of the wing of UAV at current study, at a Ma=0.15 and Re=6×10⁶is used to make a comparison with the experimental data provided by Ladson.29Three meshes were generated to obtain a grid convergence and determinate the proper near-wall mesh points distribution. The detail of meshes used for the evaluation is expressed in Table 1.


Table 1 Mesh description for NACA0012.
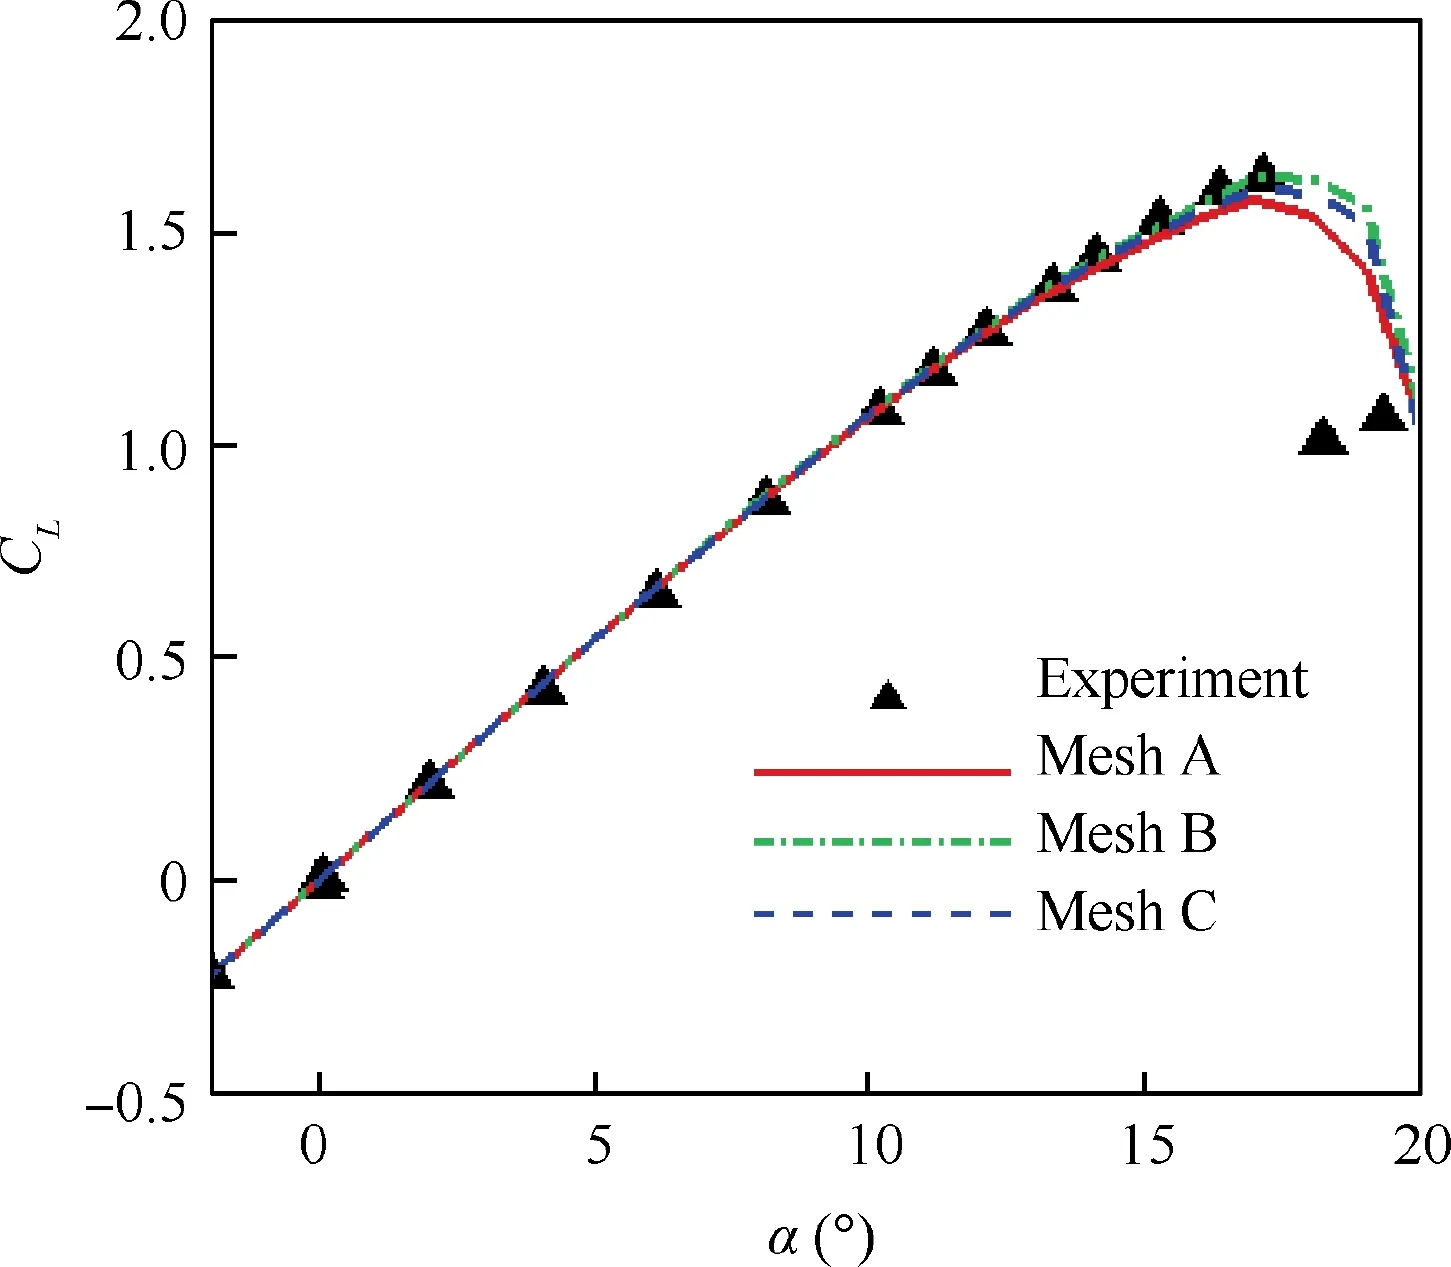
Fig. 1 Predictions of NACA0012 airfoil.

For the three-dimensional testacase,the geometry of a flatplate semiplane delta wing with a leading-edge sweep of 70°and a 25° bevel on the lower surface along the leading and trailing edges was chosen for the validation. The experimental database for the geometry exists extensively, such as the work given by Kegelman and Roos.30The numerical simulation is performed at a freestream Mach number, Ma=0.3 and a several angles of attack, α=0°-40°. The Reynolds number based on the root-chord length is one million. The selection for numerical scheme and turbulence model is in accordance with the 2D validated case. Three sets of mesh are used for the validation,and the details are given in Table 2.
Fig. 2 contains the lift coefficient prediction and flow path of the core of vortex tube.The predicted values shown in Fig.2(a) are in fair agreement with the experimental data except forα >28o. However, the predicted values have given enough evidence that the stall behavior of the delta wing has occurred and well predicted. The leading-edge vortex, demonstrated by the path line of its core with a value of angle of attack α=30o,has a very obvious impact on the surface pressure distribution,that is, the break down indicated by a high pressure region.The experimental database provides the shear layer defined by the locus of maximum swirl. The predicted values at x/c=0.3 has a perfect match with experimental data.
3. Results and discussion
3.1. Geometry description
The geometry of baseline model is shown in Fig. 3, the basic delta wing has a swept angle Λ=55o. The root chord lengthis c=0.22 m. The wing-let, which is designed to decrease the magnitude of wing-tip vortices, can also increase the aspect ratio.The outward deflecting angle is 60oand will not be changed during the following comparison. The effect of airfoil replacement also is not investigated in present work. Totally,18.3 million grid points are used herein, and the first grid distance is kept in a value of y+1≤0.45. The mesh is generated with ANSYS ICEM-CFD, and the topology is shown in Fig.4(a).The grid details at leading and trailing edges are plotted in Fig. 4(b) and (c).

Table 2 Mesh description for delta wing.
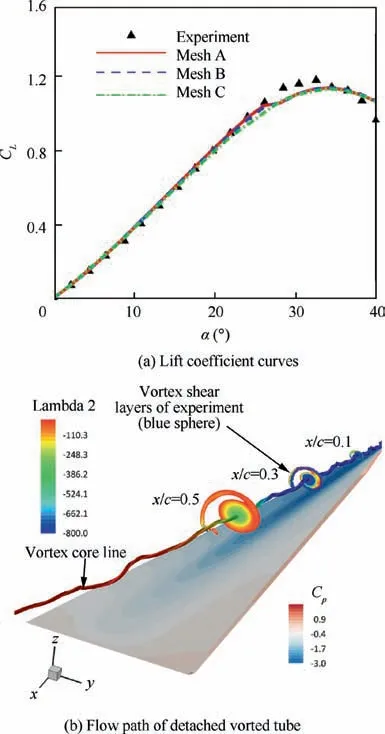
Fig. 2 Predictions of flow on delta wing.
The leading-edge protuberances are herein considered by a composition of a sinusoidal function and the coordinate value of leading points. The front line of the UAV is projected into xy plane, and hence it can be written as a function x=f(y).Accordingly, the composited function is written as follows:

where A and B control the amplitude and wavelength, respectively,b is the semi-span of the wing.The parameter of amplitude, A=0.004 m, 0.007 m and 0.01 m, corresponding to 1.8%c,3.2%c and4.5%c,are selected.This selection refers from the conclusion presented by Chen et al.,26that is, the large amplitude (larger than5%c) would decrease the maximum lift dramatically. Simultaneously, the numbers of wavelength are chosen as 2, 4 and 6, respectively. All appraised models used herein are listed in Table 3.
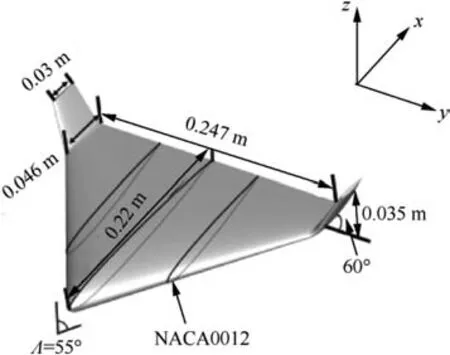
Fig. 3 Sketch of delta-wing baseline model.
3.2. Effects of amplitude
The effect of amplitude variation is investigated here. The lift coefficient for the baseline and modified models are presented at Fig. 5. The baseline model has a very linear increase from α=-4oto 15o.The computed lift coefficient levels out at α larger than 25o.Subsequently,a soft stall is indicated by the gentle decrease of lift coefficient CL.The maximum CLof 0.944 is reached at α=28o.The lift coefficients of modified wings presented in Fig.5(a)are quite similar with each other at the α up to 10o. After the initial linear increase of CL, the model with the largest amplitude reaches the stall angle firstly. However,the lift coefficient still increases after stall, although with a small slope. The models with small and moderate amplitude have a larger maximum of CL, but the lift decreases gradually after the stall angle. This trend is consistent with the data shown in work by Chen et al.26The increments of lift from different models are presented in Fig. 5(a), the lift coefficients from modified models is up to 29% greater than that of baseline model at α=0o. Although with the least lift increase by the T4A4, the robust enhancement of lift could be observed in Fig. 5(b). As much as 8% augmentation of CLis roughly maintained over the 15o≤α ≤30o. As the amplitude increases, the increment of CLat large AoA decreases. Notably, the increment of CLis negative for T4A10 which has the largest amplitude when α is larger than 2o, and a -8% to 0% range of lift increase is presented in the large α range.
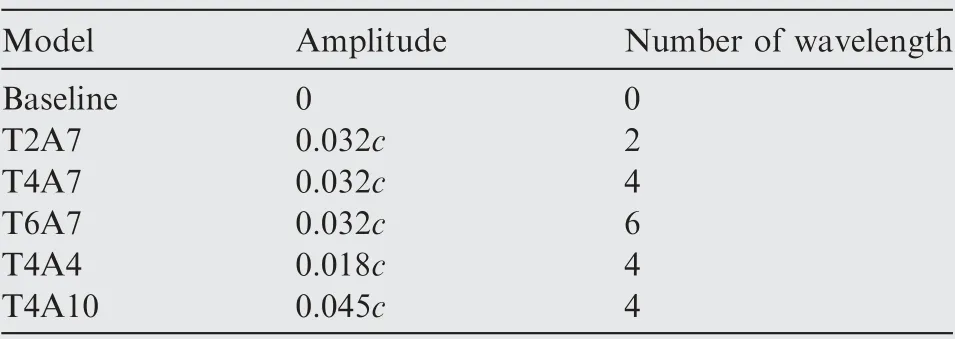
Table 3 Way of naming appraised models.
The predicted drag coefficients CDare plotted into Fig. 6(a). As illustrated by most studies,8,26the modified geometry will bring extra drag.The drag in region that lift increasing linearly (i.e.,-4o≤α ≤15o), only the configuration with the largest amplitude has a 2.5%to 5%drag increment.The smaller amplitude, especially for the T4A10, the drag increase is not larger than 2%of the baseline model.Increasing the amplitude of tubercles can lead to a drag reduction effect if the α is large enough.
The reason for specific α (i.e., 30oand 40o) shown here is that this is the point that the largest diversity of the lift performance starts.A set of surface tufts images presented in Figs.7 and 8 corresponds to the changes of surface pressure and streamtraces of varying amplitude. The surface is dyed with the pressure coefficient.The low-pressure region indicates that flow is attached. The streamtrace near this region is a helical curve, which denotes a stable detached vortex is here. The littery pathlines behind the low-pressure region imply a vortex breakdown. The separation induced by the vortex breakdown spreads from the tail to the leading point of the UAV with the baseline configuration. Increasing the amplitude of leadingedge tubercles, the sulci of the modified leading edge changes the local flow field.
3.3. Effects of wavelength

Fig. 4 Sketch of delta-wing baseline model.
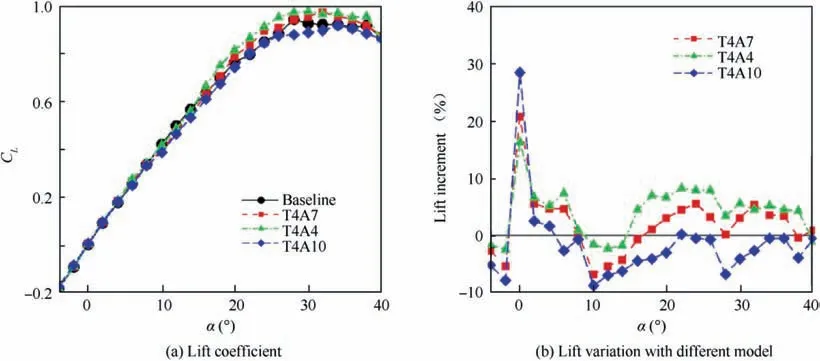
Fig. 5 Lift characteristics of model with varying amplitude of leading edge tubercles.
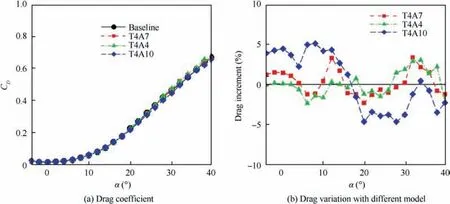
Fig. 6 Drag characteristics of model with varying amplitude of leading edge tubercles.

Fig. 7 Surface pressure and streamtraces in the near-wall region at α=30° for the models with different amplitudes.
Funding by increasing the wavelength of the leading-edge tubercles is presented here. The lift coefficient by two-period perturbation shows obvious enhancement in Fig. 9(a), and a 4.5% increase of maximum CLis obtained. However, the stall angle decreases by 2o. Doubling the wavelength of T2A7, the stall α is 32o. The lift coefficient dramatically decreases if the wavelength added successively,but the lift decreases gradually and is nearly constant after the stall α.The increment of CLby different wavelength has a similar performance with increasing the amplitude in the region with a constant lift-curve slope as described in the above section. The maximum increment by using the smallest wavelength is 10.5% greater than the baseline value. Moreover, although the lift-enhancing effect drops away if that the α is larger than 30o, the effect of leading-edge tubercles still is positive. The moderate wavelength (T4A7)provides a balanced performance at the region with large α.Roughly 5% lift increase can be gained in both shallow and deep stall region. Expressed by the plot in Fig. 9(b), excessive wavelength behaves negatively on the lift coefficient.This is in accordance with the funding by Chen et al.26
The plots in Fig.10 do not provide a clear difference in the drag coefficient by varying the wavelength. Hence, the increment of drag is presented in Fig. 10(b), as much as 7.8% drag increment can be obtained with the maximum number of wavelength along the leading edge. However, this gives a positive effect on drag reduction beyond the α=20o. The models with a fewer number of wavelength have less drag increment at the smaller α, even slight reduction at a 5°≤α ≤10°range.However,about 3%drag increment appears near the α=32o.

Fig. 8 Surface pressure and streamtraces in near-wall region at α=40° for the models with different amplitudes.
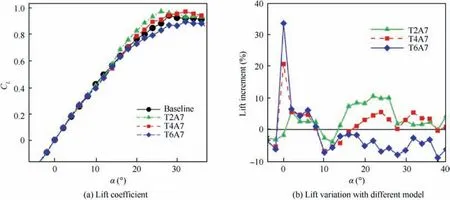
Fig. 9 Lift characteristics of model with varying wavelength of leading edge tubercles.
Increasing the number of wavelength,the separation of the baseline model moves towards the tail of the UAV along the leading-edge tubercles. T2A7, which has the fewest number of wavy tubercles,eliminates the separated flow on the second half of the wing, and this positive effect is kept as the number of tubercles increasing. The backflow region at large α (i.e.α=30oand 40o) gradually achieves the same area as that of baseline model.
The surface pressure and near-wall pathlines are presented in Figs.11 and 12.The spacious streamtraces shows that the vortex breakdown with more tubercles is earlier than that with few ones.Implying by the increase of surface pressure,the strength of leading vortex decreases as the number of tubercles doubles.The configuration with the fewest perturbation presents the largest and strongest low-pressure region and suction peak,which are helpful for maintaining the detached vortex.
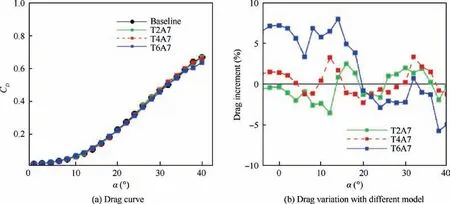
Fig. 10 Drag characteristics of model with varying wavelength of leading edge tubercles.
3.4. Discussion
Both the variation of amplitude and wavelength do not give a distinguished improvement at the linear zone of lift. The results are similar with those from most of the researches on wing with leading-edge protuberances, for example, Custodio et al.21designed a wing with such structure after careful parameter investigation, and even with nearly 50% drop in maximum lift-to-drag ratio, which has been also presented in the work done by Ganesh et al.31Hansen et al.4also gave a conclusion that the drag reduction cannot be observed for all investigated models. Hence, the wings which mimic the humpback-whale flipper cannot be regarded as a way to improve the slope of lift curve or maximum lift. The common benefit that adopting this structure is to delay the stall and ameliorate the post-stall performance, and reduce the noise,such as presented by Tong et al.32The Fig.13,which contains the lift-to-drag rations from different varying parameters,indicates that the wavy leading-edge can improve the lift performance at the stall and post-stall regions.The largest increment of K is about 9.5% from the comparison.

Fig. 11 Surface pressure and streamtraces in near-wall region at α=30° for models with different periods.

Fig. 12 Surface pressure and streamtraces in the near-wall region at α=40° for models different periods.
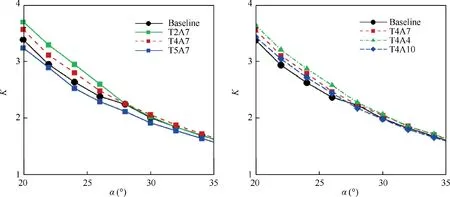
Fig. 13 Demonstration of lift-to-drag ratio of four models.
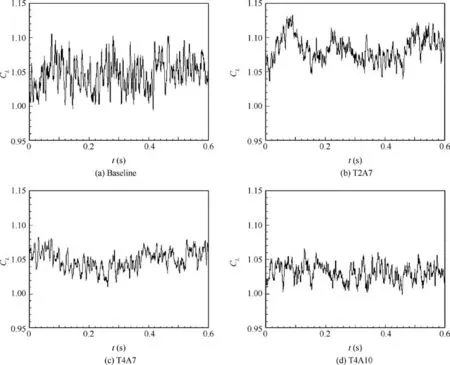
Fig. 14 Time history of lift for different models.
The flow on the wing near the stall or post-stall regions always cannot be predicted precisely, some high-order approaches, such as Detached Eddy Simulation (DES) developed by Spalart.33In present work, the baseline, T2A7,T4A7 and T4A10 are selected to demonstrated the transient and averaged flow features. An initial unsteady-RANS simulation was prepared before the DES simulation. The global time step Δt=1.5×10⁻⁴s is chosen to give a reasonable development of flow structures, and the simulation is advanced for t=0.6 s after the flow is fully-developed.The time history of lift coefficients from different models are plotted in Fig. 14. The averaged values are 1.048 for baseline, 1.081 for T2A7, 1.054 for T4A7 and 1.030 for T4A10, respectively. This result agrees with that from RANS simulation.
However, the spectrums are very different with each other.Fig. 15 shows the Power Spectra Density (PSD) amplitude of the lift coefficient as a function of frequency. The dominant amplitude of baseline model can be found at f=12 Hz, and increasing number of wavelength just enhances the dominant amplitude slightly. The intension of the dominant vortex decreases if the wavy leading edge is adopted. The obvious change is found out if the amplitude of the leading-edge protuberances increases a lot,and the dominant amplitude increases twice, roughly.
The instantaneous flow structures are presented with λ2criterion in Fig. 16, and the vortex structures are dyed with the value of streamwise Mach number. Two vortex tubes breakdown can be observed in Fig. 16(a) on the upper surface of baseline model. Few number of wavelength and small amplitude (i.e., T2A7) present more than two vortex tubes which departure from every peak of the leading-edge protuberances.Although vortex breakdown occurs early if increasing either number of period or amplitude, every tubercle can sustain a small vortex tube, which is very helpful to prevent stall and the sharp lift drop.
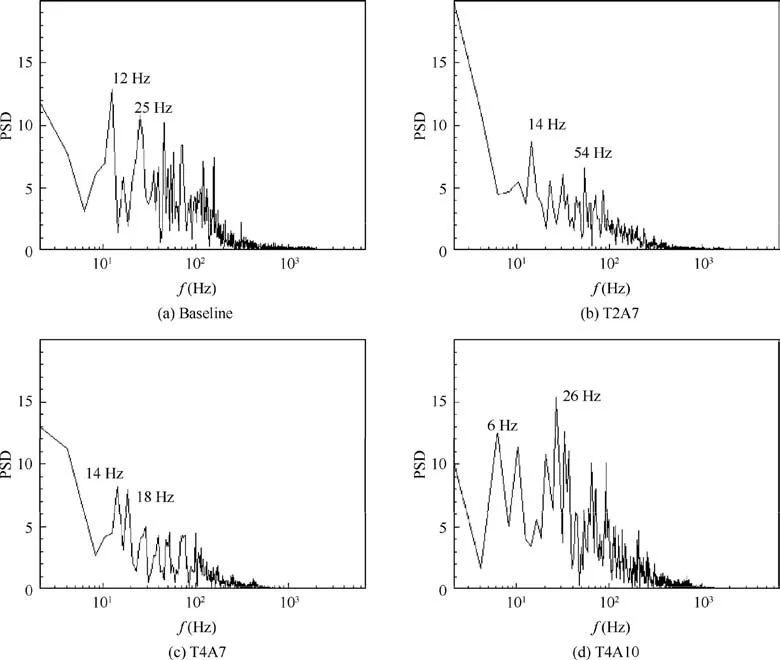
Fig. 15 Spectrum of lift time sequence of different models.

Fig. 16 Instantaneous flow using lamba2 criterion.
4. Conclusions
The flowfield on delta-wing with NACA0012 airfoils with and without leading-edge sinusoidal protuberances was computed in present work,and the lift,drag,and surface-pressure coefficients were examined in detail. The effect of amplitude and number of tubercles were investigated with numerical methods. The following conclusions are drawn from the computations:
(1) The leading-edge perturbation should in a reasonable range.Whatever the large amplitude or too many tubercles could decrease the maximum lift coefficient. The positive effect of using this bio-inspired geometry is enlarging the stalling angle.
(2) The smallest amplitude of protuberances could provide a large lift-to-drag ratio at small AoA ranges,for example,a maximum of 9.6% increment of lift-to-drag ratio,compared with the 5.2% increment gained with T2A7,can be obtained by T4A4.However,moderate variation in either amplitude or number of tubercles can have a balance performance between delaying stall and enhancing lift coefficient.
(3) The detached vortex, which is always regarded as the main advantage of delta wing on stall delay,is separated by the leading-edge sinusoidal protuberances, that is, a single vortex tube is divided into many parts along the leading edge.This is very helpful to resist the separation of the boundary layer far from the place single vortex tube which exists on the baseline model.
Declaration of Competing Interest
The authors declare that they have no known competing financial interests or personal relationships that could have appeared to influence the work reported in this paper.
Acknowledgements
The authors acknowledge the support from China Postdoctoral Science Foundation (No. 2017M623184). The computation support comes from Beijing Super Cloud Computing Center is also acknowledged.
 CHINESE JOURNAL OF AERONAUTICS2021年5期
- CHINESE JOURNAL OF AERONAUTICS的其它文章
- Ferrofluid moving thin films for active flow control
- Preliminary study on heat flux measurement data of TT-0 flight test
- An analysis and enhanced proposal of atmospheric boundary layer wind modelling techniques for automation of air traffic management
- Jet sweeping angle control by fluidic oscillators with master-slave designs
- Hot deformation behavior and microstructure evolution of the laser solid formed TC4 titanium alloy
- Electrochemical trepanning with an auxiliary electrode
