Diamond wheel grinding characteristics of 3D orthogonal quartz fiber reinforced silica ceramic matrix composite
Bin LIN, Hoji WANG, Jinhu WEI, Tinyi SUI,*
a Key Laboratory of Advanced Ceramics and Machining Technology, Ministry of Education, Tianjin University, Tianjin 300072, China
b Aerospace Research Institute of Materials & Processing Technology, Beijing 100076, China
KEYWORDS 3D orthogonal SiO2f/SiO2;Grinding;Surface roughness;AE frequency;Removal mechanism
Abstract Fiber-reinforced silica ceramic matrix composites (SiO2f/SiO2) have gained extensive attention in recent years for its applications in aeronautics field such as radar radome and window.However, the machining properties and mechanism of the material remain unclear. The features and mechanical properties of the material itself have a significant influence on both its machining characteristics and surface integrity.Thus,a full-factor grinding experiment is conducted using a 3D orthogonal SiO2f/SiO2 aiming to obtain its machining characteristics. The effects of grinding parameters and tools on the grinding force,surface roughness,and material damage type are investigated using a dynamometer, Scanning Electron Microscope (SEM), and Acoustic Emission (AE)analysis. The AE frequency band is analyzed, and a semi-analytical force model is established to study the difference between a single grain and wheel grinding. It was found that the changes in surface roughness correlate with the changes in grinding force, with fiber fracture being the main reason behind the increase in grinding force. Finally, the material removal mechanism was studied based on the AE analysis.It was found that the removal mechanism is fiber fracture dominated with matrix crack and debonding,and the primary sources of energy consumption are fiber fracture and friction.
1. Introduction
Quartz-fiber reinforced silica ceramic matrix composite(SiO2f/SiO2) is a promising material for high-tech engineering applications, especially in aeronautics filed, due to its superior mechanical property, dielectric property and heat shielding performance under harsh and severe working conditions.1-3However, its application is limited by high machining costs and difficult-to-machine properties,which are primarily caused by the ceramic matrix brittleness and material complexity.The material anisotropy and inhomogeneity during the machining process, along with the unpredictable machining damage(i.e., matrix crack, fiber fracture, debonding, and delamination), lead to an uncontrollable machined surface.4-6Therefore, it is essential to systematically study the SiO2f/SiO2processing characteristics aiming to support the practical machining and broad the application of fiber-reinforced silica ceramic matrix composite.
Various fiber-reinforced composite machining methods were studied, such as drilling,7milling,8and grinding.9As the most commonly used ceramic matrix composite machining technology, grinding has recently attracted the attention of researchers.10-12The machining parameters, such as the lubrication method,13wheel type,14grain type,15,16and cutting parameters,17-19were found to have a significant influence on both the machining quality and efficiency when it comes to ceramic matrix composites.The cutting force has a vital role in the machining process20,21and influenced the finished surface roughness significantly.22For commonly used materials like metals and ceramics, theoretical research usually focused on the specific grinding energy23and undeformed chip thickness,24,25aiming to explain the changes in cutting force26and surface topography.27However, for material like SiO2f/SiO2,the material removal mechanism is significantly more complex,and the machining characteristics are hard to explain using the traditional theory. In order to study the material removal mechanism of the ceramic matrix composite, a single grain scratch test and Scanning Electron Microscope(SEM)characterization are used; the aim was to study the change in the material before and after the grinding process.8,28However,the single grain scratch test is too idealized to reflect the actual grinding conditions, making it very difficult for researchers to study the grinding process material removal in real-time. The main reason for this is the machining area, which is hard to observe during the process. The Acoustic Emission (AE) provides an excellent insight into what is happening inside the machining area during the process;breaking the material(such as fiber fracture and ceramic matrix crack) emits different acoustic signals.29,30This allows us to analyze the material removal type and damage modes by analyzing the AE signal collected during the grinding process.31,32The relationship between grinding energy and removal regime of machining process could also be investigated by AE analysis.33Analysis methods such as Wavelet transform are used for analyze the AE signal collected from grinding process.34,35Based on the previous research by the authors,29,36the AE signals are analyzed and used to build the force model for a single grain SiO2f/SiO2scratching. However, the AE signal and the relationship between the AE signal and SiO2f/SiO2grinding force when using grind wheel remain unclear.
Therefore, a full factorial grinding experiment was carried out.The effects of grinding parameters and tools on the grinding force, surface roughness, and AE frequency are investigated for the SiO2f/SiO2grinding process. The damage types corresponding to each AE peak frequency band were analyzed and finally, the material removal mechanism is illustrated.
2. Materials and methods
The workpiece material is 3D orthogonal SiO2f/SiO2, with the workpiece macro structure shown in Fig. 1. The front surface is the grinding surface,while the grinding direction is along the 40 mm side. The width of the front surface is 27 mm to guarantee that each of the specimens can be used in three experimental runs while avoiding the overlap of the processing paths.The specimen thickness is 25 mm to prevent the interference between the machining surface and the workpiece fixture.All the workpiece surfaces are ground to planes in advance,guaranteeing that, independently of the grinding depth,machining does not cross the 1 mm thickness fiber layer(highlighted in Fig. 1). During actual SiO2f/SiO2machining, a grinding wheel of 240#and 100#are used for rough and fine machining, respectively.
In the present research, the tool is specially designed as an electroplated diamond with grain numbers of 100#and 240#.The wheel diameter is 16 mm to match the machining center(JDUT400E CNC Machine), which was used to carry out all the grinding experiments. According to Fig. 1, there are two fiber orientations on the processing surface.Since the grinding forces of fibers in different directions vary,36the wheel width of 7 mm was selected to ensure that the grinding zone includes two areas containing two different fiber orientations. This is to ensure that the cut position on the workpiece does not influence the grinding force.
The grinding type used in this study is up-grinding without coolant. The dynamometer is Kistler 9257A, and the data acquisition system is Kistler 5070A which were used with the dynamometer sampling frequency of 20 kHz. The AE monitoring system included an AE sensor FUJI 1045S and an AE data acquisition system TDEC VIB 1000 with a sampling frequency of 1 MHz. The AE sensor was placed as close as possible to the grinding zone and was connected with the acoustic couplant.The dynamometer and AE system characteristics are outlined in the previous study by the authors.29,36The examples of AE signal and grinding force in time domain are presented in Fig. 1.
Five levels of grinding speed and depth are selected based on the previous machining experience, aiming to investigate the influence of grinding parameters on the grinding force,AE signal, and surface quality of SiO2f/SiO2grinding. Also,diamond wheel grinding was compared to its single grain counterpart. The grinding speed and depth values which are shown in Table 1 can cover the majority of practical engineering demand when it comes to SiO2f/SiO2machining. According to the previous research by the authors,36the workpiece feed rate has a lower influence on processing force than the grinding speed and depth. Thus, in the present study, the workpiece feed rate is set to 500 mm/min. A full factorial experiment is adopted, and each experimental run (for each of the conditions) is replicated three times. After the experiment, ground surfaces were observed using Phenom SEM to reveal the grinding damage. The surface roughness Sa is obtained via a non-contact 3D optical measurement instrument NANOVEA ST400 by scanning area of 5 mm×5 mm and 6 μm sampling step.
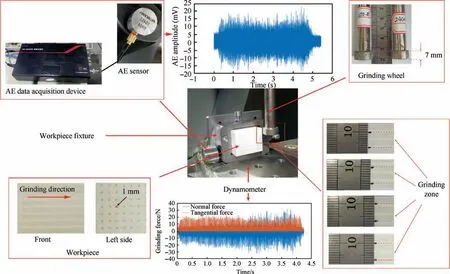
Fig. 1 Grinding experiment setup.

Table 1 Grinding parameters used in experiment.
3. Grinding test result and discussion
The change of grinding force in relation to speed and cutting depth is shown in Fig. 2, a contour map is used to indicate the combined effects.It can be seen that the changes of tangential and normal forces are similar for the 100#grinding wheel.There is a peak found on maps,and the contour is completely closed, meaning that there is a grinding force turning point.However, the maximum values measured for tangential and normal forces differ.The largest tangential force was measured for a combination of the grinding speed 1.9-2.9 m/s, and grinding depth 0.145-0.168 mm.On the other hand,the largest normal force was found for grinding speed 2.7-3.0 m/s, combined with the grinding depth 0.117-0.139 mm.
Such findings deviate from the expectations, which were that the grinding force would increase as the grinding speed decreases and grinding depth increases.37This phenomenon could be attributed to the change of SiO2fiber cutting types and tribological behavior between the abrasive grains and SiO2f/SiO2following a grinding energy threshold. With the increase in grinding depth and decrease in grinding speed,the wear debris is crushed into small pieces.This ensures better lubricating conditions, changing the SiO2fiber cutting type from pulling to shearing, causing a decrease in grinding force.The contour maps of grinding force using a 240 # grinding wheel are completely different compared to that of 100 #grinding wheel. Both tangential and normal forces are high when the grinding speed ranges from 2.0 m/s to 2.4 m/s, and grinding depth is 0.165-0.180 mm. Furthermore, when grinding speed ranges from 1.4 m/s to 1.9 m/s, and grinding depth is above 0.100 mm, the grinding wheel encounters a severe blockage. The workpiece surface is filled with wear debris,meaning that the experiment must be stopped.
The nominal material removal rate per unit time Zwis shown as38

where apis nominal grinding depth; b is the grinding wheel width. The removal rate increased with the grinding depth.Moreover,when the grinding speed and the grain size decrease,the larger volumes of wear debris cannot be instantly removed from the grinding zone. This causes the wheel pits to be filled,rapidly dulling the grinding wheel. With the interaction between wheel and workpiece,workpiece material is plastically deformed by the blunt wheel, and the redundant debris is pressed into the workpiece surface. The contact area between the grinding wheel and SiO2f/SiO2increases dramatically;therefore,the grinding force is risen initially,followed by a severe blockage.
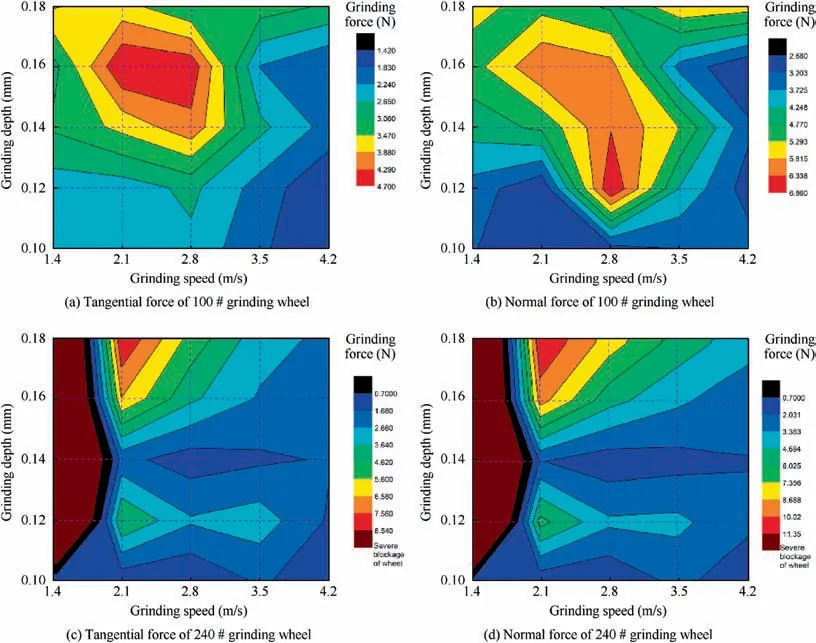
Fig. 2 Grinding force contour maps with change of grinding speed and depth.
A single factor experiment of single grain grinding is adopted. The grinding speed changes from 1.4 m/s to 4.2 m/s, while the grinding depth is set to 0.10 mm. When the grinding depth is changed from 0.10 mm to 0.18 mm, the grinding speed is set to 2.8 m/s. The grinding force for both the single grain and grinding wheel grinding using the same parameters(shown in Fig.3).It shows that both the tangential and normal forces in single grain grinding decrease with the grinding speed and increase with the grinding depth,as discussed in the previous study by the authors.36However, the diamond wheel grinding performance is notably different.The diamond wheel grinding force fluctuates with the increases in grinding speed and grinding depth, particularly for 240 # grinding wheel.When testing the grinding force using grinding wheel, the grains on grinding wheel is much more complicated than single grain test.For example,the heights and conditions of the gains on grinding wheel are different from each other.Thus,the contacting condition between grinding wheel and material surface is much more complicated than single grain grinding. Due to the complexity of the grinding wheel diamond grains, the material removal type of grinding wheel will be significantly more complicated than single grain scratching, that is the reason why the grinding performance of single grain grinding and grinding wheel grinding are obviously different.
In order to analyze the SiO2f/SiO2grinding behavior when using a grinding wheel, the corresponding grinding force was obtained numerically. As shown in Ref. 36, the semianalytical tangential force for a single grain is calculated as

where Rsis the grinding wheel radius;ξ is a constant related to Rs; α, β and γ are the fitting coefficients of ap, vsand vwwith actual processing, which related with grinding direction and fiber orientation; θ is half of the single grain tip angle.
Therefore, once the grinding wheel and the workpiece are selected,the width b,the radius Rs,the grains exposure height distribution, and the grains protrusion angle are invariable.For this reason,the working conditions and the grinding wheel state are practically constant, given that the wheel wear is ignored. Thus, the expected ξ and tan θ are constant, and the average tangential force for a grinding wheel is
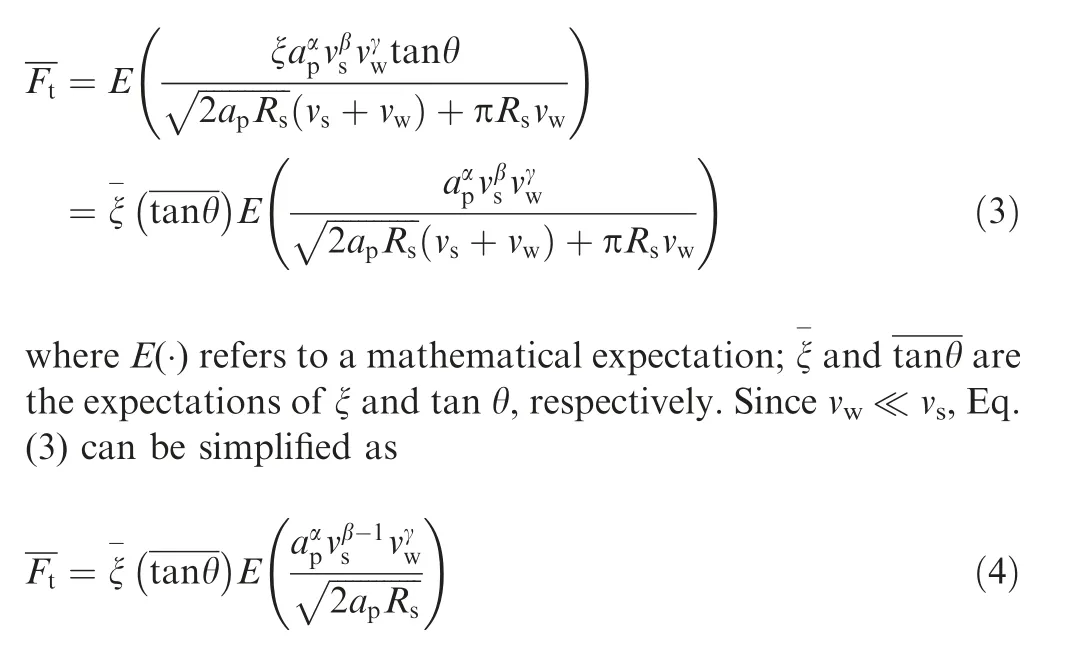
where ap≪Rsfor each grain, meaning that the minuscule changes of the true Rsand vsare eliminated.When the nominal vsand vwvalues are constant during processing and apis variable,the Eq.(4)can be simplified.In simplification,ξ′is a constant describing the grinding wheel condition and the machining process and processing parameters vsand vw, while α′are the fitting coefficient of ap.
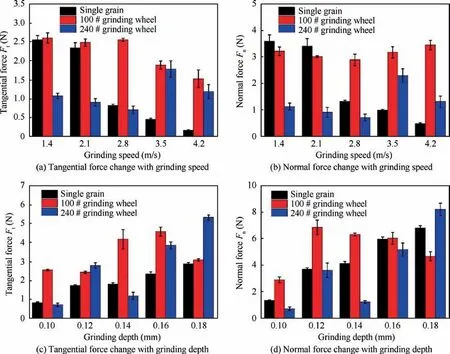
Fig. 3 Comparison between single grain and diamond wheel grinding.
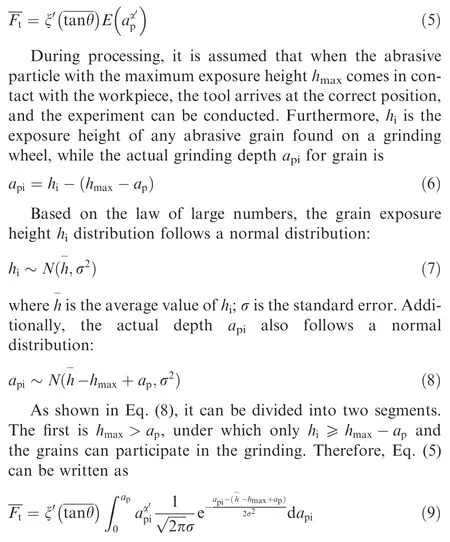
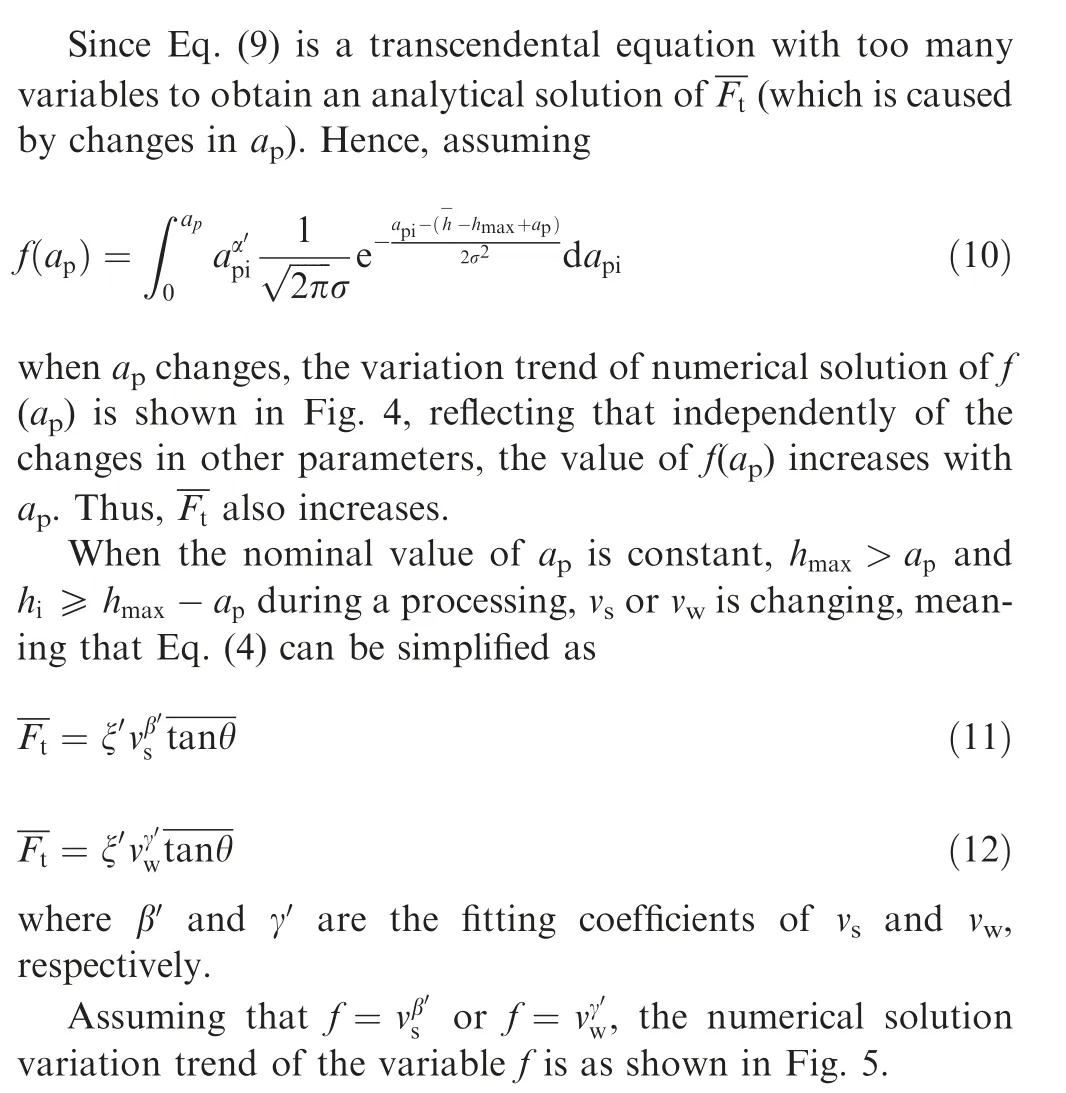
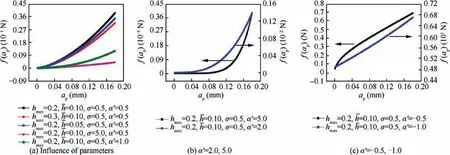
Fig. 4 Trends of numerical solution of tangential force depending on grinding depth.

Fig. 5 Trends of numerical solution of tangential force with wheel speed or feed rate.
On the other hand, when hmax<ap, all the grains and the wheel matrix take part in the grinding process. Thus, the tangential force will have two components: the 1st caused by the interaction between the grain and workpiece, and the 2nd caused by the interaction between the wheel matrix and workpiece. The resulting situations for the tangential and normal forces are more complicated than those of single grain grinding, as shown in Eq. (1). Therefore, the main reason behind the irregularities in grinding force results is the height difference between the grain exposure heights and the nominal grinding depth. Eventually, the statistical grinding depth, the quantity of grains on the diamond wheel taking part in the processing, and the interaction mode between a wheel and a workpiece result in the variations in grinding force.
Fig.6 is the relation between the surface roughness Sa and grinding parameters. It was found that the surface roughness following the grinding using 240 # grinding wheel is notably smaller compared to 100 # grinding wheel. The grain size of 100 # grinding wheel (124-178 μm) is much larger than that of 240 # grinding wheel (53-74 μm). Larger grains are known to cause wider and deeper scratches on the workpiece, leading to a rougher grinding surface. Meanwhile, some extremely coarse grains on both wheels randomly produce even more severe scratches, thus increasing the surface roughness. It was also found that the surface roughness obtained using 100#grinding wheel firstly increased,followed by the decrease as the grinding speed increased. At the same time, the surface roughness in the 240 # grinding wheel first decreased then increased with an increase in grinding speed.The trend of surface roughness changes was the same as that of grinding force,indicating that a smoother surface is obtained when using smaller grinding force. It should be noted that for 240 #grinding wheel under grinding speed of 1.4 m/s, only the test with 0.1 mm grinding depth could be performed. The remaining four tests have failed due to the severe grinding wheel blockage. Thus, no surface roughness data were shown in Fig. 6(b).
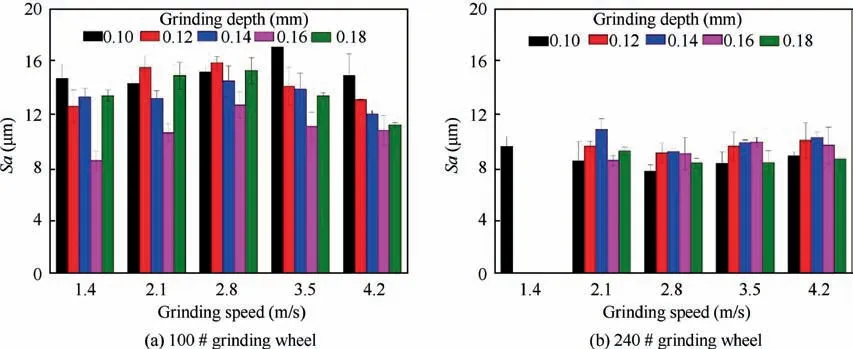
Fig. 6 Surface roughness Sa depending on grinding speed and depth.
According to the woven structure of 3D orthogonal SiO2f/SiO2, the grinding surface has different fiber bundle orientations.Fig.7 shows the different types of damage on the grinding surfaces. The machining scratches of the 100 # grinding wheel are more visible and deeper than those of 240#grinding wheel. As shown in Figs. 7(a) and 7(e), transverse fiber is surrounded by a large block of matrix. Furthermore, when the grinding direction is perpendicular to the fiber orientation,matrix cracks and debonds between the fiber and matrix are found for both grinding wheels; however, fibers are fractured and removed for the 100 # grinding wheel.
When the 240 # grinding wheel is used, it is obvious that partial fibers are retained after the grinding. Figs. 7(c) and 7(g)show transverse fibers surrounded by the fiber end surfaces,with relatively low grinding speed and large grinding depth.Only partial fibers are removed, while the fibers are severely deformed for 100 # grinding wheel. For a 240 # grinding wheel,fiber end surfaces are removed and deformed;however,when the speed is relatively large,and the depth is small,fibers at the end surface are crushed by grains (Figs. 7(b) and 7(f)).Moreover,when the grinding direction is parallel to transverse fiber orientation(Figs.7(d)and 7(h)),the situation is the same as the one shown in Fig.7(c)for 100#grinding wheel.Finally,there is no fiber deformation when the 240#grinding wheel is used. The integrated roughness of all the fiber bundle surfaces eventually determines the workpiece surface quality.
In order to further investigate the material removal type and associated mechanism, AE signals recorded during the grinding process are analyzed.The typical grinding parameters resulting in the largest grinding force are selected to illustrate the changes in AE signal and material removal mechanism.For the 100 # grinding wheel, the grinding depth was set to 0.16 mm when the grinding speed was variable,while its value was 2.8 m/s when the grinding depth was variable.For a 240#grinding wheel, the grinding depth was set to 0.18 mm when grinding speed was variable; the grinding speed was 2.1 m/s when the grinding depth was variable. It was observed from Fig. 2 that the grinding force with such grinding parameters changes dramatically, indicating that the material removal mechanism changes. Therefore, AE signals for these parameters are selected, and their frequencies were obtained through Fast Fourier Transform(FFT).Since the amplitudes are close to 0 for the frequencies above 35 kHz,the signals with frequencies between 0 and 35 kHz are selected and shown in Fig.8.It can be seen regardless of the machining parameters, there are always four frequency bands, i.e., 0-6, 6-18, 18-22, 25-32 kHz.
To systematically investigate the changes in AE signal depending on the grinding parameters and to verify whether the frequency band during a diamond wheel grinding exists regardless of their changes, AE signals were transformed into frequency domain through FFT for all the parameters. The FFT atlas is shown in Fig.9;to eliminate the amplitude range differences between the groups, the amplitude is normalized into a [0, 1] interval for each AE signal. It was shown that the four frequency bands exist under all the machining conditions, no matter the grinding speed, depth, and wheel grain size. Additionally, the frequency band between 6-18 kHz contains two separate discernible bands of 6-10 kHz and 10-18 kHz.Such a situation is similar to the single grain grinding;however, the frequency values are slightly different. For the single grain grinding, the band of 6.4-9.8 kHz corresponded to fiber fracture, 14.8-17.9 kHz corresponded to debond between the fiber and matrix, 23.6-26.4 kHz represented friction among tool, workpiece, and wear debris, and finally, the fourth band (34.0-35.5 kHz) corresponded to the matrix crack.29
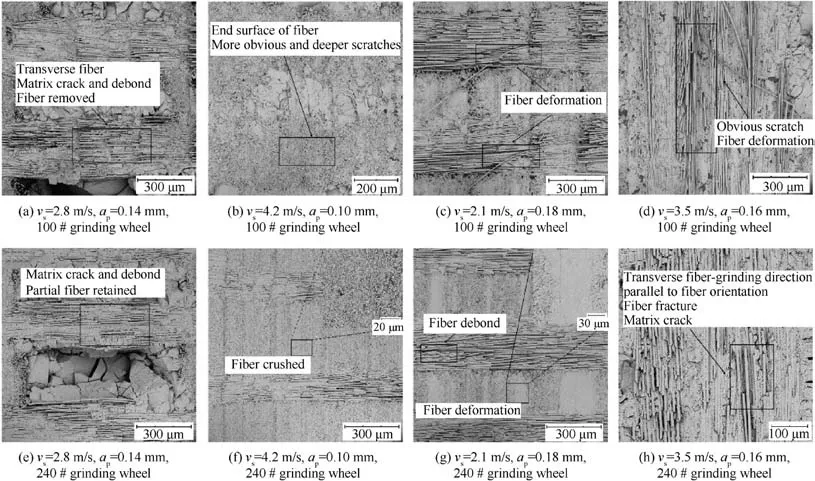
Fig. 7 SEM images of different fiber bundle orientations.
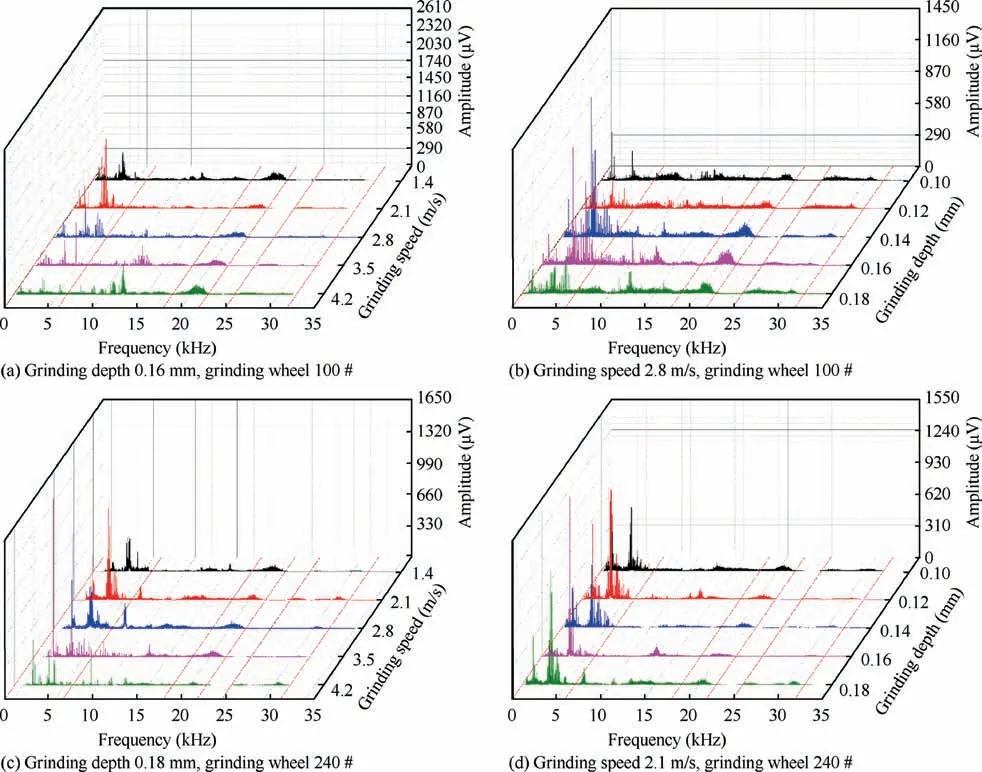
Fig. 8 AE frequencies at typical experimental parameters.
According to our previous study,29the frequency band is only relative to the stiffness and mass of the vibration source.The AE sources are the same for both the single grain grinding and diamond wheel grinding (given that the same material is ground). However, the frequency bands are smaller for diamond wheel grinding, which can be attributed to the changes of the system stiffness and vibration mode when changing the grinding tools from single grain to grinding wheel.Furthermore, the fiber debonding contains two types of separation form between the fiber and matrix: the single fiber or several fibers separated from the matrix, and a fiber cluster or several fiber clusters debond from the matrix. A grinding wheel is more complex compared to a single grain, mostly due to the randomness in geometry and cutting edge distribution;24therefore, the probability of a fiber cluster debonding caused by a diamond wheel is larger. For this reason, the frequency referring to debonding is wider for a wheel grinding,containing two bands. Based on Eq. (13),29it can be concluded that the frequency band of 6-10 kHz refers to a cluster or several clusters of debond fibers, while 10-18 kHz band represents a fiber or several debond fibers. The relation between damage types and frequency bands is presented in Table 2.It should be noted that the frequency band obtained by grinding wheel grinding shifted when compared with the frequency band of single grain grinding. It could be attributed to the change of the system vibration characteristics when materials cut by different cutting tools.

where fAEis the frequency of the AE signal; k is the stiffness factor of the connection between a damage area and its surrounding areas; m is the mass of a damage area.
For 100 # grinding wheel, it is seen in Figs. 9(a) and 9(b)that the signal bands between 6-18 kHz and 18-22 kHz become higher and denser as the grinding speed increases and grinding depth decreases. Based on the previous, it can be concluded that more fiber debonding occurred, implying an increase in friction increased at those conditions. With higher grinding speed and depth, the load and sliding speed between the grains and material surface increase dramatically,leading to an increase in friction,enhancing the signal between 18-22 kHz.
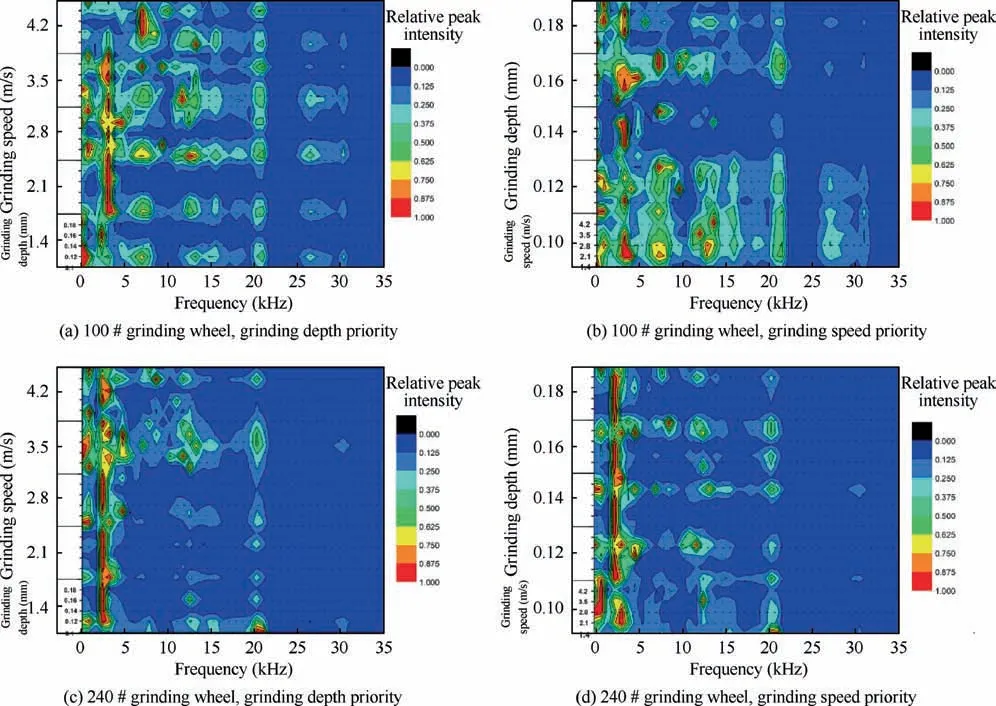
Fig. 9 Relationship of AE frequency and changes in grinding speed and depth.

Table 2 Relation between damage types and frequency bands.
The clear signal appeared at the grinding depth of 0.10 mm,possibly due to the serious matrix crack of the material below the large grinding depth.The relationship between the AE signal and grinding force is analyzed by comparing the changes in AE frequency shown in Fig.9 and the grinding force shown in Fig.2.Based on Figs.2(a),9(a)and 9(b)it was concluded that for 100 # grinding wheel, the grinding speed and depth with large tangential grinding force result in a higher and denser signal in 0-6 kHz band, which corresponds to the fiber fracture.With high strength and high elastic modulus, the fiber embedded in the material is hard to break; therefore, the increase in fiber fracture is the main reason for the increase of the grinding force. For the AE signal of 240 # grinding wheel, it was observed from Figs. 9(c) and 9(d) that more peaks appear at high grinding speed and low grinding depth, while higher peaks are found at low speed and high depth. Such behavior could be attributed to the wheel blockage at low speed and high depth, extensively damaging the grinding surface.
The average value of the AE amplitude was calculated for each frequency band under the machining parameters shown in Fig. 8. To study the relationship between the main sources of energy consumption during the material removal and grinding force, the ratio between each frequency band amplitude and the sum of the four amplitudes during a whole machining process(referred to as energy ratio)is calculated and shown in Fig. 10. Through a comparison between the energy ratios, or sum of several ratios, and a grinding force, it was found that the sum of the energy ratios of the 1st and the 3rd frequency bands(correspond to a fiber fracture and friction)has a similar trend to grinding force when using various machining parameters.The main sources of energy consumption during a wheel grinding process are fiber fracture and friction between the tool, workpiece, and debris. It should be noted that for grinding speed 2.8 m/s and 100 # grinding wheel, when grinding depth changed from 0.14 mm to 0.16 mm, the energy ratio increased dramatically, which could be due to the increase of fiber fracture and fiber debonding with the increase of grinding depth. It could be found from Fig. 9(b) that the 0-6 kHz AE signal band is wider and the signal peak of 6-18 kHz are higher for 0.16 mm than that for 0.14 mm. These phenomena indicated more fiber fracture and more serious fiber debonding during the grinding process with the grinding depth of 0.16 mm than that of 0.14 mm.The fiber fracture and debonding energy cost of the grinding process with the grinding depth of 0.16 mm are much higher than that of 0.14 mm,lead to the dramatic increase of the energy ratio. When grinding depth increased from 0.16 mm to 0.18 mm, the fiber fracture and fiber debonding peak reduced significantly, resulting in the reduce of energy ratio.
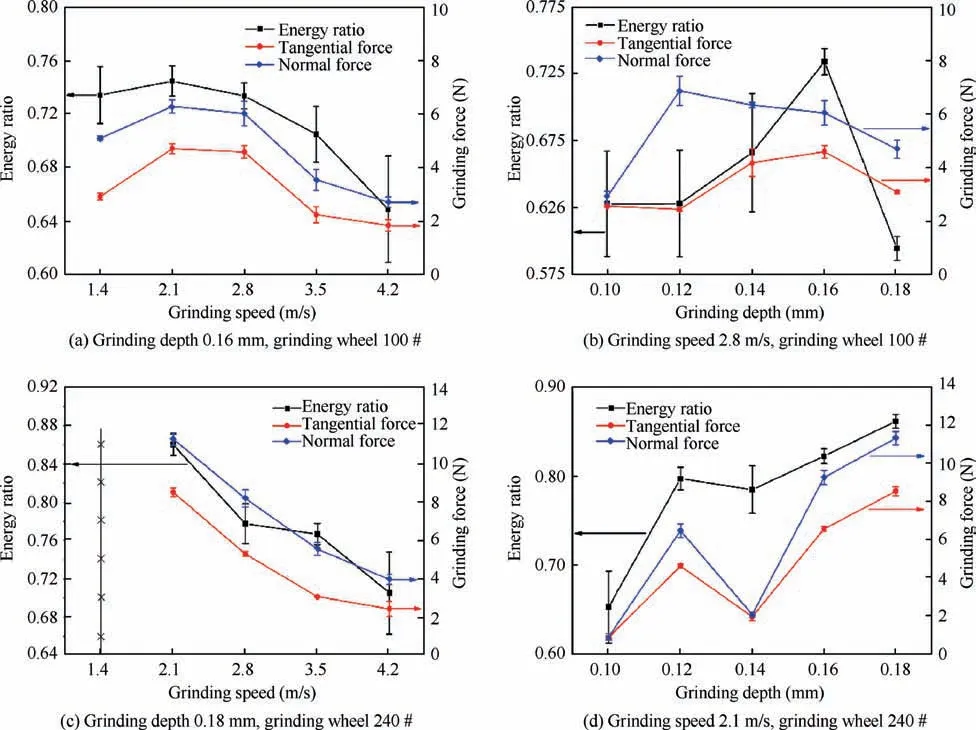
Fig. 10 Relationship between sum energy ratios of 1st and 3rd frequency AE signal band and grinding force (machining parameters shown).
As shown in Fig. 7, some transverse fibers are fractured without deformation, while the others are fractured but not completely removed,retaining some degree of plastic deformation.The identic situation was encountered in fibers at the end surface; thus, it was concluded that fiber fracture consumes a large quantity of energy. Matrix crack makes fibers lose their protection, which results in debonding, which is mainly brittle removal process, thus reducing energy consumption.
As presented in Ref. 23, the total specific grinding energy can be primarily divided into three components: specific chip formation energy, specific sliding energy, and specific ploughing energy. Friction is similar to sliding and ploughing, which expend a significant amount of energy. In other words, it can be concluded that the removal mechanism of 3D orthogonal SiO2f/SiO2is fiber fracture dominated with matrix crack and debonding. The main sources of energy consumption are fiber fracture and friction.
4. Conclusions
In this study, the influence of grinding parameters on the grinding force, surface roughness, and AE signal of SiO2f/SiO2was investigated. The experimental result of the grinding wheel was compared with a single scratching test.The AE signals were analyzed, and material removal mechanisms were discussed based on the experimental result.The following conclusions were drawn based on the presented results:
(1) The changes in grinding force trends between single grain and diamond wheel grinding are significantly different.The main reasons are the statistical grinding depth and the quantity of diamond wheel grains taking part in the machining process,which vary with the nominal machining parameters.A semi-analytical force model is established to explain this behavior and associated causes.
(2) Typical AE signal frequency bands of single grain and diamond wheel grinding are similar; however, the latter is smaller since the wheel decreases the machining system stiffness. Furthermore, the 0-6 kHz frequency band is associated with fiber fracture, 6-18 kHz is associated with debonding,18-22 kHz is associated with friction between the tool, workpiece, and debris, and finally, 25-32 kHz is associated with matrix crack for a wheel grinding.
(3) The trend in SiO2f/SiO2surface roughness changes following the grinding process is the same when compared to the trend in grinding force changes. The main reason for the increase in grinding force is fiber fracture.
(4)The removal mechanism of 3D orthogonal SiO2f/SiO2is fiber fracture dominated, supplemented with matrix cracking and debonding. The primary sources of energy consumption are fiber fracture and friction.
Declaration of Competing Interest
The authors declare that they have no known competing financial interests or personal relationships that could have appeared to influence the work reported in this paper.
Acknowledgement
This study was supported by the National Natural Science Foundation of China (Nos. 51375333 and 51805365).
 CHINESE JOURNAL OF AERONAUTICS2021年5期
- CHINESE JOURNAL OF AERONAUTICS的其它文章
- Ferrofluid moving thin films for active flow control
- Preliminary study on heat flux measurement data of TT-0 flight test
- An analysis and enhanced proposal of atmospheric boundary layer wind modelling techniques for automation of air traffic management
- Jet sweeping angle control by fluidic oscillators with master-slave designs
- Hot deformation behavior and microstructure evolution of the laser solid formed TC4 titanium alloy
- Electrochemical trepanning with an auxiliary electrode
