Thermal performance of a 3D printed lattice-structure heat sink packaging phase change material
Yundong GUO, Huning YANG, Guiping LIN, Hichun JIN,Xioin SHEN,*, Jing HE, Jinyin MIAO
a Laboratory of Fundamental Science on Ergonomics and Environmental Control, School of Aeronautic Science and Engineering, Beihang University, Beijing 100083, China
b Beijing Key Laboratory of Space Thermal Control Technology, Beijing Institute of Spacecraft System Engineering,China Academy of Space Technology, Beijing 100094, China
KEYWORDS 3D printing;Experiment;Lattice-cell structure;Phase change material;Simulation;Thermal energy storage
Abstract Thermal storage technology is becoming more and more significant with the increase of high-power equipment in space applications. In this paper, 3D printing technology and Phase Change Material(PCM)were combined into a Thermal Energy Storage(TES)system,which could fulfill the requirements of light weight and high thermal conductivity.A 3D-printed lattice-structure TES plate with N-tetradecane as the PCM and aluminum alloy as the thermal conductivity enhancer was manufactured,and experimentally tested in a thermal vacuum chamber.In addition,a simplified simulation model of the lattice cell was established to clearly analyze the heat transfer process of the TES plate.The effects of initial temperature distribution and heat load gradient on the thermal storage performances were investigated experimentally and theoretically. The equivalent thermal conductivity of the 3D-printed lattice-structure TES plate turns out to be 13 times of the pure PCM thanks to the aluminum skeleton. The heat transfer enhancement appears at the end of the phase change stage due to the sudden mixture of the PCM with different temperature.The simulation results agree well with the experimental data.The equivalent thermal conductivity obtained by the phase change simulations are a little higher than those of the experiments, which is mainly caused by the initial uneven temperature distribution in the tests. Additionally, the effects of non-uniform heat load and the presence of the PCM in the TES plate are studied. This work successfully validates the feasibility and effectiveness of 3D printing technology and TES technology for the temperature control in space applications.
1. Introduction
With the development of the world industry,traditional energy sources are gradually unable to meet people’s needs.The use of renewable energies, such as solar energy, geothermal energy,and industrial waste heat, have become the research focus in many countries.However,those energies are usually characterized by discontinuity and instability, making that thermal energy storage (TES) becomes more and more important.1On the other hand, the environment for spacecraft, lunar probes and other probes, is severe and changeable.2In the lunar period, the temperatures of the probes increase when they are subjected to various external heat fluxes such as solar radiation, lunar infrared radiation, and sunshine reflections.3During the moonlight night, the probes and astronauts would radiate heat to the cryogenic background,leading to a considerable temperature drop and equipment operation failure.The traditional thermal control method is through changing the radiation area to minimize radiation heat transfer, and applying extra electric heaters, which need more complex mechanical structures and tremendous launching thrust of the rocket.Therefore,effective energy conversion and storage of the external heat fluxes would be of significance,since the external heat fluxes during the lunar period can be used for the moonlight survival of the probes.
There are several different technologies for the energy conversion and storage.Phase change energy storage is one of the essential methods to alleviate the mismatch of energy, time,and location. Zalba et al.4carried out a literature review of the history of TES with solid-liquid phase change, focusing on the phase change materials, the heat transfer performance,and the applications of the TES system. Du et al.5and Cunha et al.6conducted reviews on phase change materials (PCMs)and their applications for heating,cooling,and electricity generation according to the working temperature ranges, which were divided into four ranges from -20°C to 200°C. PCMs have also been utilized in several applications due to their high thermal storage density with moderate temperature variations,which meets the potential thermal comfort requirements.7-10
However, most PCMs have low thermal conductivity and poor heat transfer performance which make the thermal energy storage device unable to store and release heat quickly.11Mahdi et al.12reviewed the significant studies on the hybrid heat transfer enhancement techniques of the latent thermal energy storage systems. Some researchers highlighted the improvement in the thermal conductivities of PCMs by using fins,metal foams,or nanoparticles to enhance their thermal performances in concentrated solar power plants.13,14In order to improve the equivalent thermal conductivities of energy storage devices, some researchers charged PCMs into the metal foam materials which were used as skeletons.15-18On the one hand, the metal foam could maintain the strength of the TES devices because of the compact structure. On the other hand, the thermal conductivity and huge heat exchange area of the metal foam have a notable significance for the equivalent conduction performance.Baby and Balaji19investigated the thermal performance enhancement and the effect of orientation on a porous matrix heat sink experimentally, in which N-eicosane was used as the PCM,and copper-cell metal foam was the thermal conductivity enhancer. Diani and Campanale20used three kinds of paraffins with different melting temperatures as PCMs,which were charged into three different aluminum foams. The simulation of transient melting process was conducted corresponding to the experimental results,and an empirical correlation was proposed to model the paraffin melting phenomenon.Zhao et al.21studied the TES performance of the paraffin wax RT58 embedded in copper foams experimentally, and noticed that the addition of metal foam could increase the overall heat transfer efficient by 3-10 times during the melting process.In addition,some researchers tried to invent composite PCMs with nano-materials. One of the widely used materials is high-conductivity carbon such as expanded graphite, porous carbon, and carbon foam,22,23which provided a new way for the heat transfer enhancement.
Although metal foams can increase the thermal conductivity of the TES device, the total mass of the TES device would be too large to be used in space tasks.3D printing technology,interchangeably termed as additive manufacturing, has become a promising technology for numerous applications in automobile, aerospace, building, metal and alloy, electronic,and biomedical fields.24-26Some researchers investigated the application of 3D printing technology in thermal insulation and thermal energy conversion devices. Jafari et al.27printed a stainless-steel porous structure that could be used in heat pipe as the wick, and pointed out that the designed 3Dprinted wick would enhance the heat transfer performance due to its large permeability and capillary performance. Jafari and Wits28reviewed the utilization of 3D printing technology on heat transfer devices,such as single-phase heat exchangers,heat sinks, heat pipes, and other two-phase devices. The 3Dprinted product could not only have excellent thermal properties such as porous diameter, permeability, and porosity, but also the high structural strength properties.26The porous media represented by lattice structure has a very significant application prospect of light weight, and also has high designability. Therefore, the lattice structure has become the research focus of scholars all over the world.29-32It can be concluded that the 3D printed lattice structure could be used for space applications, meeting the requirements of weight, heat transfer, mechanical, optical, acoustic, and other characteristics.
To the best of the authors’knowledge,very few works were performed for the TES device with 3D printed lattice structure.It would bring a lot of unknown characters such as equivalent thermal conductivity, thermal storage rate, experimental performance in a thermal vacuum environment. In order to understand the mechanisms of solid-liquid phase-change heat transfer in 3D printed lattice structure clearly,it is necessary to conduct in-depth research in the experimental and theoretical investigation.
In this paper,a TES plate with a lattice structure was manufactured by 3D printing technology for space applications.The paraffin of n-tetradecane was chosen as the PCM, and the TES plate material was AlSi10Mg because of its excellent processability, low density, good corrosion resistance.3,33,34This paper systematically investigated the transient melting process of the PCM embedded in the lattice-cell structure in a thermal vacuum chamber, and analyzed the effects of the applied heat flux, initial temperature, and heating load gradient. Besides, a simulation model of the lattice cell was established for the 3D printed lattice-structure TES plate, which illustrated the three-dimensional thermal performance of the TES plate.
2. Test prototype and operating parameters
2.1. Lattice cell design
The 3D printed lattice-structure plate was designed by China Academy of Space Technology (CAST) and manufactured by Beijing TSC Co., Ltd. It has undergone a structural optimization design after mechanical analysis,which could be used for space applications.3The device is manufactured by the method of selective laser melting (SLM), which is one of the additive manufacturing techniques. And the AlSi10Mg is one of the widely used materials for space applications in this processing technology. The 3D model of lattice-cell structure in the TES system is shown in Fig. 1. The values of a, b, and c are the same as 10 mm,and the diameters of the eight supporting columns are all 1 mm.The diameter of the center sphere is 4 mm to increase the structural strength of the system and enhance the heat transfer between the structure and the PCM. The photo of the 3D printed lattice-structure plate is shown in Fig. 2, where the wall thickness is 0.5 mm. Different from traditional skeleton structures like metal foams, the lattice structure consists of several rod-shaped supporting columns, and it can be designed into different shapes. In addition, it has a more regular structure and higher porosity.Therefore, the device could be more lightweight and easier to be accepted in space applications, which is sensitive to the weight. The block of sample is measured as shown in Fig. 2,and its size and mass are 100 mm×100 mm×15 mm and 28.64 g, respectively. It has an extremely low equivalent density of 196 kg/m3, reducing the total mass of TES system by half of traditional weight. The mechanical analysis was analyzed, and the maximum stresses of lattices or shell were both lower than the yield stress of AlSi10Mg.3The safety margin was over 4, which is adequate for aerospace applications.
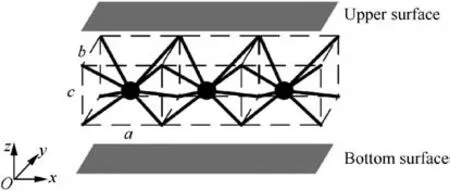
Fig. 1 3D model of lattice-cell structure in TES system.
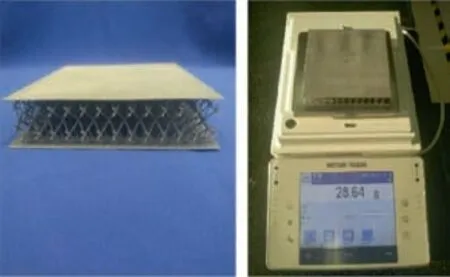
Fig.2 Photo of 3D printed lattice-structure plate and extremely low equivalent density.
2.2. Phase change material
Phase change materials can be classified into four categories:solid-solid,solid-liquid,gas-solid,and gas-liquid.For practical purposes and operating temperatures, the solid-liquid PCMs have been widely used for the building, electronics, and aerospace applications.35There is a wide variety of PCMs with different melting point ranges, and the most common classifications of PCMs are organic, inorganic, and eutectic.36Organic PCMs, like paraffin, have drawn much attention because of their additional latent heat capacities, appropriate phase-transition temperatures, stable physical and chemical characteristics. Moreover, they are non-corrosive and nonsub-cooling. In order to guarantee a relatively low working temperature,the tetradecane is chosen to be the PCM of the3D printed lattice-structure plate,and its thermal-physical properties are listed in Table 1. The charging mass of the PCM into the test unit is 120 g.
2.3. Experimental system and prototype
After the 3D printed lattice structure plate was manufactured,the PCM and the plate are both heated to a relatively high temperature so that the PCM can be charged fluently. The 3D printed lattice-structure plate must be vacuumed to guarantee no air entering the PCM, since air affects the phase change process. The tests of the TES plate are conducted in a thermal vacuum chamber to simulate the outer space environment. The experimental system is shown in Fig. 3, which is consisted of a thermal vacuum chamber (TVC), a liquid nitrogen(LN2)tank,a vacuum pump,a DC power,a temper-ature measurement and data acquisition system, and the TES plate with electric heaters attached on the bottom surface. In the experiments, the TES plate absorbs heat from the electric heaters, and dissipates it through the radiation of the upper surface of the plate,since the cryogenic environment is the only heat sink.The LN2 tank is used to cool down the liquid tubes that are welded onto the inner surface of the TVC,keeping the cabin environment at a low temperature. The vacuum pump sustains the pressure of TVC under 10-4Pa, so that the convection in the TVC can be ignored. The temperatures of the test unit are monitored by thermal couples (TC) of Type T,with a measurement uncertainty of about ±0.5°C. The TES plate is hoisted horizontally in the TVC during the experiments to avoid the heat leakage from conductions.The photos of the TES plate before and after the thermal treatment are shown as Fig. 4. It can be seen from Fig. 4(a) that nine thermal couples are located on the upper surface,and the upper surface is covered with high emissivity polyimide film after thermal treatment, which could enhance the radiation heat transfer. Fig. 4(b) shows the bottom surface with three electric heaters and five TC points. After thermal treatment, the bottom surface and four side faces are covered by multiple insulation layers(MIL) to reduce the heat leakage between the TES plate and environment.
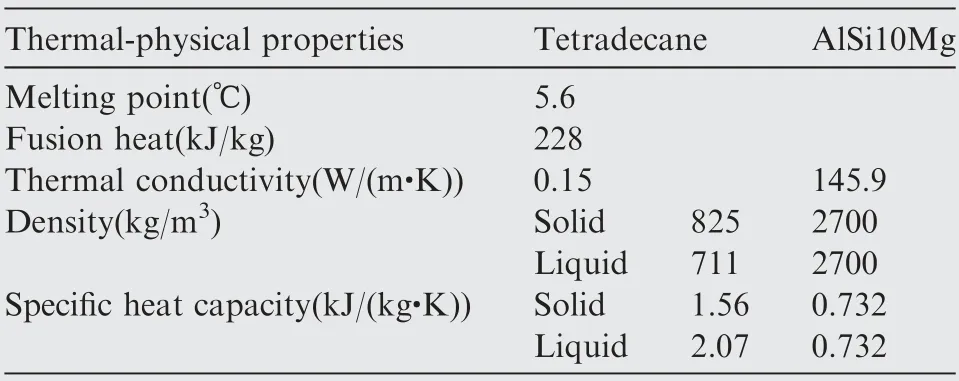
Table 1 Basic parameters of PCM and 3D printed lattice structure.
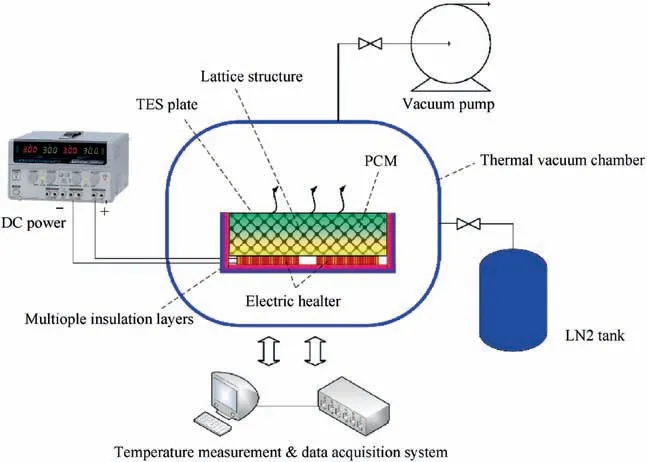
Fig. 3 Experimental system of 3D printed lattice-structure TES plate.
As illustrated in Fig. 5, the size of TES plate used in this paper is 150 mm×120 mm×12.4 mm. Three electric heaters with the size of 100 mm×50 mm are attached to the bottom surface of the TES plate, and the heaters are named H1, H2,and H3. Fourteen thermocouples are attached onto the upper and bottom surfaces. The average distance between the two TC points on one surface is 40 mm, and the temperatures of all the points are used to calculate the equivalent thermal conductivity.
The equivalent thermal conductivity of the TES plate is calculated according to the Fourier’s law:

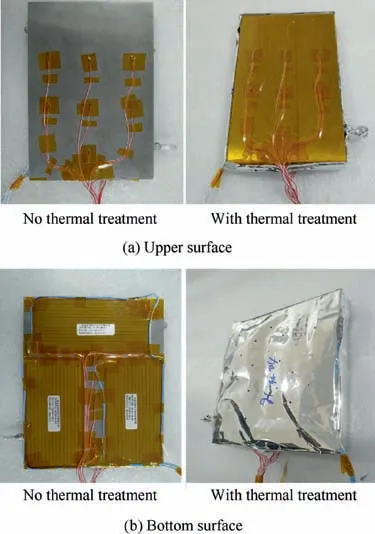
Fig. 4 Photos of TES plate before and after thermal treatment.
where Qtotalis the total heat load applied onto the TES plate,Qris the radiation heat flux dissipated from the upper surface,A is the cross-sectional area,Δx is the thickness,and ΔT is the temperature difference between the hot and cold surfaces.The heat load on bottom surface for temperature control could be recorded at initial steady state.Then the radiation heat load Qrat other temperatures could be obtained through proportional calculation with the initial-state heat load, surface temperature, and environment temperature. Different from the complex calculation procedure with empirical formula that considers the inner structure and amount of experimental data, the simple calculation with the Fourier’s law is adopted.
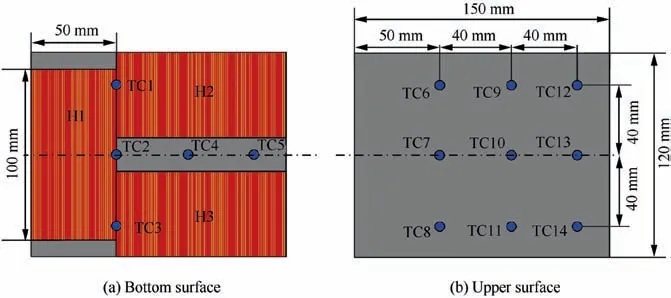
Fig. 5 Structure sizes, electric heaters, and temperature measurement locations.
3. Mathematical model
3.1. Governing equations
Fig. 6 shows the simulation model of the lattice structure,which is one cell of the 3D printed lattice-structure TES plate.The diameters of support column and center point are named as D1and D2, which are 1 mm and 4 mm. Furthermore, the calculation domain is reduced to one quarter with symmetric boundary conditions to reduce the computational time. The phase change process is a nonlinear transient heat transfer problem, when the PCM absorbs or releases the latent heat.The enthalpy method is a commonly used one to solve the transient phase-change heat transfer problem. A uniform energy equation is established in the entire domain, and the commercial software of Ansys Fluent is used to perform the numerical simulation.
In order to simulate the phase change process of the PCM,the mathematical model is established with the following assumptions:10,18
(1) The fluid flow of the liquid PCM is Newtonian,laminar, and incompressible with negligible viscous dissipation;
(2) The PCM density is assumed as a linear function of the operating temperature with the Boussinesq approximation, and the thermophysical properties of solid structures are constant.
(3) The temperature range for the phase transition of tetradecane is 278.7-279.7 K.
(4) The natural convection of the phase change material in the melting state is ignored.
The enthalpy equation governs the solid-liquid phase change process of the PCM, expressed as:

where cpis the specific heat capacity,Tris the atmosphere temperature for radiation,f1is the PCM liquid fraction,and Hfis the fusion energy of PCM. The liquid fraction fland temperature T are calculated by the following equations:
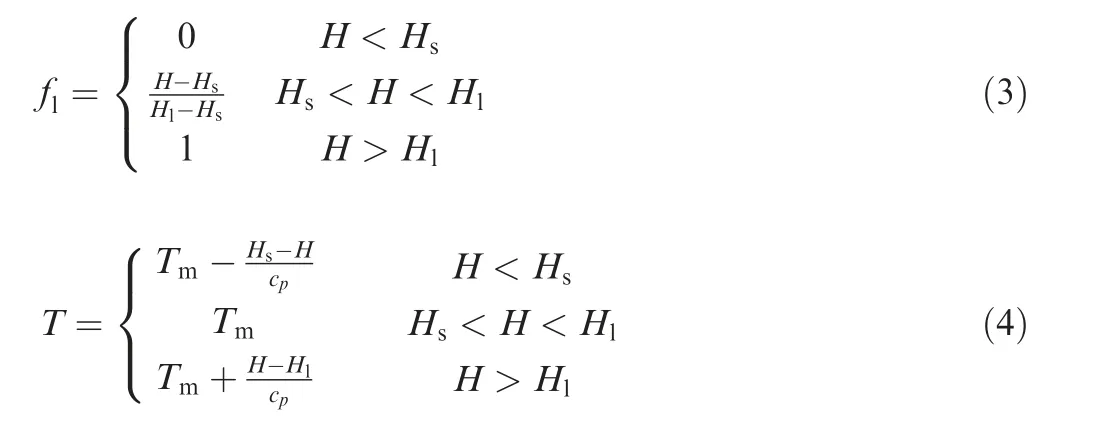
where HSis the enthalpy of the solid-state PCM, Hlis the enthalpy of the liquid state PCM, and Tmis the melting/solidification temperature.
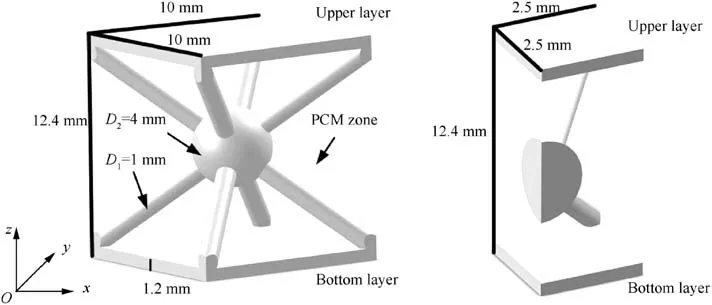
Fig. 6 Model of one lattice-structure cell and calculating domain in ANSYS Fluent.
The mathematical formulation of the transient heat transfer is presented as:

And it can be transformed in to the equation of enthalpy as:

The ρ, T, t, H, k, and Q are density, temperature, time,enthalpy, thermal conductivity, and heat load, respectively.The subscript PCM and s represent the phase change material and solid state. x,y,z means the three spatial directions.
When the lattice structure is used as the heat transfer enhancement technique for the TES device,the conjugate heat transfer occurs between the PCM and the solid structure. The conduction equation governs the heat transfer inside the lattice structures:

At the interface of the PCM and the solid structure, the coupled Dirichlet-Neumann boundary conditions for conjugate heat transfer should be satisfied:

where n is the normal unit of the interface.
3.2. Boundary conditions
The initial and boundary conditions are similar to those of the experiments. In the experiments, a small uniform heat load is applied onto the bottom of the TES plate to a relatively steady state. And the 3D printed TES system could stabilize at the desired temperature. The main difference is the initial temperature distribution of the TES plate because the actual temperatures differ from point to point in the TES plate. The initial temperatures of the lattice structure and the PCM are the same in the numerical simulations, and the values of -10°C, 0°C and 7°C are set for the calculations. Four symmetric boundary conditions are applied to the surrounding side faces, as shown in Fig. 6. The outer wall of the upper layer is set to be a radiation boundary condition, and the bottom surface of the plate is set as a Neumann boundary condition with constant powers of 15 W, 6 W, and 30 W for different cases. The specific initial and boundary conditions employed are summarized below.
a. Initial condition:

b. Heat flux at the bottom of the TES plate:
c. Radiation boundary condition:

d. Symmetric boundary condition:

4. Results and discussions
The thermal storage process is one of the most important characteristics for a TES device,and this paper focuses on the melting performances of the TES plate. In the experimental investigations,multiple sets of tests are conducted,with different initial temperatures, heating gradients, and heating areas.Corresponding to the experimental conditions, several simulation cases are conducted to investigate the melting fraction and the effects of the 3D-printed solid structure. The results of the parametric study are discussed and analyzed.
4.1. Effects of initial temperature on melting performance
4.1.1. Experimental results and discussions
Fig. 7 shows the experimental results of the 3D printed TES plate during its thermal storage process under different initial temperatures.In Fig.7(a),the maximum temperature is about-10°C at the upper surface, indicating a whole solid state of the PCM, and this state is considered as the initial condition.Since this is a dynamic equilibrium with the thermal vacuum environment,there is a temperature difference of 7°C between the bottom and the upper surfaces.The thermal storage procedure could be divided into three stages: solid heating process,phase transition process, and liquid heating process. When an additional heat load of 15 W is applied onto the bottom surface in a uniform style,all the TC temperatures rise quickly with the same rate.The uniform and additional heat load is set as Qu-a.When the PCM begins to melt with a turning point in the temperature curve, a relatively stable platform appears.However, the platform is not absolutely changeless because the melting surface moves continuously, meaning the PCM near the bottom surface may be in superheated state. It is worth noting that the temperature of the bottom surface drops a bit at about 50th min, meaning a temporary heat transfer enhancement of the TES plate. The main reason may be that the sudden collapse of upper layers leads to better contact with the skeleton when all the PCM is transformed into liquid-solid zone.The PCM with low temperature may drop into the lower position by gravity and formed a mixture.In the 3rd stage,the temperature rising rate is the same as that in the 1st stage due to the same thermal conductivity of the fluid and solid states of the PCM.
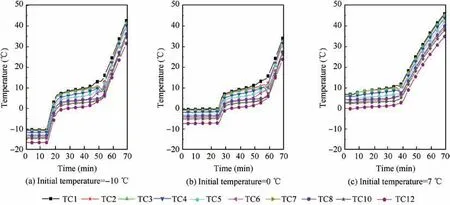
Fig. 7 Melting process of TES plate with different initial temperatures, Qu - a= 15 W.
Fig. 7(b) and (c) show the temperature curves of the TES plate when the initial maximum temperatures are 0°C and 7°C, respectively. The additional heat loads are both 15 W.It can be found that the phenomenon of heat transfer enhancement at the end of the 2nd stage appear again, which could prove the above conjecture again.The temperature rising rates in Fig. 7(b) and (a) are consistent, and the temperature differences between TC1 and TC12 are similar.The initial temperature has slight effect on the thermal storage performance of the TES plate when it is full of solid. However, the temperature difference in Fig. 7(c) becomes larger and larger with the temperature rising,indicating that the equivalent thermal conductivity of the TES plate decreases in the higher operating temperature range. The main reason may be that the superheated zone expands and the temperature increases sharply due to the small heat conductivity of PCM.
Fig. 8 shows the curves of the equivalent thermal conductivities of the TES plate with the operating temperature as the independent variable. The additional heat loads are all 15 W, while the initial maximum temperatures are different.In order to maintain the TES at the different initial temperatures, the initial controlling heat loads applied on the bottom surface are 4.8 W, 5.4 W, and 0 W, respectively. The equivalent thermal conductivity of the 3rd case is lower than those of the former two cases. There are two main reasons for this phenomenon. The first one is that the radiation heat flux in the 3rd case is relatively higher than those of the other cases.And the total power transferring into the PCM would be relatively low.The second reason may be that the average temperature of the upper surface is lower than the recorded value of 7°C.The larger temperature difference between the upper and bottom surfaces makes the equivalent thermal conductivity small. In the phase change zone, the equivalent thermal conductivity is over 2W/(m.K), which is 13 times of that of the pure PCM.It can be concluded that the heat transfer enhancement of the lattice structure is evident.
4.1.2. Simulation results and discussions
Fig. 9 shows the comparison of the average temperature between the experimental and simulating results. In the simulations, the emissivity of the upper surface is set as 0.91. The initial temperature of the whole TES plate is -10°C, and the Qtotalof 19.8 W is applied onto the bottom surface of the TES plate, which are consistent with the experimental conditions. It can be found that the temperature rising rates obtained by the simulation and the experiment are consistent,and the turning points are accordant. However, the simulated temperature difference between the bottom and upper surfaces is smaller than that of the experiment, since the initial state is ideal with no temperature difference in the simulation model.At the 3rd stage of pure liquid,the turning point of simulation is later than that of experiment,meaning the simulation would be a little conservative due to the 4th assumption of ignoring natural convection of the liquid PCM.
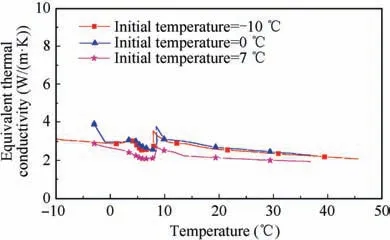
Fig.8 Equivalent thermal conductivity variations with different initial temperature vs. operating temperature.
Fig. 10 shows the mass fraction variations of the PCM on different planes, and the results of four moments, 10 min,20 min,30 min,and 40 min,are demonstrated.The As a quarter of the lattice cell is adopted in the simulation,three parallel faces and four symmetry planes are chosen to present the mass fraction of the PCM. In Fig. 10(a), the three parallel faces are quarter sections of the PCM in the height direction. The four symmetry faces show the effects of the support frame and center point. It can be seen from Fig. 10(a)-(c) at 10 min that the PCM near the bottom solid layer is heated and transformed into liquid. The PCM at the connection corner of the bottom layer and the support pillar is also transformed into liquid due to the high thermal conductivity of metal. The temperature of PCM near the lattice-cell structure increases in different levels due to the solid conduction,which could be found in Fig.10(a)and (c).
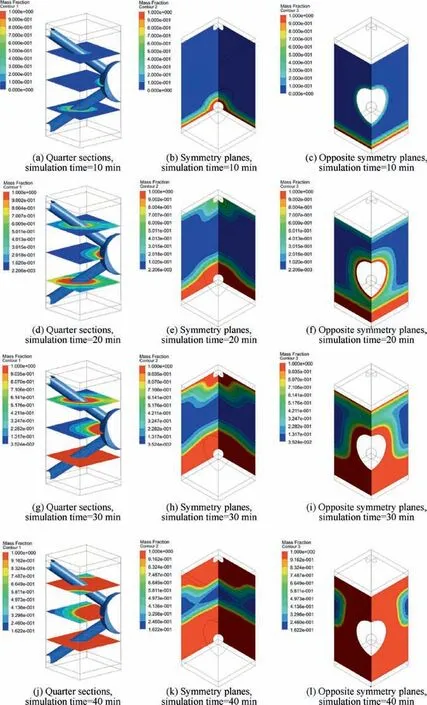
Fig. 10 Mass fraction variations of TES plate on different planes.
Fig.10(d)-(f)show the mass fraction variations of the PCM at the 20th min. The effect of the solid structure is seen more obviously. The PCM near the center point surface and the upper connection corner begins to melt, which are the first zone that the temperature rises.Fig.10(g)-(l)show the simulation results of the mass fraction at the 30th min and the 40th min, when the PCM is partially transformed into liquid in the internal TES plate. Although the upper surface is exposed in the cryogenic environment with high emissivity,the PCM near the upper solid layer could absorb heat load and melt through the efficient thermal conduction of the solid metal structure.The last zone of the PCM to melt is at the longest distance from the solid structure, which could be seen in Fig. 10 (k)and (l). Thus, we can conclude that the lattice-cell structure could enhance the heat transfer process of the PCM at a certain degree.
4.2. Effects of heating gradient on melting performance
4.2.1. Experimental results and discussions
Fig. 11 shows the experimental results for the effects of the heating gradient on thermal storage performances. In the three cases, the maximum initial temperatures of TES plate are all about 0°C with Qu-aapplied on the bottom surface.The Qu-aof 6 W, 15 W and 30 W are applied onto the TES plate, respectively. The temperature variations of the characteristic points on the surface are similar to those in Fig. 7,indicating a similar heat transfer process. At the end of the 2nd stage of melting, a short heat transfer enhancement phenomenon is also observed. Nevertheless, in the 2nd stage, the temperature difference between TC1 and TC12 is larger in Fig. 11(c) than that in Fig. 11(a). The main reason is that the larger heat load of 30 W leads to a thermal strike. When the heat load transmitted to the PCM cannot be dissipated in a short time, it will cause the local temperature increase sharply. And the PCM with low thermal conductivity would lead to the temperature rise again. Therefore, with the relatively larger heat load, the temperature rising rate and temperature difference are greater.
Fig.12(a)shows the equivalent thermal conductivity variations at different Qu-a.The operating temperature is regarded to be the average temperature of the hot and cold surfaces. It could be found that the equivalent thermal conductivities under different conditions differ a lot. The main reason may be that the temperature distributions are uneven, leading the initial effect zoomed under the small heat load of 6 W. With a larger heat load applied to the TES system such as 15 W and 30 W, the effects of net heat flux are obvious and the equivalent thermal conductivity is relatively larger. Fig. 12(b)shows the simulation results of the equivalent thermal conductivity variations at different Qu-a.The overall simulation data is higher than the experimental results because of different initial temperature distributions, since there are larger temperature differences in the experiments. The overall variations of the equivalent thermal conductivity are similar, and the short-time heat transfer enhancements during the phase change process are also found in the simulation curves. In addition, the equivalent thermal conductivities obtained by the experiments and the simulations decrease slowly with the increase of the temperature. The main reason is that the thermal radiation dissipated to the outer environment increases with upper temperature rising, meaning the net heat flow decreases.
4.2.2. Simulation results and discussions
Fig. 13 shows the comparison of the mass fraction of PCM under different heat load gradients at the same time.The initial temperature is set as 0°C, and the Qu-aof 6 W, 15 W and 30 W are applied onto the bottom surface of the TES plate.We choose the simulation results of the mass fraction at the 20th min,and seven faces are detected.Meanwhile,the temperatures of the hottest and coldest surfaces in the three cases are compared, which is shown in Fig. 13(c), (f), and (j).
It can be seen that the PCM near the solid structure would melt first, which could be observed more obviously when the heat load increases. The dual effects of the bottom surface heating and the support column heating make the phase change material melt in layers. Therefore, the PCM below melts faster,followed by the PCM at the center and solid connection corners. Similar to Fig. 10, the mass fraction of the minimum value is at the remote zone from the solid center.And it could be speculated that in order to further increase the phase transition time and maintain the temperature in a reasonable working range, the diameter of the center point can be appropriately reduced under the condition of the structural strength. In the Fig.13(c),(f),and(j),the maximum and minimum temperatures of the cell are recorded at the same time of the 20th min.The temperature difference and the maximum temperature rise with the increase of the heat load.From the temperature distribution, the radiation heat flux from the upper surface could be calculated. The net heat load could be calculated by subtracting radiation heat flux from total heat load applied on bottom surface. And the equivalent thermal conductivity is related with the maximum temperature difference and net heat load, as shown in Fig. 14. It could be seen that the radiation heat loads are similar at the same operating temperature,but the temperature difference is relatively larger under higher heat load. When the operating temperature is at the melting temperature, the temperature difference drops quickly, leading to a peak of the equivalent thermal conductivity.
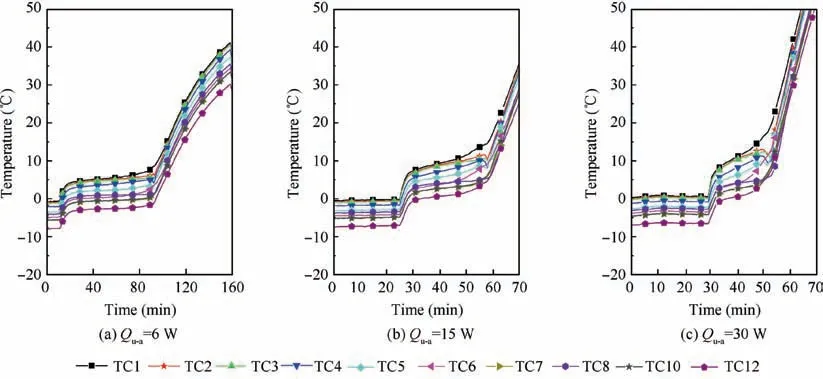
Fig. 11 Thermal performance of TES plate with an initial temperature of 0°C with different Qu - a.
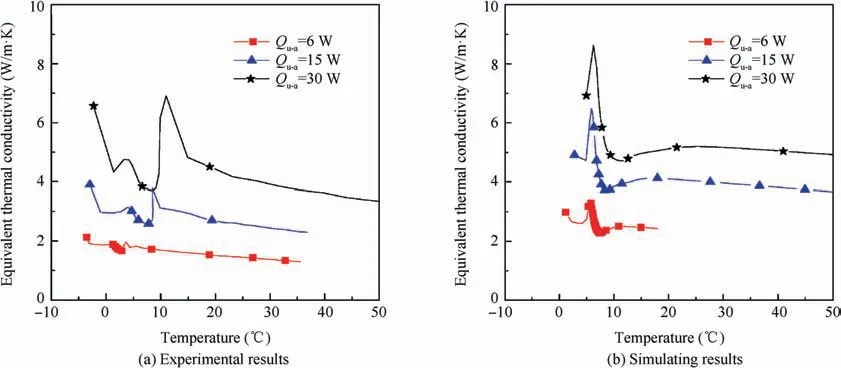
Fig. 12 Equivalent thermal conductivity variations with different Qu - a vs. operating temperature.
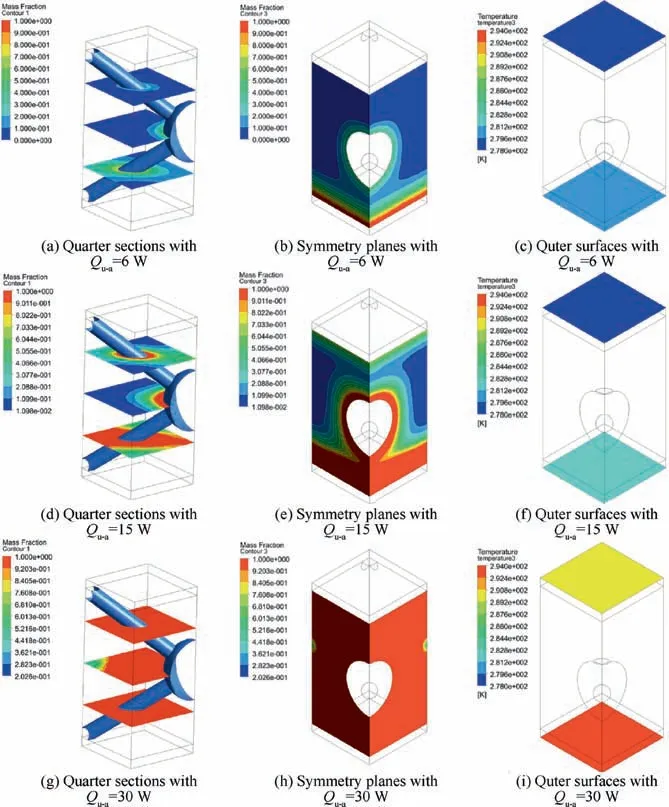
Fig. 13 Comparison of mass fraction variations under different heat load gradients.
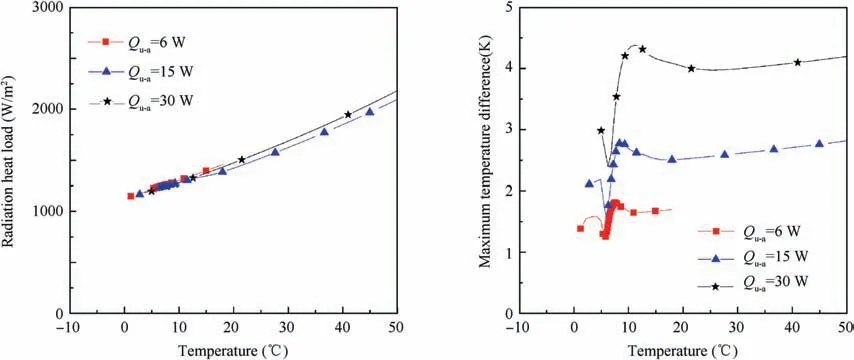
Fig. 14 Radiation heat load and maximum temperature difference with various Qu - a.
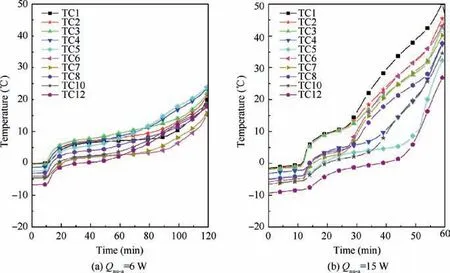
Fig. 15 Thermal performance of TES plate with different Qnu - a.
4.3. Results and analysis for the influence of other parameters
4.3.1. Effects of non-uniform heat load on melting performance
A uniform heat load onto the bottom surface of the TES plate would bring a relatively stable maximum temperature difference. But the thermal performance coping non-uniform heat load that is set as Qnu-ais also one of the essential characters.Fig. 15 shows the experimental results of the TES plate under different Qnu-aconditions. With the initial controlling power unchanged, the heater H1 is applied with 6 W or 15 W, and the temperature variations of characteristic points are recorded. The initial maximum temperature of the TES plate is about 0°C. It could be found from Fig. 15 that the temperature distribution is uneven or even chaotic.TC5 rises with the biggest rate instead of TC1 near the heater, which could be seen in Fig. 15(a). The main reason may be that PCM near TC5 melts first, and then its temperature rises quickly. On the other hand, it means that the heat transfer through the solid surface is larger than that of the cross-section.
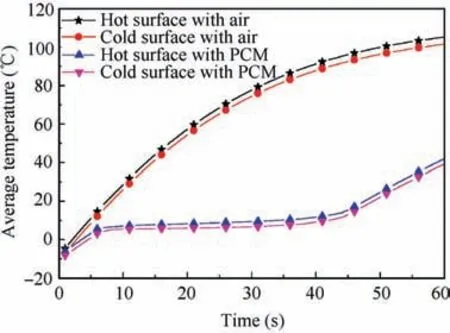
Fig.16 Comparison of simulation results with different working fluid.
Fig. 15(b) shows the temperature variations of the TES plate with a Qnu-aof 15 W. Different from Fig. 15 (a), TC1 rises quickly, and the PCM near TC1 melts firstly with a big temperature difference. When the PCM near TC1 melts thoroughly into liquid at about 30th min, turning points on TC1,TC2, and TC6 appear. However, the points away from the heater, such as TC4, TC5, TC10, and TC12, rise slowly and are even under the fusion temperature. Therefore, it could be concluded that heat transfer in the solid surface dominates under the situation of small Qnu-a, leading a relatively small temperature difference in the TES plate. With the Qnu-aincreasing, the thermal conduction across the plate dominates gradually.
4.3.2. Comparison of the presence of phase change materials
The phase change material is usually used to keep the equipment temperature stable under the condition of the heat load sudden change.It could keep the temperature stable for a certain period of time and delay the process of temperature rise.Therefore, in order to further study the effect of the PCMs on the temperature control capacity, the following studies are performed. It is assumed that there is no medium in the 3D printed lattice-structure plate, that is, the plate is empty with only air in it. In this case, the initial temperature is set as -10°C, and a uniform power is applied onto the bottom surface. The average temperatures of the hot surface and the cold surface are recorded as shown in Fig.16.The temperature of the plate rises quickly with a larger growth rate compared with the results with the PCM.Because the specific heat capacity of air is about 1006J/(kg·K), which is lower than that of the solid PCM of 1560J/(kg·K). As the temperature increases, the thermal radiation load rises synchronously,bringing a relatively slow growth rate. In the thermal storage system with PCM inside TES plate, the temperatures of average values are far below in the same period.Therefore,we can conclude that the PCM in TES plate could improve the system’s temperature control ability significantly so that the system temperature can be stabilized within a reasonable working range for a long time.
5. Conclusions
In this work, a TES combined with 3D printing and phase change material technologies was designed and manufactured.It could be used for space applications due to its light-weight character and good structural strength. The experimental and simulating analysis was conducted in this work,and some brief conclusions could be drawn as follows:
(1) In the TES plate,the PCMs with low thermal conductivity makes full use of robust aluminum skeleton for heat transfer enhancement, with equivalent thermal conductivity of 13 times of pure PCM.
(2) The phenomenon of heat transfer enhancement at the end of phase change stage appears due to sudden mixture of the PCM.
(3) The melting timespan in the simulation results is consistent with the experimental results with allowable error,which is mainly caused by the neglection of PCM convection.
(4) The dual effects of bottom surface heating and support column heating make the phase change material melt in layers, with the PCM below or at the center and solid connection corners melting faster.
(5) The effects of some other parameters such as nonuniform heat load and charged medium were also studied. This work successfully validated the feasibility and effectiveness of 3D printing technology and thermal energy storage technology for temperature control in space applications.
Declaration of Competing Interest
The authors declare that they have no known competing financial interests or personal relationships that could have appeared to influence the work reported in this paper.
Acknowledgement
This work is supported by the Postdoctoral Science Foundation of China (No. 2019M660403), and the National Natural Science Foundation of China (No. 51806008 and No.51706020).
 CHINESE JOURNAL OF AERONAUTICS2021年5期
- CHINESE JOURNAL OF AERONAUTICS的其它文章
- Ferrofluid moving thin films for active flow control
- Preliminary study on heat flux measurement data of TT-0 flight test
- An analysis and enhanced proposal of atmospheric boundary layer wind modelling techniques for automation of air traffic management
- Jet sweeping angle control by fluidic oscillators with master-slave designs
- Hot deformation behavior and microstructure evolution of the laser solid formed TC4 titanium alloy
- Electrochemical trepanning with an auxiliary electrode
