Reflected shock/turbulent boundary layer interaction structure analysis based on large eddy simulation
Dongdong ZHONG, Lixu WANG,b, Ning GE,*
a College of Energy and Power Engineering, Nanjing University of Aeronautics and Astronautics, Nanjing 210016, China
b Nanjing Engineering Institute of Aircraft Systems, AVIC, Nanjing 210016, China
KEYWORDS Large eddy simulation;Reflected STBLI;Rescaling/recycling method;Shock motion;Turbulent
Abstract In order to understand the physical phenomenon of the reflected shock/turbulent boundary layer interaction,the Large Eddy Simulation(LES)is conducted to investigate shock wave and turbulent boundary layer interaction in a 12° compression ramp with inlet high Mach number of 2.9. Rescaling/recycling method is used as inflow turbulence generation technique and validated on a supersonic flat plate turbulent boundary layer. The flow field of recycling plane in the plate computation domain is obtained to give the inlet boundary condition for the LES computation.This paper focuses on the reflected shock/turbulent boundary layer interaction region, where the fine flow structure and instantaneous flow field are analyzed in detail.It is found that the unsteady motion of the shock wave leads to the increase of wall pressure fluctuation.
1. Introduction
With the rapid development of aerodynamic research, the Shock/Turbulent Boundary Layer Interaction (STBLI) has become one of the important problems in the supersonic flow for a long time. However up to now, there are still some complex phenomena that cannot be reasonably explained, for example the low-frequency unsteady effect of STBLI. After measuring many compression-corner models, Lee and Wang1concluded that the shock oscillation is of inherent nature in STBLI with separation. This unsteady effect refers to a large-scale instability characteristic of the whole flow field,including shock wave system,separation bubble and free shear layer.
Dupont et al.2used Particle Image Velocimetry(PIV)technology to observe the Reflected Shock/ Turbulent Boundary Layer Interaction (RSTBLI) flow field with different shock incident intensities at Mach number 2.3. It was found that there is a large-scale convective structure in the shear layer.It was confirmed that the shock induced separation flow in RSTBLI is unsteady at low frequency.Bookey et al.3has studied the flow field under the 12° incident shock wave with the inlet Mach number 2.9 and momentum thickness Reynolds number Re=2400. The lower Reynolds number condition of the experiment provides great convenience for the verification of numerical simulation methods.Jammalamadaka et al.4used Direct Numerical Simulation (DNS) to study RSTBLI with Mach number 2.75. It was found that the turbulent kinetic energy generated in the interaction mainly comes from the growth of the generation term in the turbulent kinetic energy equation. After careful examination and comparison of the turbulent kinetic energy transport equations, it was found that there is a continuous energy exchange between the fluctuating flow field and the average flow field in the interaction region,and the energy exchange intensity increases with the increase of the incident shock wave intensity.
In turbulent boundary flows,the downstream flow physical phenomenon is pretty sensitive to the state of the inlet turbulent boundary layer, including boundary layer thickness, skin friction coefficient,velocity distribution,wall temperature conditions, etc. For this type of problem, a complex turbulent boundary layer generation method is required to simulate the turbulent characteristics at the inlet of computation domain.Therefore,turbulence generation technology has been one of the core problems in Large Eddy Simulation(LES)and DNS.
For generating inlet turbulence, the Rescaling/Recycling Method (RRM) was developed by Lund et al.5According to the turbulent boundary layer similarity theory, this method extracts the time-averaged parameters and fluctuation parameters of recycled plane downstream of the boundary layer.The parameters are rescaled according to the boundary layer similarity theory and superimposed to the inlet plane, to maintain turbulent fluctuation information at the inlet turbulent boundary layer. The key of this method is that the turbulent flow must be fully established inside the computation domain by the recycling process.
This work focuses on the reflected shock/turbulent boundary layer interaction region, where the fine flow structure and instantaneous flow field are analysed in detail. The rest of the paper is organized as follows. In Section 2, we describe the rescaling/recycling method and present the LES validation on the flat plate with inlet high Mach number. In Section 3,we use the LES method to simulate the reflected shock/turbulent boundary layer flow, analyse the structure of interaction and discuss the flow mechanism. The conclusions are drawn in Section 4.
2. Rescaling/recycling method and its verification
2.1. Model and setting
Based on Spalart and Leonard’s research6, Lund et al.5first developed a RRM for incompressible turbulent boundary layer flow.Urbin and Knight7extended Lund’s RRM to compressible turbulent boundary layer by using Van Driest transform method. Theoretically, the RRM is applicable only for the fully developed turbulent boundary layer on a flat plate with zero pressure gradient,and the wall condition is solid wall without sliding. The typical schematic diagram of this method is shown in Fig.1.The plane at the entrance of computational domain is called inlet plane, and a plane selected downstream is called recycling plane.
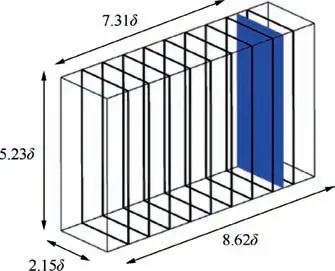
Fig. 1 Schematic of flat computation domain.
In order to verify the RRM in the supersonic turbulent boundary layer, if inlet boundary layer thickness δ is chosen as the calculated reference length, the computation domain of this paper is chosen as Lx×Ly×Lz=8.62δ×2.15δ×5.23δ (56 mm×14 mm×34 mm), respectively corresponding to the streamwise, spanwise and normal direction. A‘‘recycling plane” is made in the flat plate computation domain. Fig. 1 shows that the plane (blue plane) is located downstream of the computation domain, approximately 7.31δ from the inlet plane.
In the present large eddy simulation, the number of grid points in three directions is 311×120×112, corresponding to the streamwise (x), the spanwise (y) and the normal (z)direction. Fine grids are needed along the normal direction(z)near the wall to ensure the height of the first grid layer satisfyingΔz+≤1.At the wall of recycled plane,the first grid size is Δx+=8.2,Δy+=5.3,Δz+=0.46 where the friction velocity uτ=32.66 m/s is obtained by the local computation. Table 1 gives all the information about grid and compares it with DNS grid under the same inlet conditions.
In the LES, the Roe scheme is used for the evaluation of convective fluxes, the WENO_ZQ scheme9with the fifthorder precision is used for the interface reconstruction, and the sixth-order central difference scheme is used for the spatial discretization of viscous fluxes. Time discretization uses the Runge-Kutta method with a total variation reduction property with the third-order accuracy.Dynamic sub-grid scale model is adopted and the sub-grid scale viscosity coefficient is determined with the two-consecutive filtering by the method of Germano et al.10For supersonic flat plate turbulent boundary layer,the upper side and the outlet of the computation domain are set to supersonic boundary conditions.Non-slip isothermal solid wall condition is used at wall, isothermal wall temperature is 307 K,and periodic boundary condition is used in spanwise direction.
The experiment results and numerical simulation results of flat plate with inlet Mach number of Ma=2.9 are selected for comparison. Table 2 shows the main parameters (Mach number Ma, the boundary layer thickness δ, the boundary layer momentum thickness θ, the boundary layer displacement thickness δ*, the momentum thickness Reynolds number Reθ,skin friction coefficient Cfand inlet temperature T∞) at inlet plane in detail. The boundary layer thickness δ varies a lot between LES and experiment results. In the initial flow field of our RRM, the inlet boundary layer thickness is also 6.7 mm, but after the calculation of the generated turbulent boundary layer, the thickness becomes δcal=6.32 mm. This difference is one of the problems of RRM, which is calledthe drift of the mean profile, which also happened in the simulations conducted by Wu11and Tong12et al. To avoid this drift of the mean profile,a method proposed by Sagaut et al.13is to fix mean profile in the inlet plane and only the fluctuation is rescaled from the recycling plane to the inlet plane. However, this problem does not affect the following research.The flow parameters at downstream δ=6.7 mm in this simulation are extracted as inlet boundary conditions of RSTBLI.

Table 1 Information and comparison of meshing.

Table 2 Comparison of main parameters in supersonic turbulent boundary layer.
2.2. Results and discussion
In the flow of high Mach number, the compressibility makes the turbulent boundary layer complicated. It was found that the turbulent boundary layer has the quasi-sequential vortex structure to maintain the turbulent boundary layer. The hairpin vortex arises from two adjacent counter-rotating vortices and develops downstream, and the vortex heads connect to form a vortex structure with a joint connection in spanwise direction and eventually develop into a complete hairpin vortex structure. Wu et al.11conducted direct numerical simulation of the incompressible turbulent boundary layer under zero pressure gradient. The results indicate the existence of the hairpin vortex, and most of the hairpin vortices in the incompressible turbulent boundary layer appear as approximately symmetric structure. For compressible flow, Fig. 2 shows the present LES instantaneous simulation result and identifies turbulent boundary quasi-order structure by the Q criterion. It indicates that there are a large number of hairpin vortex structures in the outer area of turbulent boundary layer,and most of them exist in the form of asymmetric structures.Robinson15pointed out that the Reynolds number has a great influence on the vortex structure in turbulent boundary layer.Head and Bandyopadhyay16observed the quasi-ordered vortex structures at different Reynolds numbers for the zeropressure gradient turbulent boundary layer, and summarized that, when the momentum thickness Reynolds number Reθis less than 500, the overall structure of the vortex is short,appearing as a horseshoe vortex or a vortex ring; when the momentum thickness Reynolds number is greater than 2000,the vortex structure appears as a slender hairpin vortex.Some studies have shown that, with the increase of Reynolds number,the hairpin vortex breaks up and appears as an asymmetric structure. In this paper, the inlet momentum thickness Reynolds number of the turbulent boundary layer is Reθ=2400.Fig. 2 shows that the quasi-sequence vortex basically appears as a slender,asymmetric hairpin vortex structure.
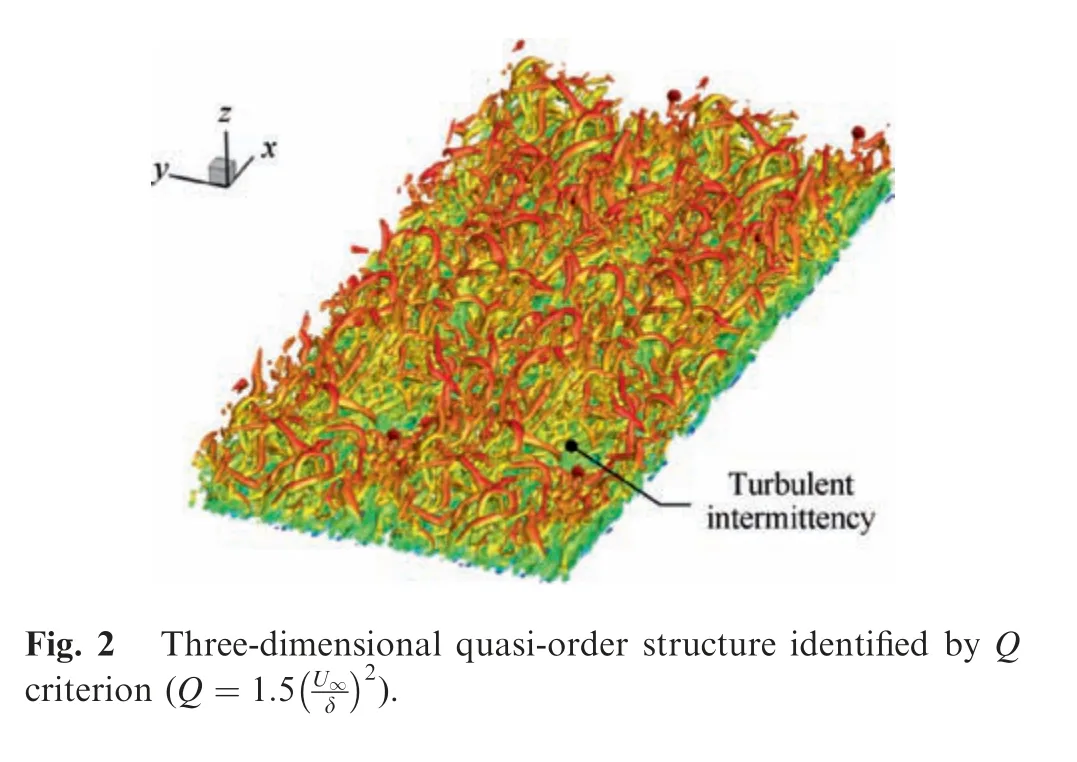
Fig. 3 shows the numerical results of the supersonic turbulent boundary layer and comparison with experimental observations. Fig. 3(a)and (b) show respectively the distribution of instantaneous density and contour of density gradient in the flow field. Fig. 3(c) shows the transient structure of the Ma=2.7 turbulent boundary layer obtained by using the NPLS technique.17Fig. 3 clearly shows the outer large-scale structure and the intermittency in the supersonic turbulent boundary layer. Since the NPLS technique shows the vortex edge with a high bright outline, the density gradient contour is used in Fig. 3(b) to portray structure edges in turbulent boundary layer for more intuitive contrast.
Fig.4 shows the contour of streamwise dimensionless velocity field at the bottom of turbulent boundary layer with z+≈15. It can be clearly seen that the high and low velocity strips are alternately arranged along spanwise direction. This configuration is considered to be related to the maintenance and the development of turbulent boundary layer in the compressible flow.
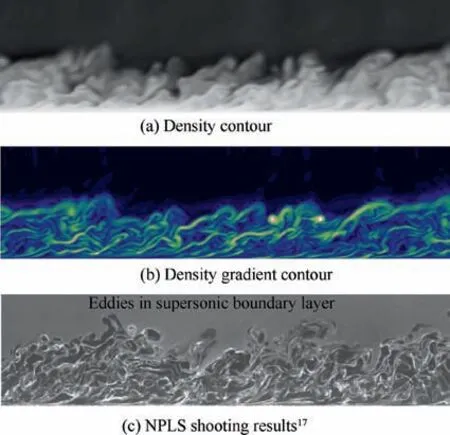
Fig. 3 Transient structure of turbulent boundary layer.
2.3. Turbulent statistical properties
Fig. 5 shows the averaged streamwise velocity distribution along the normal direction on recycled plane. The solid black line represents the present LES computation result. The red dashed line represents the DNS results of Wu et al.11under the same inlet flow conditions. The blue squares represent the experiment results measured by Bookey et al.3from the supersonic flat plate turbulent boundary layer with the inflow Ma=2.9. It can be seen that these three distribution curves are in good agreement.
Fig.6 shows the averaged velocity profile after the Van Driest transform18on recycled plane.It can be seen that the curve obtained by present LES computation agrees well with the law of wall in the viscous sub-layer and logarithmic regions. In addition,the computed curve in wake region is consistent with the DNS results11and the experiment results.3The LES method can simulate a very reasonable velocity distribution in the supersonic turbulent boundary layer.
Fig. 7 shows the distribution of scalar averages f/f∞along the normal direction in boundary layer, including basic physical quantities such as density ρ,pressure P,and temperature T.The squares in the figure represent the LES results of Dawson et al.14under the same flow conditions,while the experimental data is from Bookey et al.3It can be seen from this figure that the scalar distribution of simulation can match well with the results of published literature. Closer to the wall, the density is lower and the temperature higher.
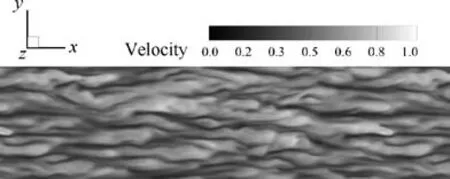
Fig. 4 Streamwise dimensionless velocity strip structure at the bottom of boundary layer.
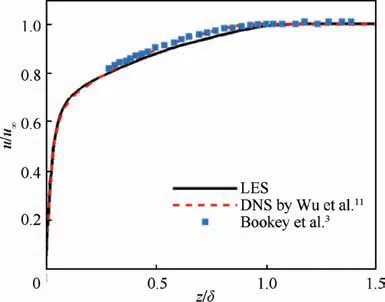
Fig. 5 Averaged velocity distribution.
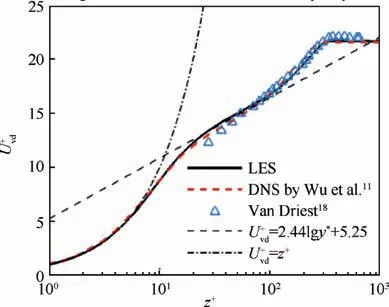
Fig. 6 Averaged velocity profile with Van Driest conversion.

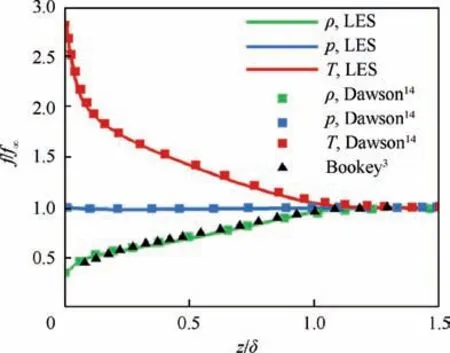
Fig. 7 Distribution of scalar averagesin turbulent boundary.
Fig.8 indicates the distribution of scalar fluctuation frms/f∞in boundary layer along the normal direction.The present LES result is consistent well with Dawson’s result.and with the outer coordinate variable z/δ.It can be seen from the figure that there will be a peak point in the three Reynolds normal stress components near the wall, and then the Reynolds stress will gradually decrease to the outer turbulent boundary layer. Compared with the DNS results of Tong et al.12and the LES results of Dawson et al.,14the present LES Reynolds stress is slightly higher at the peak.
3. Reflected shock/turbulent boundary layer interaction
3.1. Model and setting
Fig. 10 is a schematic of the computation domain ‘‘x-z” section, corresponding to the streamwise and normal directions.In order to generate an oblique shock impinging the boundary layer on the bottom surface,a 12°wedge angle is placed at the top of the computation domain as a shock generator. The streamwise length of the shock generator is 8δ. According to the non-viscous aerodynamics, the position ximpof the incident oblique shock impinging the wall surface is about 13.1δ from the inlet plane. The spanwise width is 2.15δ. The total number of grid points in computation domain is Nx×Ny×Nz= 529×89×133.
As previous, we have verified the rescaling/recycling method, which provided a reasonable inlet turbulent fluctuation and boundary layer thickness for the shock/turbulent boundary layer interaction computation. The flow field of the recycled plane from computation domain is extracted as the inlet boundary conditions for the LES computation. The lower wall surface is non-slip isothermal wall condition, and the isothermal wall temperature is 307 K, which is consistent with the auxiliary computation. Since the flow field information of the inlet plane is obtained by directly extracting the flow field in Section 2, the computation parameters for the inlet turbulent boundary layer can be seen in Table 2. That is, the inflow Mach number Ma=2.9, temperature is 108.1 K, and the density is 0.074 kg/m3.
3.2. Impact of CPME on boundary layer

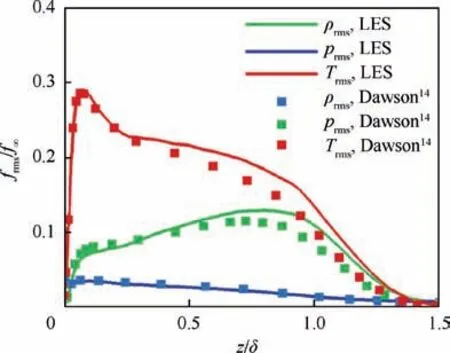
Fig. 8 Scalar fluctuation distribution in turbulent boundary layer.
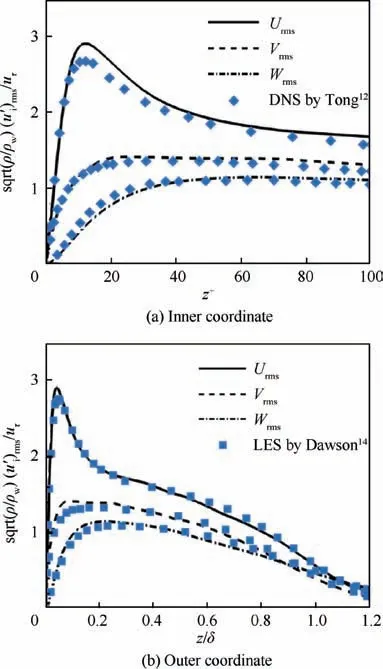
Fig. 9 Reynolds normal stress distribution on recycled plane.
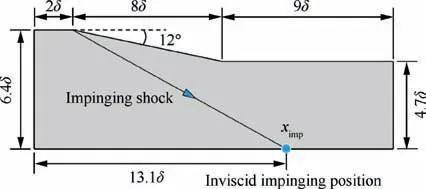
Fig. 10 Schematic diagram of geometric model.
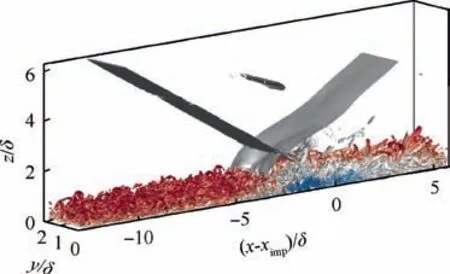
Fig. 11 Shock system and turbulence structure.


In the computation,although CPME does not directly act on the turbulent structure in separation region,the pressure gradient can be transmitted upstream through the subsonic layer in the downstream inner boundary layer.Fig.12 shows averaged wall pressure pw/p∞and skin friction coefficient distribution along the streamwise direction. By solving the position of the averaged skin friction coefficient Cfequal to zero, we can get the average separation point ximp=-5δ and the reattachment point xrea=0.37δ.In order to analyze the impact of CPME,we also show the DNS computation results without CPME under the same inlet flow conditions.It can be found that the present LES result is consistent with the DNS result of Priebe et al.8in the first half of the interaction region. However, the adverse pressure gradient brought by CPME in the latter half causes the boundary layer to be reattached in advance,the wall pressure in the separation region rises rapidly,and the pressure platform disappears.When the boundary layer is reattached,CPME plays a dominant role in wall pressure distribution.
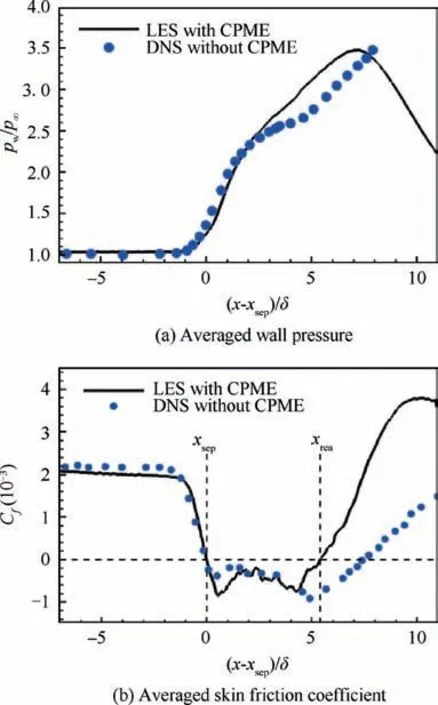
Fig. 12 Distribution of averaged wall pressure and friction coefficient along streamwise direction.
3.3. Fluctuating properties of turbulence
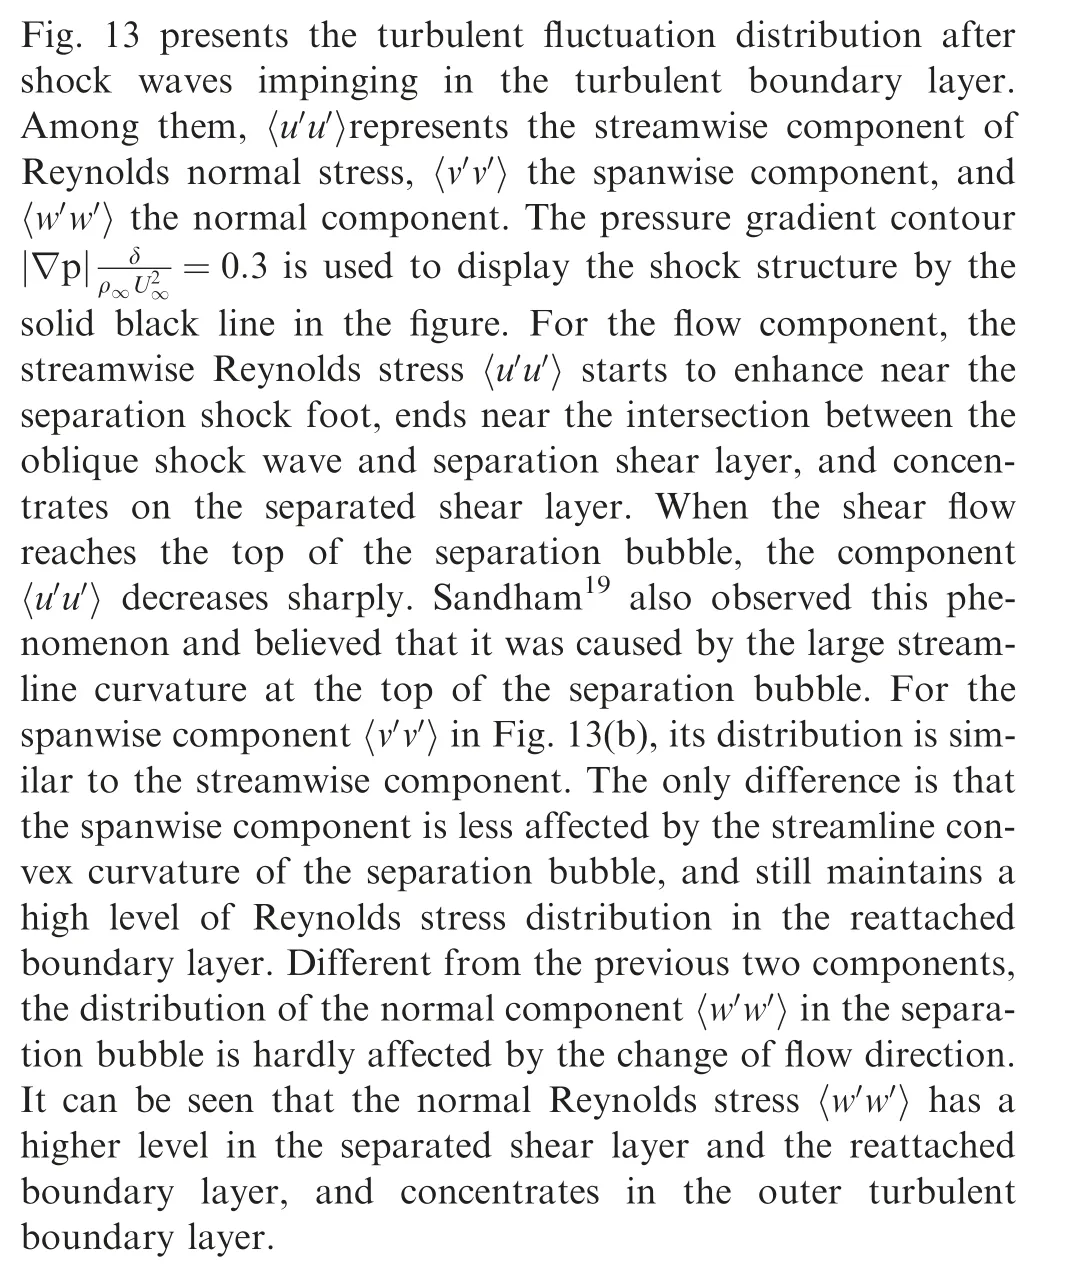
3.4. Unsteady characteristics of shock wave
In order to study the unsteady shock motion, the intermittent factor is used to measure the range of large-scale shock wave motion along the streamwise direction.20The physical meaning of the intermittent factor is the ratio of the time when the instantaneous wall pressure is greater than a given threshold in a streamwise direction position to the total flow time.Fig. 14(a) shows the local intermittent factor λ distribution.From the definition, the intermittent factor is always equal to 0 (or 1) in the undisturbed upstream boundary layer and downstream of the ramp. Assume that the upper and lower limitations of the intermittent factor are 99%and 1%,respectively(as indicated by the blue and red dots in the figure),and the length of the intermittent region can be obtained as Li=0.7δ. In addition, the intermittent factor λ(xsep)=0.93 at the average separation point is also shown,which is slightly higher than the result λ(xsep)=0.84 obtained by experimental result of Pasquariello et al.20In general, unsteady shock wave motion produces high level of pressure fluctuation. Fig. 14(b)shows the wall pressure fluctuation distribution along the streamwise direction. It can be seen that the distribution appears as a single-peak structure with its peak point inside the separation bubble, which is different from the bimodal structure in the compression ramp flow.11According to the computation, the most fluctuation of wall pressure increases by 1.95 times as much as that of inlet turbulent boundary layer when passing through the interaction region.

Fig. 13 Reynolds normal stress component distribution contour.
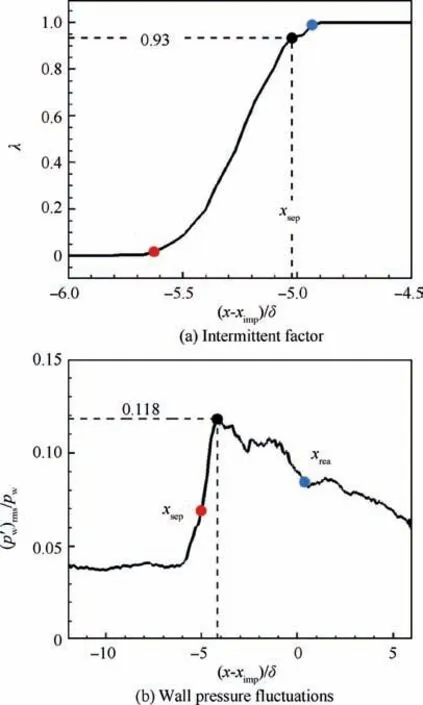
Fig. 14 Unsteady shock motion in streamwise direction.
3.5. Instantaneous flow field structure
The unsteady characteristics make the transient process of the actual STBLI with a strong three-dimensional effect. In order to study the detailed characteristics of flow field in the interaction region, Fig. 15 shows the instantaneous numerical schlieren in the midspan and six different streamwise sections,where black indicates a larger density gradient. As can be seen from the figure,the separation shock wave is divided into three weak compression waves at the foot of the wave,penetrating into the boundary layer and terminating near the sonic velocity line.The analysis shows that the biggest difference between instantaneous flow structure and time-averaged flow structure is that a reflection shock wave may exist before the expansion wave ejection.However,since the flow field exhibits highly unsteady features, the reflected shock wave will be hidden by the timeaveraged effect.17
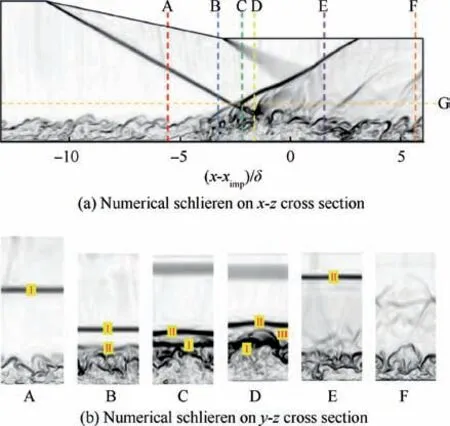
Fig. 15 Instantaneous flow field structure.
Fig. 15 shows the numerical schlieren diagram on y-z section of the six different flowing positions A, B, C, D, E, and the symbolsⅠ,Ⅱand III respectively represents incident oblique shock waves, separation shock waves, and reflected shock waves.Section A represents the unaffected turbulent boundary layer upstream.Since the high adverse pressure gradient exists in the boundary layer, the upstream boundary layer at the shock wave incident point is separated and a compression wave is generated. Section B shows a compression wave at the foot of separation shock (Ⅱ), whose intensity is weak(lighter in color)and curved along spanwise direction.In addition, the boundary layer thickness gradually increases, and small-scale backflow occurs near the wall. Section C and D clearly show the entire process of incident oblique shock (Ⅰ)interacting with the boundary layer. When the incident shock wave intersects the boundary layer, the shock wave is completely distorted by large-scale turbulent structure. It is noted that the presence of reflection shock is captured in section D,which is consistent with the observation in Fig.15(a).Sections C and D represent the process of shear layer reattaching and recovering on the wall. Comparing section A and F, we can find that the boundary layer in section F has a larger-scale turbulent structure and has a certain periodicity in spanwise direction. Theoretically, there is sufficient streamline curvature between the top of the separation bubble and the reattachment flow, which can produce the Go¨rtler-like vortices. The recent experimental results21and numerical results22confirm the existence of such vortex pair in instantaneous flow fields.
In the observation of instantaneous flow field, there is a reflected shock before the expansion wave.A similar structure was observed in numerical studies conducted by Wang17and Joy et al.23Fig.16 shows a partial enlarged view about the flow field of section D in Fig. 15(a) and (b). It can be clearly seen that the oblique shock intersects the shear layer at incident point (as indicated by the red dot) and produces a bow shock and subsequent expansion wave ejection.Since the intensity of bow shock is sufficiently high,the possibility that it is the root of separation shock wave is ruled out. Further analysis suggests that this bow shock wave is a reflected shock wave that is directly reflected by the incident shock wave on the shear layer.Fig.16(b)shows the bow shock structure on y-z section.It can be seen that the reflected shock has significant threedimensional features. Fig. 17 shows the numerical schlieren on section G in Fig. 15(a). The bow shock wave appears as curved wave structure in spanwise direction, related to the local sonic velocity line distribution along spanwise direction in shear layer.
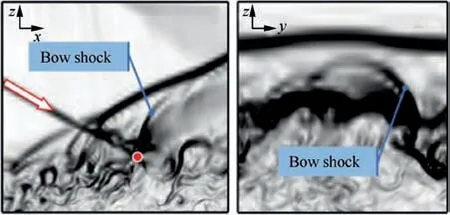
Fig. 16 Partial enlarged view of flow field.

Fig. 17 Reflected shock structure on section G.
4. Conclusions
In this paper, the large eddy simulation is used to study the reflected shock/turbulent boundary layer interaction with inlet Mach number Ma=2.9. The turbulent structure is analyzed and the physical phenomena of the interaction process are discussed in detail. The main conclusions are drawn as follows:
(1) The rescaling/recycling method can generate the fully developed supersonic turbulent boundary layer with small computational cost.It is found that,in supersonic turbulent boundary layer,the quasi-order vortices appear as slender, asymmetric hairpin vortex structures under present inlet momentum thickness Reynolds number.
(2) Due to the presence of the upper boundary wedge angle,a centered Prandtl-Meyer expansion is created when the flow passes through this ramp. The expansion not only makes the separation shock bend significantly, but also partially offsets the reverse pressure gradient on this boundary layer applied by the incident shock, resulting in decrease in the size of separation bubble and disappearance of pressure platform within the separation region and changing significantly the turbulent boundary layer recovery process.
(3) The Reynolds normal stress distributes basically along the separated shear layer. The shock/turbulent boundary layer interaction causes a strong turbulent fluctuation, and the boundary layer exhibits a strong turbulent anisotropy. The distribution of Reynolds normal stress has an important role for the scale of separation bubble, the reattachment of separated shear layer and the recovery of the reattached boundary layer.
(4) The large-scale motion of the separation shock wave along streamwise direction is captured by using intermittent factor. The length of this shock intermittent region is Li=0.7δ. The unsteady motion of the shock wave leads to great increase of wall pressure fluctuation,which can produce serious mechanical vibration problem on device.
(5) The instantaneous flow field structure analysis indicates that, when oblique shock wave impinges the separated shear layer, it will reflect and form immediately a bow shock wave and the subsequent expansion wave ejection,which can be considered as a dynamic phenomenon of shock/turbulent boundary layer interaction, needed to be verified by experiments in the future.
Declaration of Competing Interest
The authors declare that they have no known competing financial interests or personal relationships that could have appeared to influence the work reported in this paper.
Acknowledgements
This study was co-supported by the National Key Project GJXM92579 of China and the National Natural Science Foundation of China (No. 11532007).
 CHINESE JOURNAL OF AERONAUTICS2021年5期
- CHINESE JOURNAL OF AERONAUTICS的其它文章
- Ferrofluid moving thin films for active flow control
- Preliminary study on heat flux measurement data of TT-0 flight test
- An analysis and enhanced proposal of atmospheric boundary layer wind modelling techniques for automation of air traffic management
- Jet sweeping angle control by fluidic oscillators with master-slave designs
- Hot deformation behavior and microstructure evolution of the laser solid formed TC4 titanium alloy
- Electrochemical trepanning with an auxiliary electrode
