Direct numerical simulation of impinging shock wave and turbulent boundary layer interaction over a wavy-wall
Fulin TONG, Dong SUN, Xinliang LI
a LHD, Institute of Mechanics, Chinese Academy of Sciences, Beijing 100190, China
b State Key Laboratory of Aerodynamics, China Aerodynamics Research and Development Center, Mianyang 621000, China
c Computational Aerodynamics Institute, China Aerodynamics Research and Development Center, Mianyang 621000, China
d School of Engineering Science, University of Chinese Academy of Sciences, Beijing 100049, China
KEYWORDS Direct numerical simulation;Low-frequency unsteadiness;Shock waves;Turbulent boundary layer;Wavy-wall
Abstract The interaction of an impinging oblique shock wave with an angle of 30° and a supersonic turbulent boundary layer at Ma∞=2.9 and Reθ=2400 over a wavy-wall is investigated through direct numerical simulation and compared with the interaction on a flat-plate under the same flow conditions. A sinusoidal wave with amplitude to wavelength ratio of 0.26 moves in the streamwise direction and is uniformly distributed across the spanwise direction. The influences of the wavy-wall on the interaction,including the characterization of the flow field,the skin-friction,pressure and the budget of turbulence kinetic energy,are systematically studied.The region of separation grows slightly and decomposes into four bubbles.Local peaks of skin-friction are observed at the rear part of the interaction region. The low-frequency shock motion can be seen in the wall pressure spectra. Analyses of the turbulence kinetic energy budget indicate that both diffusion and transport significantly increase near the crests,balanced by an amplified dissipation in the near-wall region.Proper orthogonal decomposition analyses show that the most energetic structures are associated with the separated shock and the shear layer over the bubbles. Only the bubbles in the first two troughs are dominated by a low-frequency enlargement or shrinkage.
1. Introduction
Shock-wave and Turbulent-Boundary-Layer Interactions(STBLIs) occur frequently in a wide range of compressible flow problems, both internal and external. STBLIs can result in high levels of fluctuating pressure and thermal loads, and are responsible for inlet instability,thermal and structural fatigue, and aerodynamic performance degradation,among other phenomena. Owing to the great technological interest of the subject, a great effort has been made over the past 60 years to understand the complicated flow phenomena exhibited in STBLIs. Comprehensive reviews of this active research field have been given by Gaitonde1and by Clemens and Narayanaswamy.2The underlying mechanism of the interaction remains incompletely understood,although truly remarkable advances have been made over the last decade. Some questions of great interest are still open and await further study, such as that of peak heating in the region of strong interaction and the large-scale low-frequency unsteadiness.An in-depth understanding of STBLIs is also necessary to create effective strategies for flow control and efficient aircraft design.
Compression-corner and incident-shock interactions,3which are classified by the generation method of the shock,are two canonical flow configurations and are routinely used to study important aspects of STBLIs. Many previous studies have been dedicated to wall heat transfer rates, low-frequency unsteadiness and the evolution of turbulence. For example,Pasha and Juhany4proposed a new shock-unsteadiness k-w mode with variable Prandtl number to accurately predict heat flux in the interaction region.Souverein et al.5investigated the effects of interaction strength on unsteadiness. It was conjectured that both upstream and downstream mechanisms were at work in all interactions, but the dominant unsteadiness mechanism depended on interaction strength. Lee and Wang6experimentally studied the shock motion in a hypersonic STBLI. They found that the shock oscillation was the consequence of the coherent structures in the separation region.Morgan et al.7performed large-eddy simulations of an STBLI and found that an increase in shock strength resulted in an increase in the intensity of low-frequency oscillations. Tong et al.8carried out Direct Numerical Simulations (DNSs) of compression ramps to study the effect of the turning angle on the mechanism of turbulent kinetic energy transport.
Considerable research works have been done on the effects of the thermal conditions of the wall on the characteristics of STBLIs. The interactions on a compression ramp with cold and nearly adiabatic walls were experimentally investigated by Spaid and Frishett,9who observed that separation distance greatly decreased due to wall cooling. A similar observation was made by Jaunet et al.10They attributed the increased interaction length scales to changes in the incoming conditions of the wall.Zhu et al.11proposed a semi-theoretical formula to estimate the effect of wall temperature on separation length.Bernardini et al.12performed DNSs of STBLIs with different ratios of wall temperature to recovery temperature. They found that the fluctuating wall heat flux was slightly influenced by low-frequency shock motion and related peak heating to turbulence amplification in the interaction.
The vast majority of previous experimental and numerical studies have been concerned with STBLIs that occur on a theoretically smooth surface.However,a geometrically rough surface is more commonly encountered in practical situations.STBLIs over a rough surface can be particularly severe when the surface is sufficiently rough to induce supplementary shock and expansion waves,interacting with impinging and reflected shocks.
To the best of our knowledge,little work has been done on STBLIs over a rough surface. Disimile and Scaggs13experimentally studied a hypersonic compression ramp with a rough surface. They observed that the flow separation was significantly enlarged in the presence of roughness.Similar behavior was also observed by Inger,14for example, even low levels of roughness significantly increased upstream influence and enhanced the separation in STBLIs. In addition, Babinsky and Inger15investigated impinging STBLI over surface with sand-grain roughness and different roughness heights and sudden changes in surface properties. The interaction length was strongly affected and the upstream influence scaled very well with the roughness-modified incoming-displacement thickness for all cases. For a small wedge angle and limited roughness height, there was no incipient separation found. Recently,Joy et al.16numerically studied the effects of surface waviness on impinging STBLIs using Reynolds-averaged Navier-Stokes simulations. They found that surface amplitude had a more dominant effect on mean flow than the wavelength of the waviness.
The purpose of this study is to characterize the effects of waviness on the separation bubble motion, turbulence kinetic energy and low-frequency unsteadiness in SBLTIs. We perform DNSs for the interaction between a strong impinging shock wave and a wavy-wall with large surface amplitude.The shock angle selected is sufficiently large to cause massive separation in the interaction without a wavy-wall. In-depth numerical analyses are carried out to isolate the effects of waviness, using a direct comparison with STBLIs on a flatplate under exactly the same flow conditions.
The remainder of this paper is organized as follows. The numerical methodology is briefly described in Section 2. In Section 3, the results are analyzed and compared with experimental data,with an emphasis on the modifications to the separation bubble, unsteadiness, and Turbulence Kinetic Energy(TKE). The conclusions are presented in Section 4.
2. Methodology
2.1. Flow configuration

Fig. 1 Sketch of flow configuration.
Fig. 1 presents a sketch of the flow configuration used in this study. A spatially developing Turbulent Boundary Layer(TBL) interacts with an impinging oblique shock wave over a wavy-wall. The computational domain normalized with a millimeter unit is 473 mm×60 mm×14 mm in the streamwise(x), wall-normal (y), and spanwise (z) directions, respectively.Unless otherwise stated,the reference length scale is a millimeter unit hereafter. As shown in Fig. 1(b), the surface of the wavy-wall is described as

with A,nw,and Lwbeing the surface amplitude,wave number,and total length of the wavy-wall, respectively. In this study,A=1.95,nw=4 and Lw=60.Here,Lwis close to the length of separation region on the flat-plate.
The shock generator used in previous experiments is not included in this simulation. Instead, a jump in the flow variables satisfying the Rankine-Hugoniot relations is imposed at the upper boundary to generate the incident shock. The shock angle is β=30° and the nominal impinging point is xin=0, located at the center of the wavy-wall. The incoming TBL is generated in laminar-to-turbulent transition,17where a region of blowing and suction is imposed on the wall to trigger the transition. Then, a spatially fully developed TBL is obtained upstream from the interaction.The freestream Mach number is Ma∞=2.9,and the Reynolds number based on the momentum thickness of the incoming TBL at the reference plane is Reθ=2400, closely resembling the results of the experiments of Bookey et al.18and the DNS of Priebe et al.19The reference plane, denoted by xrefin Fig. 1(a), is placed at x=-60.
Two DNS cases are examined, one corresponding to the interaction over a wavy-wall and the other on a flat-plate.All of the flow conditions are precisely the same for both cases,with the exception of the difference in the wall surface.
2.2. Numerical method
The governing equations are the three-dimensional compressible unsteady Navier-Stokes equations for a perfect gas in curvilinear coordinates. The equations are normalized by the inflow parameters and are directly solved using an DNS code,Opencfd-SC. This solver has been extensively validated in our previous studies of compression ramp8,20and impinging shock interactions.21Additional details for the solver are supplied by Tong et al.20We use a fourth-order bandwidth-optimized weighted essentially nonoscillatory scheme incorporating a combination of absolute and relative limiters22and the Steger-Warming method to calculate convective terms. The viscous terms are discretized with an eighth-order central difference scheme. Time integration is performed using the third-order TVD Runge-Kutta method.23
Fig. 2(a) presents a sketch of the computational grid with an expanded view of the portion near the wavy-wall in Fig. 2(b). A mesh with 3200×200×140 grid points in the x, y, and z directions, respectively, is used for both cases. In the x direction, 1900 grid points are equally concentrated in the region -60 <x <60 to guarantee sufficient resolution of STBLIs over the wavy-wall. In the y direction, the grid points are clustered near the wall and hyperbolically stretched from the wall to the upper boundary, so that 115 grid points are located inside the TBL. A uniform grid distribution is applied in the z direction. Based on the wall units at xref, the resolution in the interaction region isΔx+=5.2,Δy+w=0.7,andΔz+=7.5, respectively, values that are comparable with those of Priebe et al.19. Note that the superscript+denotes normalization in wall units at xref, and subscript w denotes the wall parameters.

Fig.2 Sketch of computational grid plotted with every ten-and five-interval node shown in x and y directions.
The laminar profile is imposed at the domain inlet x=-365, taken from the results of Li et al.24for a flat plate under the same inflow conditions. The blowing and suction region ranges from x=-335 to x=-315, with periodic normal-velocity disturbances being imposed at the wall. The disturbance amplitude and frequencies are taken from the recent simulation of Tong et al.25A non-slip condition is enforced at the isothermal wall, with the temperature fixed at Tw=307 K.The non-reflecting boundary condition is applied at the outlet and at the upper boundary. A region of progressively coarsened grid points is set in the streamwise direction to inhibit the reflection of spurious disturbances. In the spanwise direction, periodic boundary conditions are enforced.
To validate the extent of the spanwise domain, two-point correlations of the velocity components Raaat xrefare shown in Fig. 3 as a function of the spanwise spacing Δz. The correlation is defined using the method followed by Pirozzoli et al.17The variables u,v,and w denote the velocity component in the x, y, and z directions, respectively. These profiles undergo rapid decay with increasing spanwise spacing. It is confirmed that the spanwise extent is sufficient, and the coefficient reaches zero near the half-width.

Fig. 3 Two-point correlations of velocity components at wallnormal location yn/δ=0.65 for reference plane.
After the statistically stationary state is attained, a total of 800 instantaneous flow fields are collected with a constant time interval to calculate the statistics over a time period of 15 flowthrough times.In the following analysis,the mean flow field is obtained by averaging instantaneous flow fields in time and the spanwise direction.
2.3. Incoming TBL
The properties of the incoming TBL in the reference plane are given in Table 1, where δ, δ*, θ, and Cfsignify the thickness,displacement thickness, momentum thickness, and skinfriction of the boundary layer,respectively.Satisfactory agreement is clearly obtained,with the exception of the higher Cfin the present study. This difference may be attributable to the method of turbulence generation used in this simulation. In the simulation performed by Priebe et al.19, the skin-friction and the thickness of the TBL are easily controlled by the recycling/rescaling procedure,26whereas the turbulence in the present simulation is obtained using the transition method. It is worth pointing out that the Reynolds number Reθobtained here is essentially identical to that found by Priebe et al.19
Fig.4(a)shows the mean streamwise velocity distribution at xrefin the outer scaling, where ynand U∞are the wall-normal distance and the freestream velocity, resepctively. This compares favorably with the DNS result obtained by Priebe et al.19and the experimental data from Bookey et al.18The densityscaled root mean square values of turbulence fluctuations at xref,reported in Fig.4(b),agree well with the low-speed experimental measurements of Erm and Jourbet27and the DNS data of Duan and Beekman28with high Mach number. Note that the accuracy of the current results will be further examined in the following analyses.
3. Results and discussion
3.1. Instantaneous and mean flow fields
Fig. 5 is the instantaneous density gradient field in an x-y plane, together with the fluctuating spanwise vorticity. For a better comparison with experimental results,the density gradient is transformed as follows:19
with |∇ρ| being the density gradient. The large-scale vortical structures that originated from upstream TBL are gradually lifted off, as they pass through the interaction region between the impinging and reflected shock, and they are dramatically strengthened in the downstream region. In the trough region of the wavy-wall, the density gradient is significantly decreased, and no considerable vortex structures can be observed, suggesting the presence of a separation bubble. A series of compression waves is also visible at the edge of the downstream reattachment boundary layer, which is consistent with previous observations19,21,25for the case of STBLI on a flat-plate.

Fig. 4 Mean velocity profile and turbulence intensities of incoming TBL at reference plane.

Fig.5 Instantaneous density gradient colored by iso-contours of spanwise vorticity fluctuations (Red/blue patches: ωzδ/U∞=±1.95).

Table 1 Properties of incoming TBL at xref.
The coherent vortex structures are given in Fig.6 using the Q criterion,29colored by the wall-normal distance yn.The isosurface of u/U∞= -0.1 is also shown to visualize the separation bubble. In the upstream undisturbed TBL, streamwise elongated hairpin vortices dominate in the near-wall region.The augmentation and uplift of vortical structures are clearly observed along the separated shear layer in the upper region of the wavy-wall, while the coherent structures are apparently suppressed in the trough region, with extensive reversed flow.In the downstream recovery region, massive small-scale vortical structures in the near-wall region are rapidly regenerated,along with the gradual decay of the large-scale vortical structures in the outer region of the reattachment boundary layer.
A qualitative comparison of mean spanwise vorticity fields ωzbetween the cases of the flat-plate and wavy-wall is given in Fig. 7, in which the mean streamlines are superimposed to identify the recirculation region in the interaction. Additionally, the complex shock system and the separated shear layer are approximately visualized by isolines of the pressure gradient and the mean sonic line, respectively. The results for the wavy-wall case have some similarities with those for the flatplate case. A noticeable large separation region is observed due to the strong pressure gradient imposed by the impinging shock,and the separated shock is also clearly identified before the inviscid impinging points.Moreover,the spanwise vorticity attains its maximum in the proximity of the separation point,and decreased levels are found along the separated shear layer.However, the most notable difference is the distinctive distribution of the reversed flow. Unlike the flat-plate case, here,the single large bubble is completely decomposed into four smaller bubbles, which are located in the four troughs of the wavy-wall. It is suggested that the wavy-wall exerts a strong influence on the reversed flow near the wall.The small bubbles in different troughs have quite different lengths and heights.It is clear that the second bubble is much longer and taller than the other three. The probability of occurrence of a reversed flow in different troughs shown in Fig.8 is further quantitative evidence.The second trough is dominated by high-probability behavior,where reversed flow can occur up to 90%of the time.In the other three troughs, the probability experiences a sharp decrease in the wall-normal direction,and there is only a small region that has a high probability,centering on the bottoms of the troughs.
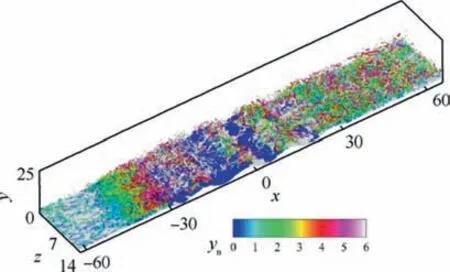
Fig. 6 Isosurface of Q criterion (Q/Qmax=0.01) colored by wall-normal distance yn with isosurface of u/U∞= -0.1 in blue.
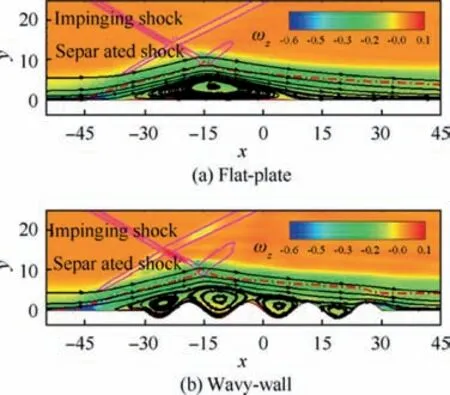
Fig. 7 Mean spanwise vorticity ωz and streamlines with isolines of |∇p| δ/p∞=3.25 in pink and sonic line in red.
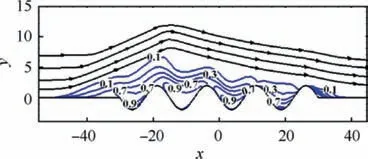
Fig. 8 Isoline of occurrence probability of reversed flow with streamlines in black.
The localized momentum transports between high- and low-speed fluids can be characterized by the Lamb vector divergence∇·L , which is defined as30

where u·∇×ω and ω·ω denote the flexion product and enstrophy, respectively. Hamman et al.30proposed that the positive and negative values of the Lamb vector divergence represent the straining and vorticity-bearing motions, respectively, and the momentum exchange is associated with the strong interaction between the regions.
Fig. 9 shows the contours of the Lamb vector divergence,where the mean velocity field is used for computation. In agreement with the findings of Tong et al.31, the distribution in the interaction region features irregularly alternating positive and negative regions. The momentum transport is mainly concentrated in the separated shear layer, and rare small-scale motions can be observed in the separation bubble for both cases. The size of these two-layer structures increases as the flow moves downstream,implying an enhancement of momentum exchange between large-scale motions.This could be associated with the formation of large coherent vortex structures as shown in Fig.5.Recalling the analyses of spanwise vortices in Fig. 7, because the distribution in the separated shear layer is relatively insensitive to the presence of the wavy-wall, the reason for the slight changes in momentum transport becomes apparent. We believe that the height of the wavy-wall used in the present study, which is low relative to the thickness of the incoming TBL, is the main factor.

Fig.9 Contours of Lamb vector divergence∇·L with sonic line in pink.
3.2. Properties of skin-friction and pressure
The instantaneous skin-friction Cfin the interaction region and an enlarged view of the wavy-wall are shown in Fig. 10(a) and (b), respectively. It is defined as

where (∂us/∂n)|wdenotes the normal gradient of the streamwise velocity usalong the wavy-wall surface.
A typically streaky structure can be seen upstream from the interaction region (x <-60), resembling the low-speed streaks in the near-wall region of the zero-pressure-gradient TBL; it disappears in the region of the wavy-wall(-30 <x <30) and reoccurs in the downstream region with a larger spanwise scale.The present observations are consistent with the results previously found for STBLI.12,25It is worth noting that although the skin-friction on the wavy-wall is mainly characterized by frequent scattered spots with negative Cf, which is related to the strong intermittency of the reversed flow,we observe that there are many positive patches that have significant levels of Cf, particularly in the rear part(0 <x <30), as shown in Fig. 10(b).

Fig.10 Instantaneous skin-friction for wavy-wall with isoline of Cf=0 in black.
The distribution of the mean skin-friction reported in Fig.11 confirms the above observations.Note that,for a better comparison, the streamwise coordinate is nondimensionalized by the separation point xsepand the boundary layer thickness δ at the reference plane. For the case of the flat-plate, a good quantitative agreement is observed with the DNS data obtained by Priebe et al.19. It is seen that the Cfcurve rapidly decreases after the separation point and remains well below the zero-line, followed by a slow increase in the recovery region.However, the wavy-wall case presents some interesting features.First,the curve is characterized by a multi-peak distribution,entirely unlike the two minima behavior for the flat-plate.Second,there are two peak values above the zero-line,and one even overshoots the upstream TBL.However,it is not surprising that skin-friction is significantly affected by the wavy-wall.Recalling the streamlines in Fig.7,we can conclude that due to the small bubbles in the latter two troughs,the high-speed separated shear layer directly impacts the latter two crests, where the overshoots of Cfoccur. Meanwhile, the larger bubbles in the first two troughs are clearly strong enough to lift up the shear layer, and then the low-speed reversed-flow plays the leading role in the formation of the peaks on the first two crests.
In Fig. 12(a), the mean wall pressure distributions pw/p∞computed for both cases are compared with the DNS results of Priebe et al.19and the experimental data of Bookey et al.18.Here,for comparison,the results are all reported as a function of the streamwise coordinate x*, defined by shifting the profiles to make the initial pressure rise coincide for all data.For the flat-plate, wall pressure is characterized by a plateau,indicating the existence of a separation bubble,and this agrees well with the DNS data reported by Priebe et al.19Due to the effects of tunnel sidewalls and the shock generator,both DNS curves obviously deviate from the experimental data in the downstream region. In the presence of the wavy-wall, a slight oscillation of wall pressure is clearly observed across the interaction region,followed by a rapid decrease at x*≈18 as a consequence of the strong expansion occurring between the fourth crest and the flat-plate (see Fig. 7).

Fig. 11 Distribution of mean wall skin-friction.

Fig. 12 Distribution of mean wall pressure and RMS of wall pressure fluctuation.
Fig. 12(b) compares the RMS of the wall pressure fluctuation, normalized by the local mean wall pressure pw. As expected, the global maximum of the fluctuation occurs near the separation point for both cases, consistent with the experiments of Dupont et al.32and Dolling and Murphy33. For the case of the wavy-wall, a significant decrease of an approximately 35% pressure fluctuation level from the maximum value is observed for the flat-plate case.Across the interaction region, the rms value on the wavy-wall oscillates between 0.06 and 0.1, unlike the bump distribution for the flat-plate.Another aspect is the peak before the fourth crest, which reaches approximately 11% of the local wall pressure, very close to the global maximum (12%). This might be due to the dramatic compression that ensues as the high-speed shear layer impacts this crest.

Fig. 13 Weighted power spectral density of fluctuating wall pressure. The separation and reattachment points (xs and xr) are indicated.
Fig. 13 gives the frequency Weighted Power Spectral Density (WPSD) of the wall pressure fluctuation as a function of the streamwise coordinate x and the Strouhal number Stδ=fδ/U∞, which helps understand the unsteadiness across the interaction region. The spectra are defined as f·P(f)/∫P(f)df,where f is the frequency and P(f)is the power spectral density. Interestingly, the spectra are characterized by similar behavior. The spectra of the incoming TBL are apparently dominated by a broadband peak at a Strouhal number of O(1), reflecting the time scale of the most energetic structures.Close to the separation point xs,a narrow low-frequency peak corresponding to a Strouhal number of O(10-2)is clearly identified,as previously found in many numerical12,19,25and experimental10,32,33studies of STBLIs. Downstream from the interaction region, the spectra indicate a peak that has higher frequencies, which are still lower than those of the incoming TBL. It is believed that the unsteady motion of the separated shock for the wavy-wall features low-frequency unsteadiness.However, as separation bubble size increases (Fig. 11), the peak frequency correspondingly shifts to a lower range of 0.005 <Stδ<0.01.
3.3. TKE analyses

To display the upper edge of the separation bubble,the isoline of Ω=0, coinciding with the separating streamline,34is also plotted. The isoline is calculated as the integral of the mean streamwise velocity in the wall-normal direction, and it presents a general picture of the bubble. The mean sonic line is used to indicate the separated shear layer. A large value of the specific TKE occurs between the separating streamline and the sonic line for both cases. The figures exhibit a similar pattern, indicating that turbulence is significantly amplified after passing through the shock,undergoes a slow decay along the separated shear layer, and gradually relaxes during the reattachment process. Moreover, the maximum values for the specific TKE in both cases have been increased by an approximate factor of 3.2 with respect to the level of the upstream TBL, and they appear in the proximity of the separation point, where the turbulence production reaches a peak.It is confirmed that the wavy-wall has little influence on the separated shear layer, as previously presented in Fig. 9. However,the effect of the wavy-wall is mainly reflected in the nearwall region.As seen in Fig.14(b),the spatial range of the separating streamline is extended, a direct consequence of the enlargement of the bubble. Compared to the case of the flatplate, the troughs of the wavy-wall are filled with more reversed flow with a lower TKE, and the crests approach regions of higher TKE.

Fig. 14 Contours of turbulence kinetic energy. The pink solid and gray dash-dotted lines represent mean sonic line and separating streamline, respectively.
We turn to the distribution of the TKE at various streamwise locations, as shown in Fig. 15. The TKE profiles at nine points are quantitatively compared in Fig. 15(b), including the upstream TBL, the bottoms of the four troughs (T1-T4),and the four crests (C1-C4) in the flow direction. The results for the flat-plate are obtained at the same locations and plotted in Fig. 15(a). In agreement with the observations of Pirozzoli and Grasso35in the case of a spatially compressible TBL and Patel et al.36for an incompressible TBL, the TKE of the incoming TBL in the near wall region clearly exhibits asymptotic behavior, defined as K ≈Ak(yn/δ)2, where Akis a constant. Although all profiles in the separation region satisfy asymptotic consistency for both cases,an utterly different evolution process is found.For the flat-plate,the TKE experiences a slight increase, resulting in a nearly unchanged Ak. For the wavy-wall,the TKE in the near-wall region at C1-C4 is significantly increased, and an opposite trend is seen at T1-T4. It is suggested that a large value of the constant Akoccurs at the crests, and a small value at the troughs.
Fig.16 shows the profile of the TKE budget at the reference plane. All of the terms that appear in the compressible TKE transport equation is listed as follows:37

where

Fig. 15 Distribution of specific TKE at various streamiwe locations.

Fig. 16 TKE budget at reference plane.

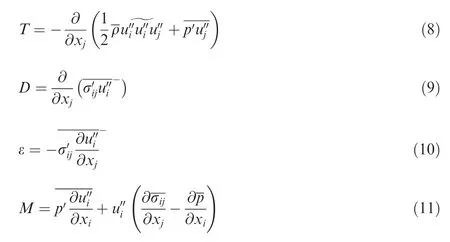
Here, C, P, T, D, ε, and M denote the advection, production, transport, viscous diffusion, viscous dissipation, and compressible mass terms, respectively.
Fig. 16 highlights the close similarities with previous numerical data of the compressible TBL at different Reynolds numbers and Mach numbers. A satisfactory agreement is obtained when all terms of the budget are normalized by the wall quantityρwμ4τ/νw. We see that the sum of all terms is nearly zero, suggesting that the budget terms are balanced.As suggested by Duan et al.28, the compressible mass term associated with the density fluctuations is negligible due to the weak compressibility of the present simulation, which is not shown in the following analyses for clarity.It is found that the production attains its peak at yn+=10 in the buffer layer.The budget in most of the boundary layer is balanced by the production and the viscous dissipation.Then the excess energy is transported by the transport term toward the wall to be dissipated.However,in the near-wall region,the viscous diffusion becomes significant and plays the leading role in the balance with the viscous dissipation,as also described in the numerical analyses of Sun et al.38and Pirozzoli and Bernardini39. In addition, the contribution from the advection term is rather small and can be neglected.
To further assess the effects of the wavy-wall on the TKE budget, Fig. 17 compares the significant terms of the TKE budget at locations C1-C4 and T1-T4 for the case of the wavy-wall.
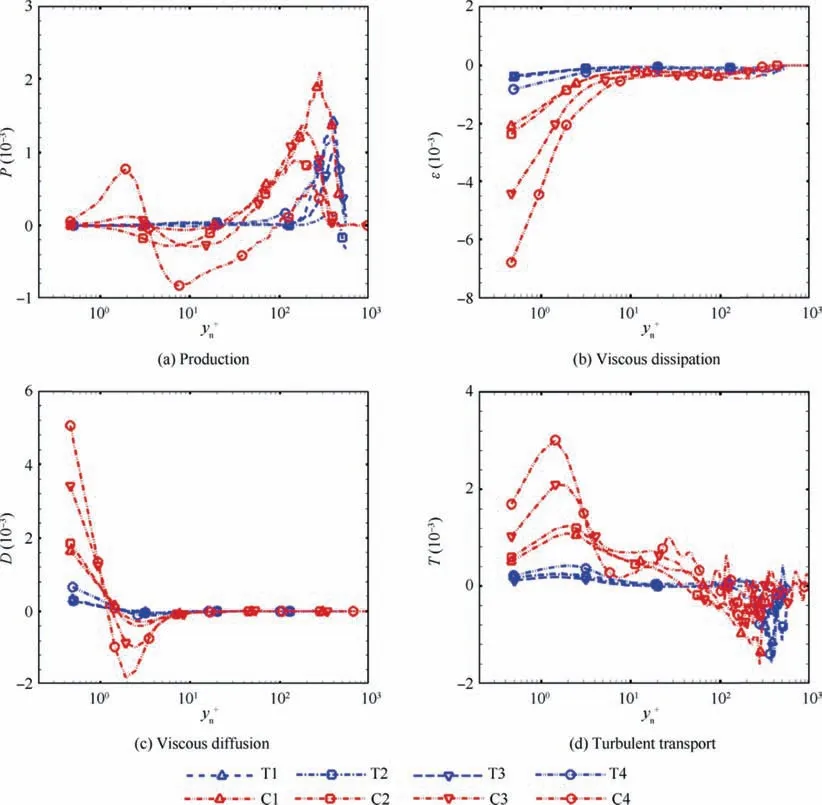
Fig. 17 Turbulence kinetic energy budget terms at various streamwise locations for wavy-wall.
Fig. 17(a) shows the distribution of the production term.Compared with the upstream TBL, all profiles exhibit a qualitatively different behavior in the outer layer.Specifically,TKE production attains large values in the separated shear layer for 100 <yn+<400, corresponding to the amplified vortical structures in the shear layer away from the wall,as also found by Pirozzoli et al.39.In the near-wall region,the production at locations T1-T4 is negligible because of the weak mean velocity gradient in the separation bubble. The main effects of the wavy-wall can be understood by looking at locations C1-C4 for the region yn+<100.Close to the wall,turbulence production strengthens, and then it falls to large negative values as it moves away from the wall. This might be associated with the locally strong compression and expansion caused by the shear layer passing over the crest, as observed in Fig. 7.
Fig. 17(b) shows the distribution of the viscous dissipation term.In general,strong dissipation is located in the vicinity of the wall. As the wall-normal distance yn+increases, its magnitude rapidly decreases. The peaks at locations T1-T4 change with rather small values, while its magnitude becomes much larger at locations C1-C4 and dramatically increases along the flow direction.The distribution of viscous diffusion is plotted in Fig.17(c).It is seen that the diffusion is dominant in the inner layer and negligible for yn+>10.At locations T1-T4,no significant difference is observed,where the diffusion gradually decays and approaches to zero in the outer layer. Different behavior is clearly identified at locations C1-C4. The strong diffusion in the proximity of the wall exhibits a rapid decrease,attaining a large negative value near the wall and finally returning to zero. This trend is significantly enhanced at locations C3 and C4.
In Fig. 17(d), we present the distribution of the turbulent transport term.Although the profiles for all locations are characterized by similar behavior, the magnitudes at locations C1-C4 are dramatically increased,over those at T1-T4.Combined with the amplified diffusion near the wall,it can be reasonably inferred that the process of transporting the excess turbulence produced in the outer layer towards the wall is also proportionally enhanced and participates in balancing the remarkably amplified dissipation at the crests of the wavy-wall.
3.4. Proper orthogonal decomposition
To extract coherent structures related to the unsteadiness in STBLIs, the instantaneous spanwise averaged streamwise velocity field Ua(x,y,t)is decomposed by the snapshot Proper Orthogonal Decomposition (POD) method. The decomposition is defined as40

where <>denotes the time average, and N is the total number of the POD modes. Here, ai(t) and Φi(x, y) are the time coefficient and eigenmode for the ith mode, respectively. Further detailed description of the POD method can be found in Ref.40.
The POD analysis consists of 800 snapshots, sampled at a constant time interval of 1.25δ/U∞. As a result, the resolvable Strouhal number is in the range 0.001 <Stδ<0.4. The low sampling rate is used to cast some light on the low-frequency unsteadiness, as previously discussed in Fig. 13. For both cases, only a subdomain covering the region of-60 <x <60 and 0 <y <16 is extracted to perform the modal analyses, where the focus is on the interaction region.

Fig. 18 Energy for POD modes.

Fig. 19 Pre-multiplied energy spectra of time coefficients for POD modes. Each curve is normalized by its maximum and shifted upward for clarity.
Fig. 18 quantitatively compares the energy distribution of the POD modes for both cases. The normalized energy for the ith mode is defined as λi/Etolto represent the fractional contribution,with λiand Etolbeing the ith eigenvalue and total energy, respectively. As shown in Fig. 18(a), the energy distributions are quite similar for the two cases. The profiles undergo a rapid decline within the first few modes, approximately obeying the scale of i-0.9. This is consistent with the observations of Piponniau et al.41in the experiments of STBLI.Note that the differences between the two cases can be seen from the magnitude of the fractional contribution.In particular, the first mode contributes 19% and 59% to the total energy Etol, for the wavy-wall and the flat-plate, respectively.It is indicated that the largest-scale structures are significantly weakened in the presence of the wavy-wall. On the contrary,the other modes for that case exhibit a remarkable increase in energy. We note that the existence of the wavy-wall results in energy redistribution between the large and the small scales.The cumulative energy,shown in Fig.18(b),confirms the findings.The increasing contribution from the higher-order modes can be identified by the dramatic decrease in the growth rate of the cumulative energy. For the wavy-wall, the first 100 modes are needed to capture 80%of the total energy,but this number decreases to 24 for the flat-plate,which means that more largeorder modes play important roles in the interaction region.
Fig.19 shows the pre-multiplied energy spectra for the time coefficient ai(t) of modes for the wavy-wall. Here, to analyze the unsteadiness of the low-order and high-order modes, five POD modes are selected: i=1, 10, 40, 100, and 200, respectively. For mode 1, the spectrum is mainly characterized by low frequencies, and multiple sharp peaks appear at Stδ≈0.006, 0.01 and 0.02, almost identical to the typical Strouhal number of the wall pressure fluctuations at the separation point (Fig. 13(b)). Furthermore, the dominant Stδincreases with the increase in the mode number. It can be seen that,for mode i >100,the spectrum is more broadband,with most of the energy appearing around Stδ≈0.4,close to the Strouhal number typically found in the fully developed TBL.
In Fig. 20, the spatial distribution of the selected 15 POD modes are plotted as contours of Φi(x,y).The key characteristic of the first mode is the high level of the fluctuation, mainly found along the separated shock, the origination of the shear layer near the separation point, and the first two troughs of the wavy wall. No considerable fluctuation is observed in the incoming TBL. Clearly, modes 2-40 have some similarities with the first mode, but the length scale in the streamwise direction is relatively decreased, particularly in the rear part of the shear layer. These modal structures appear similar to the shedding of the shear layer large-scale vortical structures,as observed by Dupont et al.42. The topology of the highorder modes (i=100 and 200) appears quite different from that of the low-order modes.It is characterized by an alternating small-scale structure that originates from the upstream TBL,develops along the shear layer at the apex of the bubble,and convects downstream in the reattachment region.
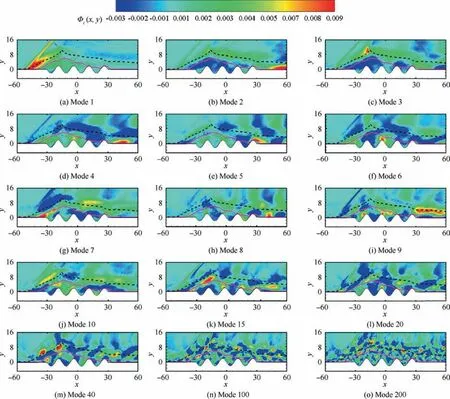
Fig. 20 Spatial distribution of selected 15 POD modes with sonic line in pink and separating streamline in black.
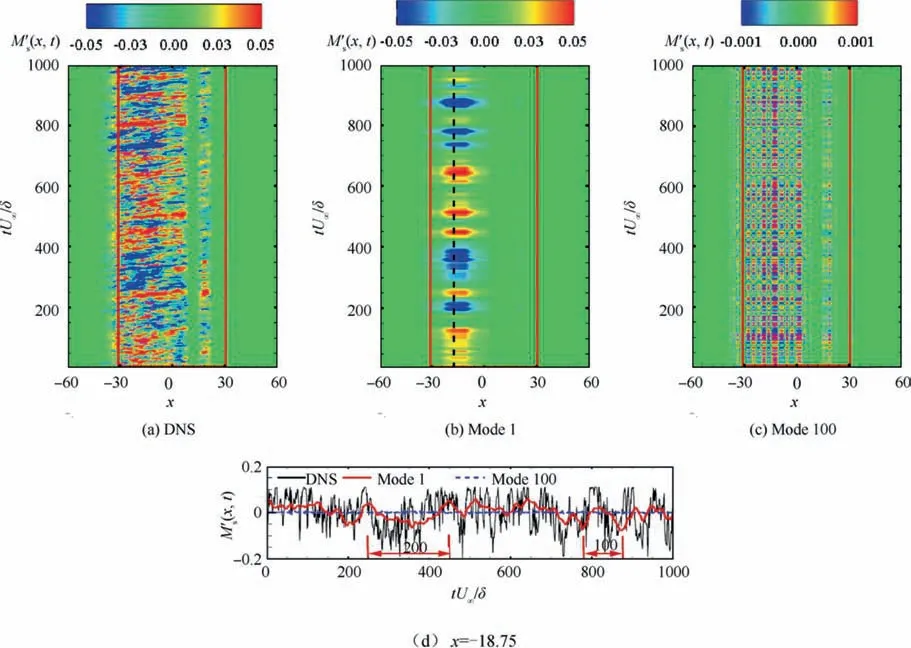
Fig. 21 Spatial-temporal map of separation bubble fluctuationM′s(x,t)for DNS and reconstruction from mode 1, mode 100 and time series of fluctuation at× = -18.75, denoted by black dash line in (b). The red box corresponds to the streamwise region of the wavywall.
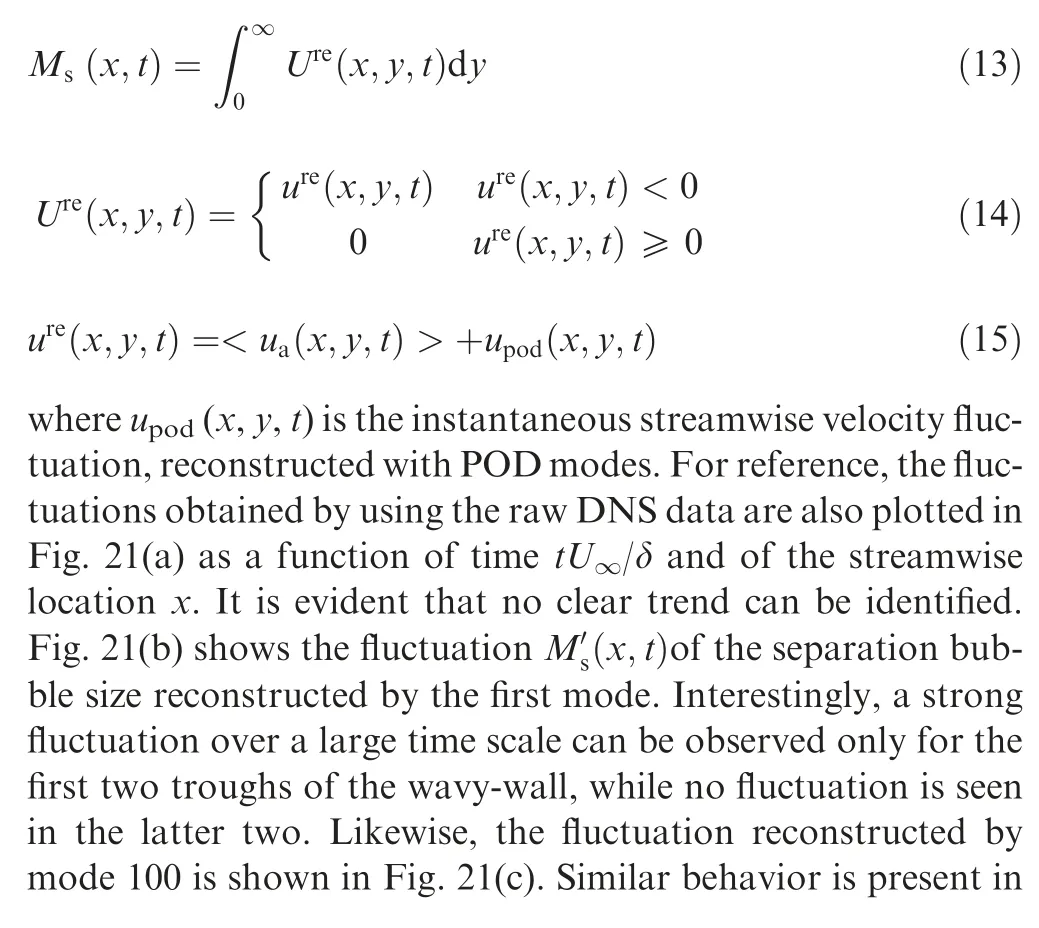
For further details on the unsteadiness of the separation bubble for the case of the wavy-wall,the reconstructions using POD modes 1 and 100 are shown in Fig. 21. The size of the reconstructed bubble at a certain streamwise location is defined as follows:
4. Conclusions
(1) A DNS of impinging STBLIs on a wavy-wall was carried out. The DNS data are systematically compared against the interaction on a flat-plate under similar flow conditions. The presence of the wavy-wall significantly alters the flow field in the near-wall region,but has little effect on the outer layer. The large separation bubble is completely decomposed into four different smaller bubbles confined in the troughs.
(2) The distributions of the skin friction and the pressure both strongly depend on the relative position of the crests and troughs of the wavy-wall.Local peaks appear at the rear part of the interaction. The spectra of the fluctuating wall pressure on the wavy-wall evidence the existence of low-frequency shock motion in the interaction region.
(3) The TKE budget is analyzed in detail.Compared to the budget profiles at the troughs, negative production appears near the crests. The dissipation in the near wall region is significantly amplified to balance the proportionally increased turbulent diffusion and transport.
(4) POD analyses of the streamwise velocity field are performed. The dominant modes are associated with the separated shock, the shear layer and the bubbles in the troughs. Low-frequency breathing motion of the bubbles only occurs in the first two troughs, where highfrequency oscillations related to high-order modes are weak and observed in the four troughs.
Declaration of Competing Interest
The authors declare that they have no known competing financial interests or personal relationships that could have appeared to influence the work reported in this paper.
Acknowledgements
This study was co-supported by the National Key Research and Development Program of China (Nos. 2019YFA0405300 and 2016YFA0401200),the National Natural Science Foundation of China (Nos.11972356 and 91852203), LHD Youth Innovation Fund(No.LHD2019CX04)and National Numerical Wind Tunnel Project.
 CHINESE JOURNAL OF AERONAUTICS2021年5期
- CHINESE JOURNAL OF AERONAUTICS的其它文章
- Ferrofluid moving thin films for active flow control
- Preliminary study on heat flux measurement data of TT-0 flight test
- An analysis and enhanced proposal of atmospheric boundary layer wind modelling techniques for automation of air traffic management
- Jet sweeping angle control by fluidic oscillators with master-slave designs
- Hot deformation behavior and microstructure evolution of the laser solid formed TC4 titanium alloy
- Electrochemical trepanning with an auxiliary electrode
